Telecom Service Assurance Market Size and Share
Market Overview
| Study Period | 2020 - 2031 |
|---|---|
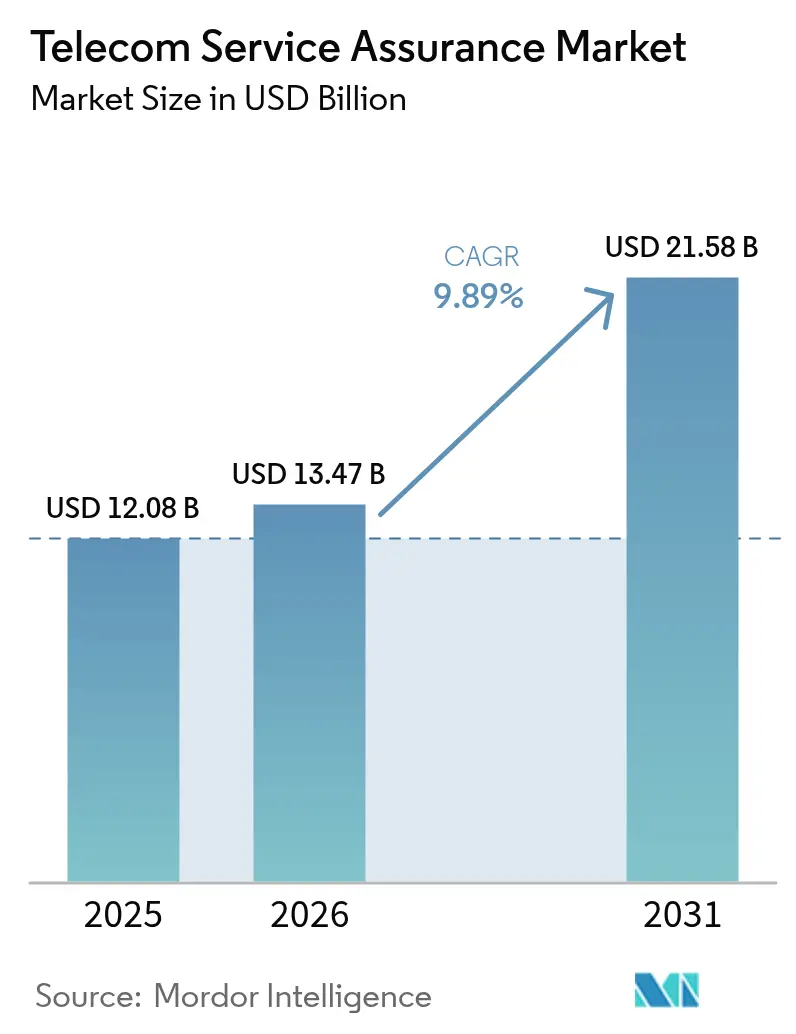
| Market Size (2026) | USD 13.47 Billion |
| Market Size (2031) | USD 21.58 Billion |
| Growth Rate (2026 - 2031) | 9.89% CAGR |
| Fastest Growing Market | Asia Pacific |
| Largest Market | North America |
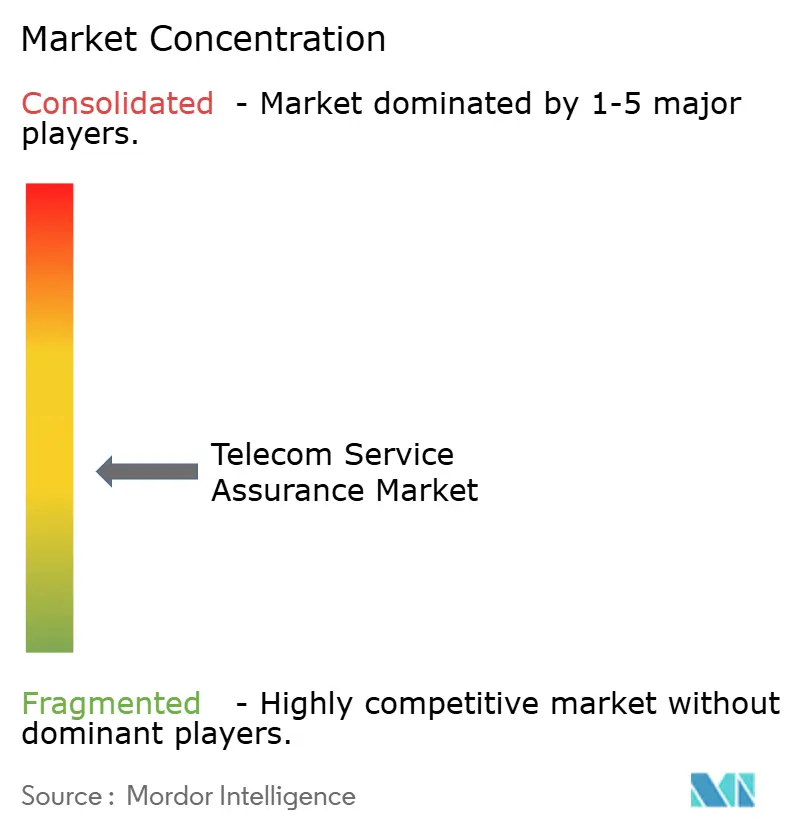
| Market Concentration | Medium |
Major Players *Disclaimer: Major Players sorted in no particular order Image © ���ϲ�����. Reuse requires attribution under CC BY 4.0. | |
Telecom Service Assurance Market Analysis by ���ϲ�����
The Telecom service assurance market size was valued at USD 12.08 billion in 2025 and estimated to grow from USD 13.47 billion in 2026 to reach USD 21.58 billion by 2031, at a CAGR of 9.89% during the forecast period (2026-2031). Operators are shifting from reactive break-fix workflows toward AI-driven, closed-loop quality orchestration that spans 5G standalone cores, Open RAN domains, and multi-cloud OSS/BSS stacks, creating sustained demand for platforms that unify fault, performance, and service-quality analytics. Solutions remained the revenue anchor in 2025, yet managed services are scaling quickly as mid-tier operators outsource integration complexity. Cloud-native adoption also accelerates because containerized architectures support elastic scaling, rapid feature rollout, and hybrid topologies that honor data-sovereignty rules. Competitive intensity is moderate: legacy OSS/BSS incumbents still hold roughly half the installed base, but niche, API-first challengers are winning greenfield Open RAN deals and hyperscalers are folding basic assurance tools into broader automation suites, compressing standalone software margins.
Key Report Takeaways
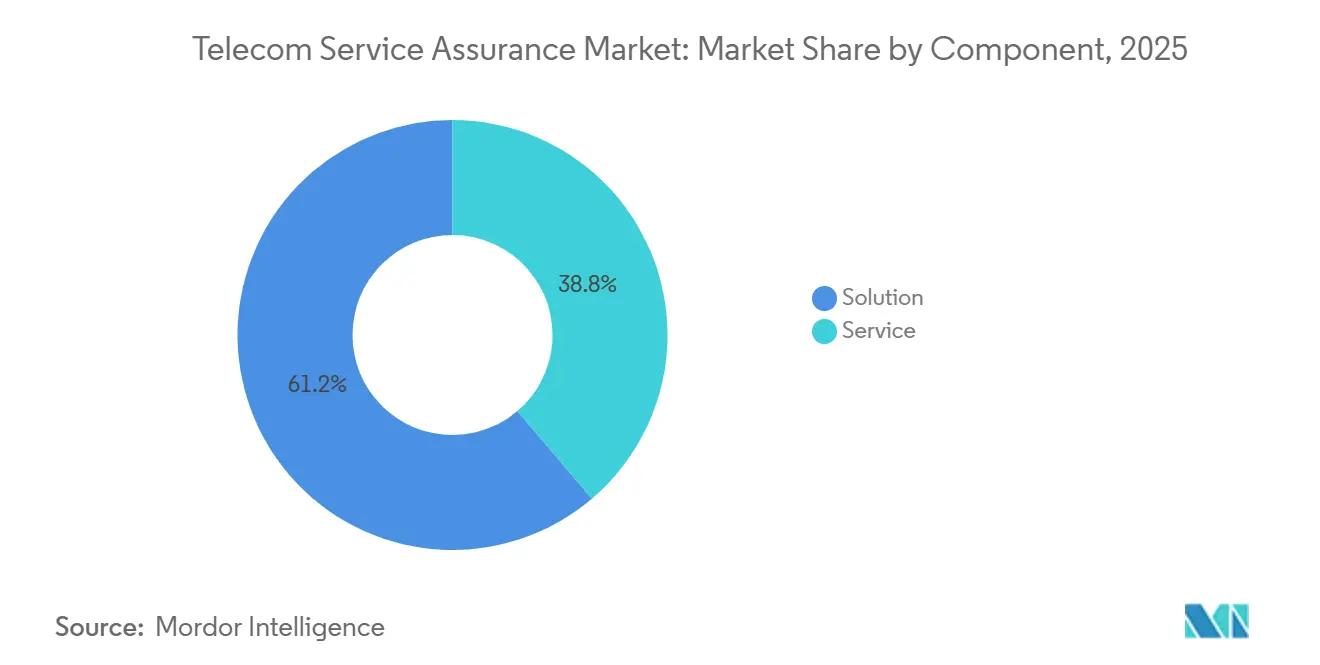
- By component, solutions captured 61.23% of 2025 revenue, while managed services are advancing at a 10.23% CAGR through 2031
- By operator type, mobile operators held 71.12 of % Telecom service assurance market share in 2025 and are expanding at a 10.21% CAGR to 2031
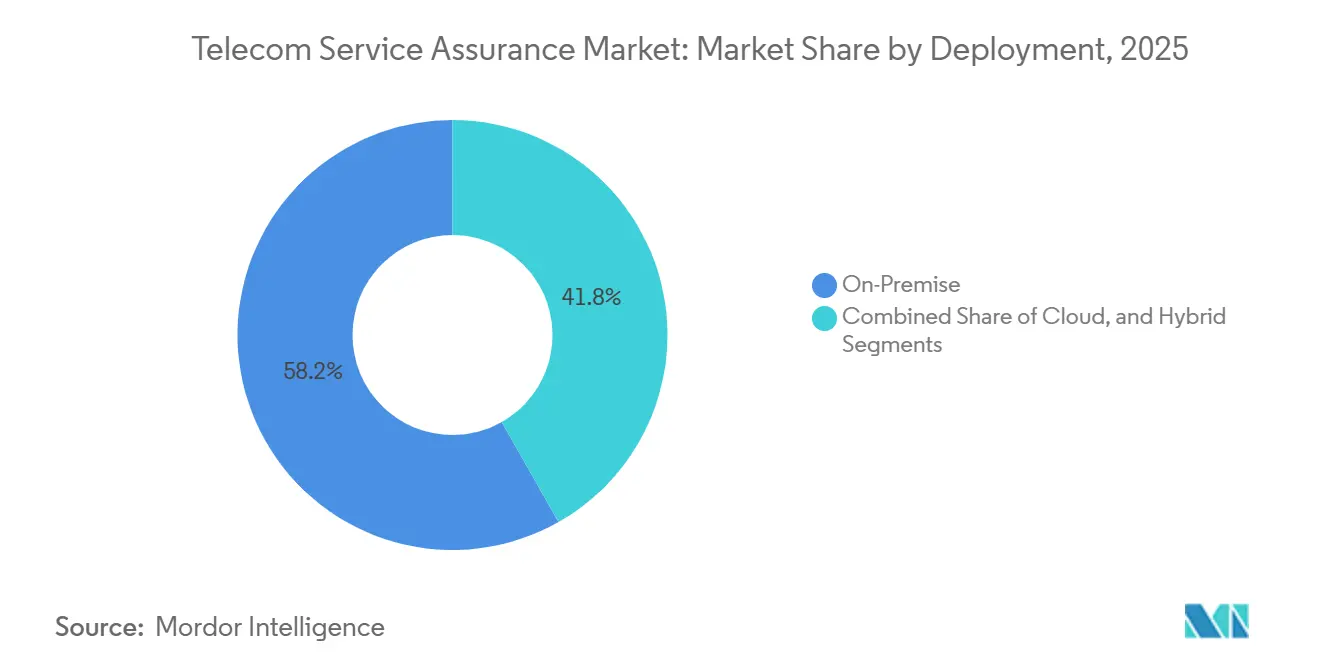
- By deployment mode, on-premise options retained 58.21% share of the Telecom service assurance market size in 2025, but cloud-based models are forecast to grow at a 10.36% CAGR to 2031
- By enterprise size, large enterprises accounted for 73.12% spending in 2025, whereas SMEs are projected to record a 10.14% CAGR through 2031
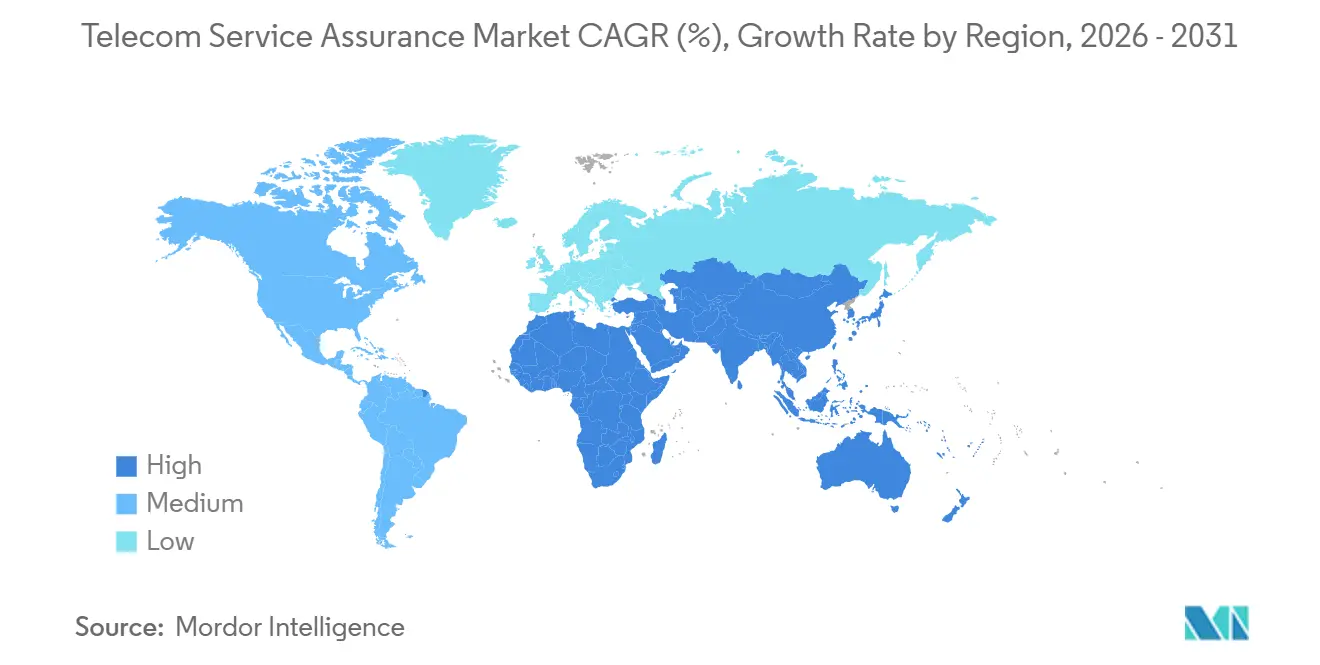
- By geography, North America led with 37.21% revenue share in 2025; Asia-Pacific represents the fastest-growing region at a 10.78% CAGR to 2031
Note: Market size and forecast figures in this report are generated using ���ϲ�����’s proprietary estimation framework, updated with the latest available data and insights as of 2026.
Global Telecom Service Assurance Market Trends and Insights
Drivers Impact Analysis*
| Driver | (~) % Impact on CAGR Forecast | Geographic Relevance | Impact Timeline |
|---|---|---|---|
| Proliferation Of 5G Networks And Complex Multi-Vendor Environments | +2.8% | Global, Led By APAC And North America | Medium Term (2–4 Years) |
| Rising Demand For Real-Time Quality Of Experience Monitoring | +2.3% | North America And Europe | Short Term (≤ 2 Years) |
| Increasing Adoption Of Cloud-Native OSS/BSS Architectures | +1.9% | North America And Europe Early Adopters, APAC Fast Follower | Medium Term (2–4 Years) |
| Surge In Mobile And IoT Traffic Volumes | +1.7% | APAC Core With Spillover To Middle East And Africa | Long Term (≥ 4 Years) |
| Energy-Aware Assurance Mandated By Net-Zero Telco Roadmaps | +0.9% | Europe Regulatory-Driven, North America Voluntary | Long Term (≥ 4 Years) |
| Monetization-Linked Assurance For 5G Network-Slicing SLAs | +0.8% | North America And APAC Enterprise Segments | Medium Term (2–4 Years) |
| Source: ���ϲ����� | |||
Proliferation of 5G Networks and Complex Multi-Vendor Environments
5G standalone cores and Open RAN architectures splinter radio, transport, and core functions across multiple suppliers, forcing operators to monitor isolated slices end-to-end. China Mobile correlated counters from Huawei, ZTE, and Ericsson across 1.2 million 5G sites using AI anomaly detection that flags cross-vendor signaling mismatches before service degradation.[1]China Mobile, “Annual Report 2025,” CHINAMOBILELTD.COM Verizon’s enterprise private networks guarantee 99.999% uptime, achievable only through closed-loop assurance that auto-remediates configuration drift. Operators accept a 15-20% cost premium over integrated 4G stacks because multi-vendor freedom accelerates time-to-market for differentiated 5G slices.
Rising Demand for Real-Time Quality of Experience Monitoring
Factory automation, autonomous fleets, and public-safety users require sub-10 ms latency and application-layer visibility, shifting assurance from network KPIs to user-centric QoE metrics. AT&T embeds probes that alert FirstNet responders when video quality drops below thresholds, supporting more than 5 million connections in 2025. Deutsche Telekom’s MagentaBusiness 5G campus networks give industrial clients APIs that link production stoppages to network anomalies, cutting mean-time-to-repair by 40%. Vendors capable of ingesting HTTP, video MOS, and VoIP jitter alongside traditional counters win share in the Telecom service assurance market.
Increasing Adoption of Cloud-Native OSS/BSS Architectures
Containerized microservices let operators spin up per-slice monitors in minutes and scale analytics elastically, yet introduce pod-level failures invisible to legacy tools. Telefónica’s UNICA Next deploys assurance as Kubernetes services, reducing provisioning cycles from 3 weeks to 5 minutes. Orange reduced infrastructure costs 30% via auto-scaling and offloading historical analytics to public clouds.[2]Orange, “Investor Presentation 2025,” ORANGE.COM Hybrid topologies that keep subscriber data on-premises while bursting compute to public clouds require federated orchestration, fueling further growth in the Telecom service assurance market.
Surge in Mobile and IoT Traffic Volumes
Global monthly mobile data hit 140 exabytes in 2025, straining capacity and elevating congestion risk, especially in video and cloud-gaming hotspots. Airtel India added 50 million 5G users in a single year, harnessing predictive traffic modeling to prevent cell-site overloads. IoT registrations topped 17 billion, with NB-IoT devices stressing control planes; specialized probes tracking attach success rates, therefore gaining traction. Proactive congestion management reduces churn and underpins the expansion of the Telecom service assurance market across emerging geographies.
Restraints Impact Analysis*
| Restraint | (~) % Impact on CAGR Forecast | Geographic Relevance | Impact Timeline |
|---|---|---|---|
| High Implementation And Integration Costs For Legacy Networks | -1.4% | Global, Acute In Emerging Markets | Short Term (≤ 2 Years) |
| Data Privacy And Security Concerns In Multi-Cloud Deployments | -1.1% | Europe GDPR-Driven, North America Sector Regulations | Medium Term (2–4 Years) |
| Talent Scarcity In AI-Driven Assurance Engineering | -0.7% | Global, Severe In APAC And South America | Medium Term (2–4 Years) |
| Fragmented Governance Of API-Based Open RAN Assurance Standards | -0.5% | Global With Regional Variations | Long Term (≥ 4 Years) |
| Source: ���ϲ����� | |||
High Implementation and Integration Costs for Legacy Networks
Retrofitting 2G-4G equipment with cloud-native probes demands middleware that translates proprietary protocols, often swallowing 20-30% of modernization budgets and adding up to 18 months to project timelines.[3]Deloitte, “TMT Predictions 2025,” DELOITTE.COM Safaricom’s AI-assurance overlay on a Huawei-centric network slipped by 9 months and cost an additional USD 12 million because legacy HLRs lacked open APIs. Many mid-tier carriers thus defer upgrades, slowing market penetration of Telecom service assurance in price-sensitive regions.
Data Privacy and Security Concerns in Multi-Cloud Deployments
GDPR stipulates that EU-resident data must remain within the bloc, complicating hybrids that rely on AWS or Azure analytics nodes located abroad. An EDPB audit found that 18% of European operators inadvertently exported call detail records, resulting in EUR 47 million (USD 53 million) in fines.[4]European Data Protection Board, “Annual Report 2025,” EDPB.EUROPA.EU Encrypting telemetry streams adds 10-15% latency, undercutting real-time objectives. Ransomware attacks on OSS/BSS databases, including Orange Spain’s 72-hour outage, heighten operator caution, tempering cloud adoption rates within the Telecom service assurance market.
*Our updated forecasts treat driver/restraint impacts as directional, not additive. The revised impact forecasts reflect baseline growth, mix effects, and variable interactions.
Segment Analysis
By Component: Solutions Anchor Revenue, Managed Services Accelerate
Solutions commanded 61.23% of 2025 spending and remain the operational bedrock that Network Operations Centers rely on for event correlation, root-cause isolation, and KPI dashboards. Fault-management modules dominate because Open RAN triples alarm volumes compared with integrated RAN, requiring machine-learning filters to suppress noise. Performance-management analytics gain prominence as operators expose throughput and latency portals to enterprise customers, a transparency that shrinks SLA disputes. Service-quality management now blends application telemetry with network counters, illustrated by Ericsson’s suite that aligns YouTube buffering scores with RAN congestion, thereby reinforcing vendor lock-in across the Telecom service assurance market.
Managed services have posted a 10.23% CAGR because outsourcing converts CapEx into OpEx and provides scarce AI skills on demand. Accenture and Infovista guarantee uptime SLAs and absorb multivendor integration risk, an offer resonating with Latin American and African operators that struggle to hire data scientists. Intelligent assurance-as-a-service reduces mean time to repair by up to 40% in China Telecom and SK Telecom trials. The trend is accelerating the shift in the Telecom service assurance market from perpetual licenses to subscription models, reshaping vendor revenue streams.


By Operator Type: Mobile Dominance Persists Amid Fixed-Mobile Convergence
Mobile operators captured 71.12% Telecom service assurance market share in 2025, sustained by 5G slicing that mandates per-slice SLA validation and real-time QoE analytics. Radio-access optimizations, such as beamforming tuning, require sub-second feedback loops, which fixed broadband environments seldom need. Fixed operators, however, are modernizing assurance to support fiber rollouts and wholesale bitstream services, using similar AI toolkits, albeit with longer polling intervals.
Convergence is blurring distinctions: Verizon’s 5G Home product bundles fixed wireless access with mobile plans, requiring unified dashboards correlating indoor router KPIs with macro-cell backhaul health. Cable operators like Comcast monitor DOCSIS modems and CBRS small cells through a single data lake, collapsing silos and reducing truck rolls. This unified viewpoint reinforces the growth trajectory of the Telecom service assurance market as operators seek platform consolidation.
By Deployment Mode: Cloud Gains Ground, Hybrid Models Emerge
On-premise deployments retained 58.21% share in 2025 because operators prefer local control over subscriber data and deterministic latency. Still, cloud-native assurance is expanding at a 10.36% CAGR as container orchestration, CI/CD pipelines, and managed Kubernetes services ease migration hurdles. Amdocs and Nokia now ship SaaS variants hosted on Azure or AWS, accelerating feature velocity and reducing upgrade windows from quarterly to weekly.
Hybrid designs dominate greenfield 5G builds: Vodafone processes streaming telemetry in on-premise clusters for latency reasons yet archives historical data in AWS Glacier, trimming infrastructure cost 25%. Sovereign-cloud offerings such as Deutsche Telekom’s Open Telekom Cloud allay data-residency fears while still delivering elastic compute. The flexibility of hybrid deployment underpins the Telecom service assurance market’s mid-term momentum, particularly in jurisdictions with stringent privacy rules.

By Enterprise Size: Large Carriers Lead, SMEs Embrace Managed Services
Tier-1 carriers accounted for 73.12% of 2025 revenue because their networks generate petabyte-scale telemetry that requires bespoke, high-availability assurance clusters. China Mobile integrates Ericsson and Nokia stacks via custom middleware, a multiyear project beyond the reach of most small operators. In contrast, SMEs are forecast to post a 10.14% CAGR by adopting multi-tenant, pay-as-you-grow models hosted by MYCOM OSI or Infovista, capturing 80% of premium features at roughly one-third the cost.
Millicom’s Tigo outsourced assurance to IBM across nine Latin American markets, unlocking predictive maintenance without hiring in-house data scientists. The skills shortage amplifies the appeal of managed services and channels incremental spend into the Telecom service assurance market, particularly across South America and Sub-Saharan Africa.
Geography Analysis
North America held 37.21% of global revenue in 2025 owing to large-scale 5G enterprise rollouts and regulatory grants such as the FCC’s USD 9 billion Rural 5G Fund. Verizon’s 5G Edge, co-located with AWS Wavelength, demands real-time correlation of edge compute latency and RAN health to satisfy autonomous-vehicle developers. AT&T’s FirstNet leverages end-to-end QoE probes to uphold mission-critical video streams, justifying a USD 400 million assurance budget. Canada’s Rogers invested CAD 150 million (USD 111 million) in AI analytics after a 2022 outage exposed monitoring gaps, while Mexico’s América Móvil prioritizes cloud-native deployments to scale with rapid subscriber growth.
Asia-Pacific is the fastest runner, projected to grow at a 10.78% CAGR, underpinned by China’s trio of state carriers, each installing hundreds of thousands of 5G macro cells. India’s Airtel and Jio now feed billions of counters per hour into AI engines to sustain QoS for subscriber bases topping 400 million. Japan’s NTT DoCoMo collaborates with Rakuten Mobile on Open RAN assurance, validating API-driven telemetry pipelines. South Korea embeds power-consumption analytics to meet carbon-neutral goals, while Australia’s Telstra deploys predictive maintenance across remote mining sites. Managed services flourish in Southeast Asia as Singtel, AIS, and Globe Telecom sidestep talent shortages by outsourcing to regional system integrators.
Europe’s regulatory mix of GDPR and net-zero commitments shapes procurement. Vodafone correlates traffic routing with kilowatt-hours consumed to progress toward its 2040 Scope 3 target, while Deutsche Telekom exposes real-time APIs that manufacturing clients link to production metrics. Orange’s auto-scaling reduced assurance costs by 30%, inspiring copycats among smaller operators. The Middle East funds smart-city megaprojects like Saudi Arabia’s NEOM, pushing STC and Zain to guarantee ultra-reliable connectivity. Africa’s MTN and Safaricom adopt lean managed services to extend 4G and 5G into underserved regions, focusing on cost-effective fault and performance monitoring that can run on modest hardware. South America’s Telefónica and Claro modernize assurance to support fiber penetration, blending on-premise control with cloud elasticity to navigate currency volatility.

Competitive Landscape
The Telecom service assurance market is moderately concentrated: Ericsson, Nokia, Huawei, Amdocs, and Cisco capture about 45-50% of global revenue yet face erosion as lightweight, API-first challengers address Open RAN and cloud-native opportunities. Incumbents exploit large installed OSS/BSS bases, bundling assurance into broader automation portfolios, whereas RADCOM and MYCOM OSI win greenfield deals by deploying containerized probes in days rather than months.
Strategic focus follows three pathways. First, horizontal integration: Ericsson used Vonage’s acquisition to expose programmable APIs that let enterprises automate SLA validation. Second, vertical specialization: Nokia amassed more than 200 patents in AI-driven fault correlation and energy-aware analytics, preparing to license intellectual property as operators embrace machine learning. Third, geographic expansion via managed services: Accenture and Infovista secure multi-year contracts that pledge defined uptime, mitigating skill gaps for mid-tier operators.
Hyperscalers such as AWS, Microsoft, and Google embed baseline visibility within telecom-cloud stacks, forcing pure-play vendors to climb the value chain toward predictive analytics and business-level insights. Startups like Mavenir and Parallel Wireless introduce disaggregated probes tuned to individual Open RAN components, challenging monolithic suite economics. Compliance with 3GPP and O-RAN specifications is now a gating criterion in RFPs, with operators favoring multi-vendor interoperability to avoid fresh lock-ins, thereby influencing vendor roadmaps and sustaining dynamism in the Telecom service assurance market.
Telecom Service Assurance Industry Leaders
Nokia Corporation
Telefonaktiebolaget LM Ericsson
Amdocs Ltd.
NEC Corporation
Hewlett Packard Enterprise Development LP
- *Disclaimer: Major Players sorted in no particular order

Recent Industry Developments
- January 2026: Nokia launched its AI-Powered Network Assurance Suite, integrating generative AI for automated root-cause analysis and predictive maintenance across 5G standalone and Open RAN deployments.
- December 2025: Ericsson completed its USD 320 million acquisition of Mavenir’s service assurance division, bolstering cloud-native capabilities for disaggregated RAN.
- November 2025: Amdocs partnered with Microsoft Azure to deliver SaaS-based service assurance that scales elastically and embeds AI analytics.
- October 2025: VIAVI Solutions introduced a 5G Network Slicing Assurance Platform offering per-slice SLA visibility and real-time QoE dashboards.


Global Telecom Service Assurance Market Report Scope
The Telecom Service Assurance Market Report is Segmented by Component (Solutions, Services), Operator Type (Mobile, Fixed), Deployment Mode (On-Premise, Cloud, Hybrid), Enterprise Size (Large, SME), and Geography (North America, South America, Europe, Asia-Pacific, Middle East, Africa). Market Forecasts are Provided in Terms of Value (USD).
| Solutions | Fault Management |
| Performance Management | |
| Service Quality Management | |
| Intelligent Assurance and Analytics | |
| Services | Professional Services |
| Managed Services |
| Mobile Operator |
| Fixed Operator |
| On-Premise |
| Cloud |
| Hybrid |
| Large Enterprises |
| Small and Medium-Sized Enterprises |
| North America | United States |
| Canada | |
| Mexico | |
| South America | Brazil |
| Argentina | |
| Rest of South America | |
| Europe | Germany |
| United Kingdom | |
| France | |
| Italy | |
| Spain | |
| Russia | |
| Rest of Europe | |
| Asia-Pacific | China |
| Japan | |
| India | |
| South Korea | |
| Australia | |
| Rest of Asia-Pacific | |
| Middle East | United Arab Emirates |
| Saudi Arabia | |
| Turkey | |
| Rest of Middle East | |
| Africa | South Africa |
| Nigeria | |
| Kenya | |
| Rest of Africa |
| By Component | Solutions | Fault Management |
| Performance Management | ||
| Service Quality Management | ||
| Intelligent Assurance and Analytics | ||
| Services | Professional Services | |
| Managed Services | ||
| By Operator Type | Mobile Operator | |
| Fixed Operator | ||
| By Deployment Mode | On-Premise | |
| Cloud | ||
| Hybrid | ||
| By Enterprise Size | Large Enterprises | |
| Small and Medium-Sized Enterprises | ||
| By Geography | North America | United States |
| Canada | ||
| Mexico | ||
| South America | Brazil | |
| Argentina | ||
| Rest of South America | ||
| Europe | Germany | |
| United Kingdom | ||
| France | ||
| Italy | ||
| Spain | ||
| Russia | ||
| Rest of Europe | ||
| Asia-Pacific | China | |
| Japan | ||
| India | ||
| South Korea | ||
| Australia | ||
| Rest of Asia-Pacific | ||
| Middle East | United Arab Emirates | |
| Saudi Arabia | ||
| Turkey | ||
| Rest of Middle East | ||
| Africa | South Africa | |
| Nigeria | ||
| Kenya | ||
| Rest of Africa | ||


Key Questions Answered in the Report
How large will the Telecom service assurance market be by 2031?
It is projected to reach USD 21.58 billion by 2031, expanding at a 9.89% CAGR from 2026.
Which region will grow fastest in service assurance spending?
Asia-Pacific is forecast to post a 10.78% CAGR through 2031, led by massive 5G deployments in China and India.
Why are managed services gaining traction among mid-tier operators?
They convert CapEx into OpEx, supply scarce AI skills, and guarantee uptime SLAs, cutting integration risk for carriers with limited staff.
What is driving cloud-native assurance adoption?
Containerized architectures enable elastic scaling, rapid feature releases, and hybrid deployments that honor data-sovereignty laws.
How do energy-aware modules influence purchasing decisions in Europe?
Net-zero commitments push operators to select platforms that correlate traffic with power consumption, optimizing kilowatt-hours per gigabyte.
Which deployment model dominates today?
On-premise still leads with 58.21% share, but hybrid and pure-cloud models are rapidly eroding that lead as 5G traffic climbs.
Page last updated on:


