Pharmaceutical Manufacturing Market Size and Share
Market Overview
| Study Period | 2020 - 2031 |
|---|---|
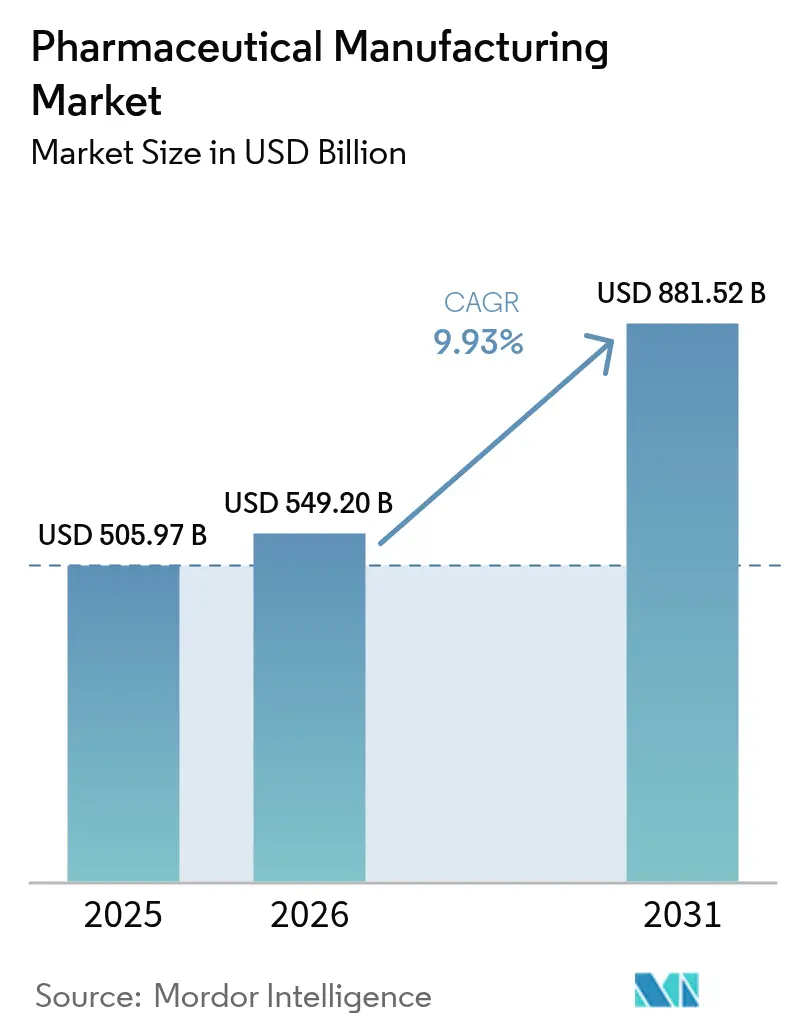
| Market Size (2026) | USD 549.20 Billion |
| Market Size (2031) | USD 881.52 Billion |
| Growth Rate (2026 - 2031) | 9.93% CAGR |
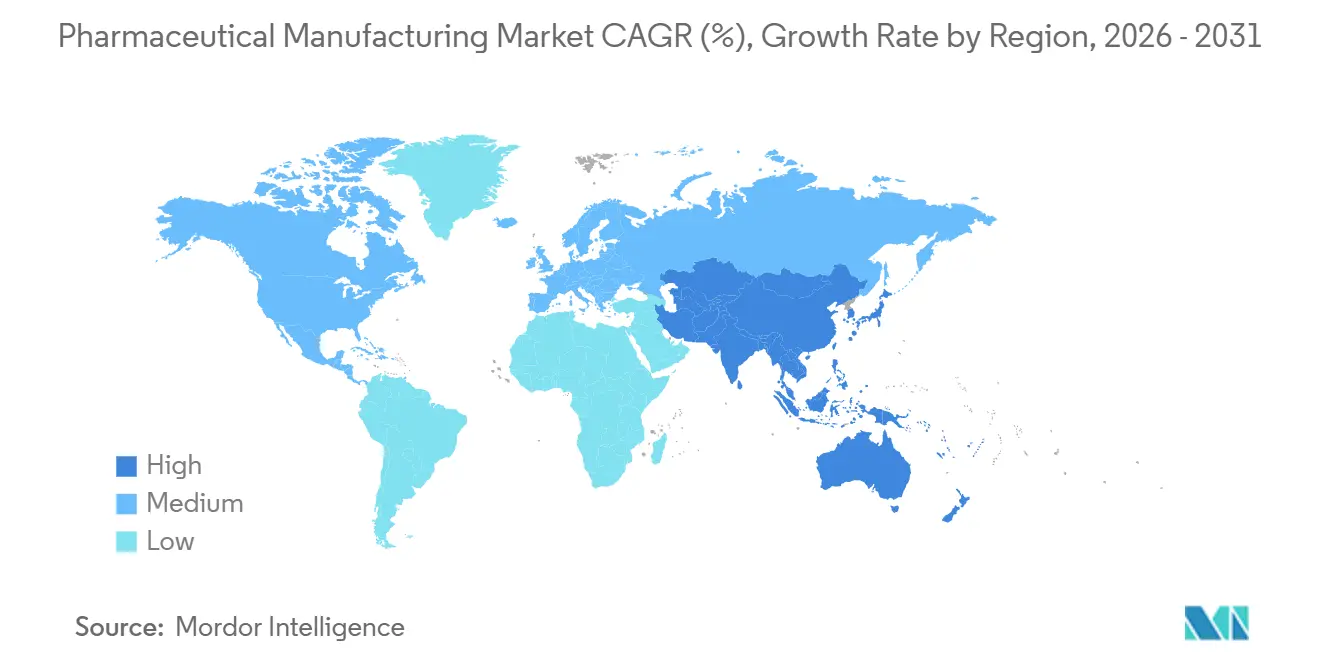
| Fastest Growing Market | Asia Pacific |
| Largest Market | North America |
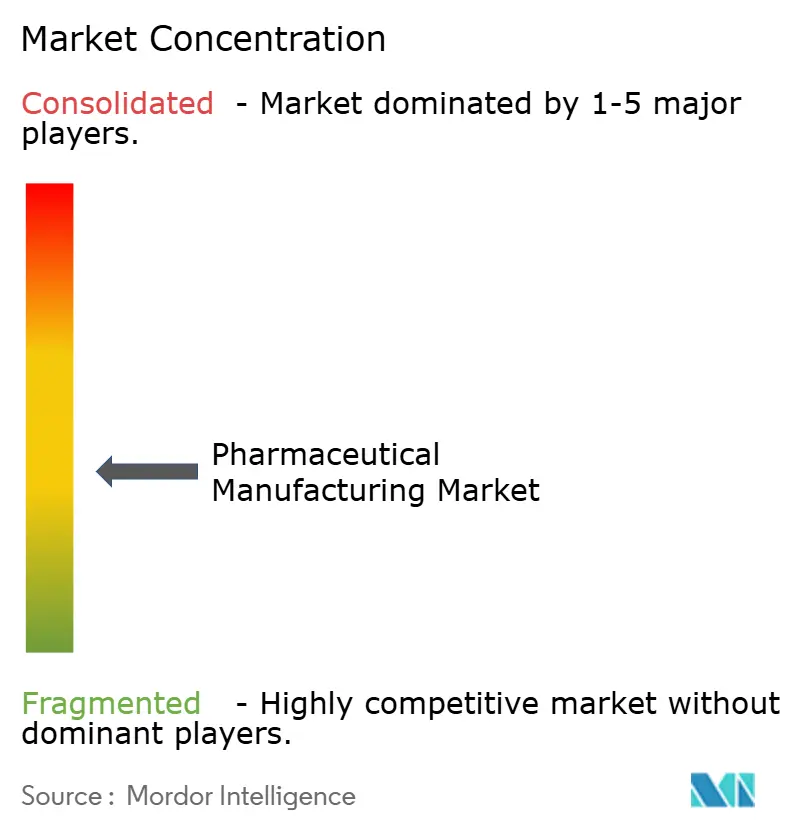
| Market Concentration | Medium |
Major Players *Disclaimer: Major Players sorted in no particular order Image © ���ϲ�����. Reuse requires attribution under CC BY 4.0. | |
Pharmaceutical Manufacturing Market Analysis by ���ϲ�����
The pharmaceutical manufacturing market size was valued at USD 505.97 billion in 2025, is estimated to reach USD 549.20 billion in 2026, and is projected to grow to USD 881.52 billion by 2031, registering a CAGR of 9.93% during the forecast period (2026–2031). A pivot toward continuous, single-use, and AI-enabled production lines is shortening cycle times, lowering defect rates, and moving regulatory release testing upstream. More than USD 300 billion in greenfield and brownfield investments flowed into capacity expansions between 2024 and early 2026, headed by Eli Lilly’s USD 27 billion multi-site build-out and AstraZeneca’s USD 50 billion biologics push. The U.S. FDA’s FRAME initiative, launched in 2024, embeds real-time release testing into facility reviews and has already cut qualifying sponsors' time-to-market by up to 2 years. Biosimilar approvals, localized API programs, and AI-optimized legacy lines combine to keep the pharmaceutical manufacturing market on a structurally higher growth path than in the past decade.
Key Report Takeaways
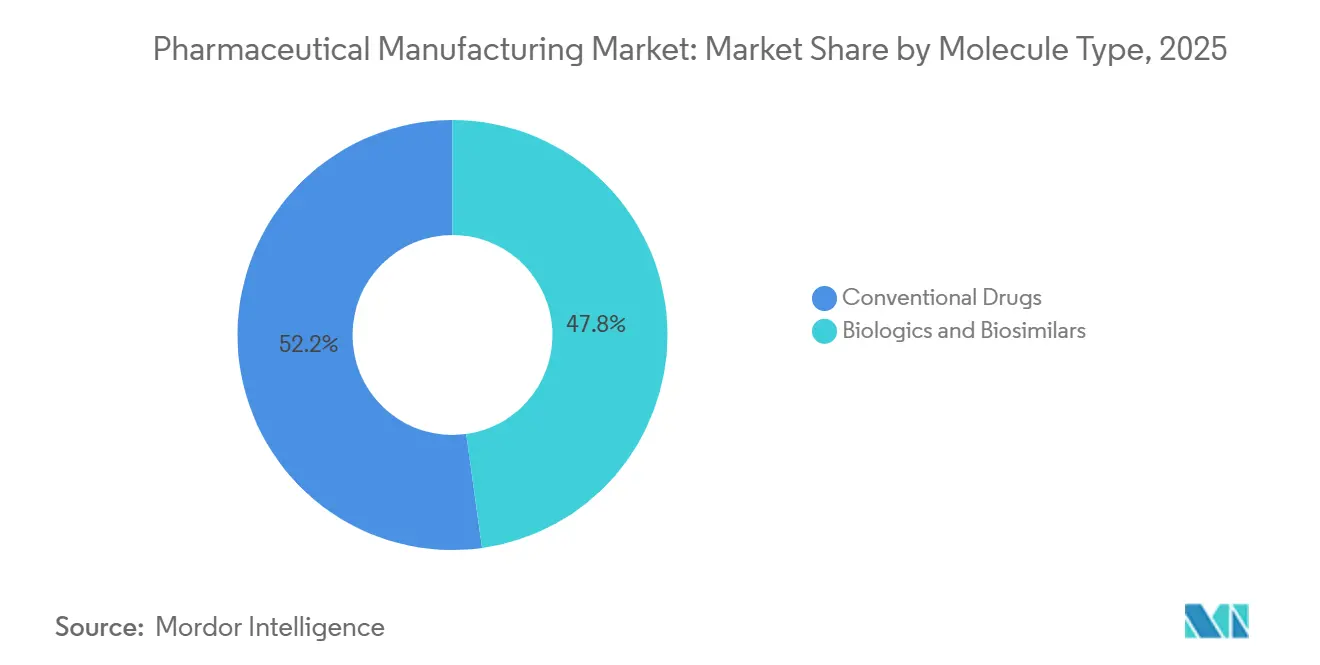
- By molecule type, conventional drugs led with 52.20% revenue in 2025, while biologics and biosimilars are forecast to register a 10.57% CAGR to 2031.
- By manufacturing mode, contract manufacturing organizations captured 59.51% of the 2025 volume, and the same segment is projected to grow at an 10.62% CAGR through 2031.
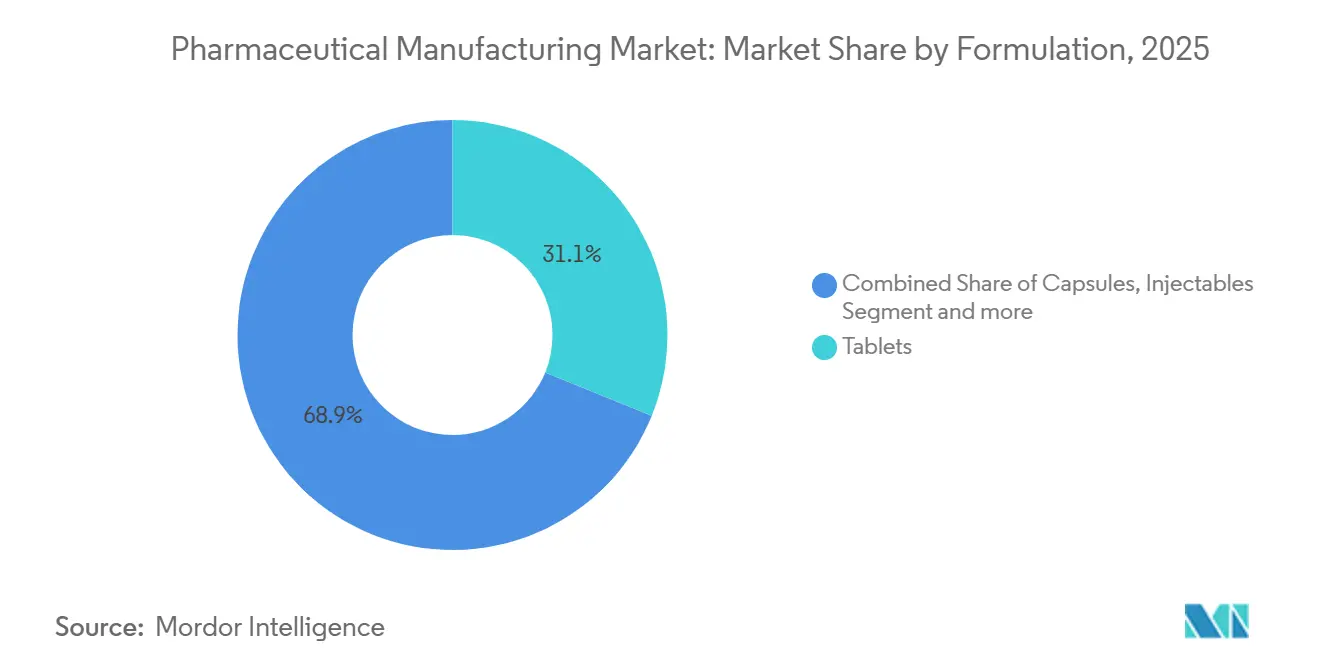
- By formulation, tablets commanded 31.13% of 2025 revenue, whereas injectables are advancing at a 11.31% CAGR on the back of GLP-1 and CAR-T demand.
- By manufacturing technology, batch processing accounted for 71.74% of the 2025 spend, but continuous platforms will expand at a 11.20% CAGR through 2031.
- By application, oncology therapies accounted for 29.47% of 2025 revenue; the same segment is the fastest-growing segment, with a 11.62% CAGR through 2031.
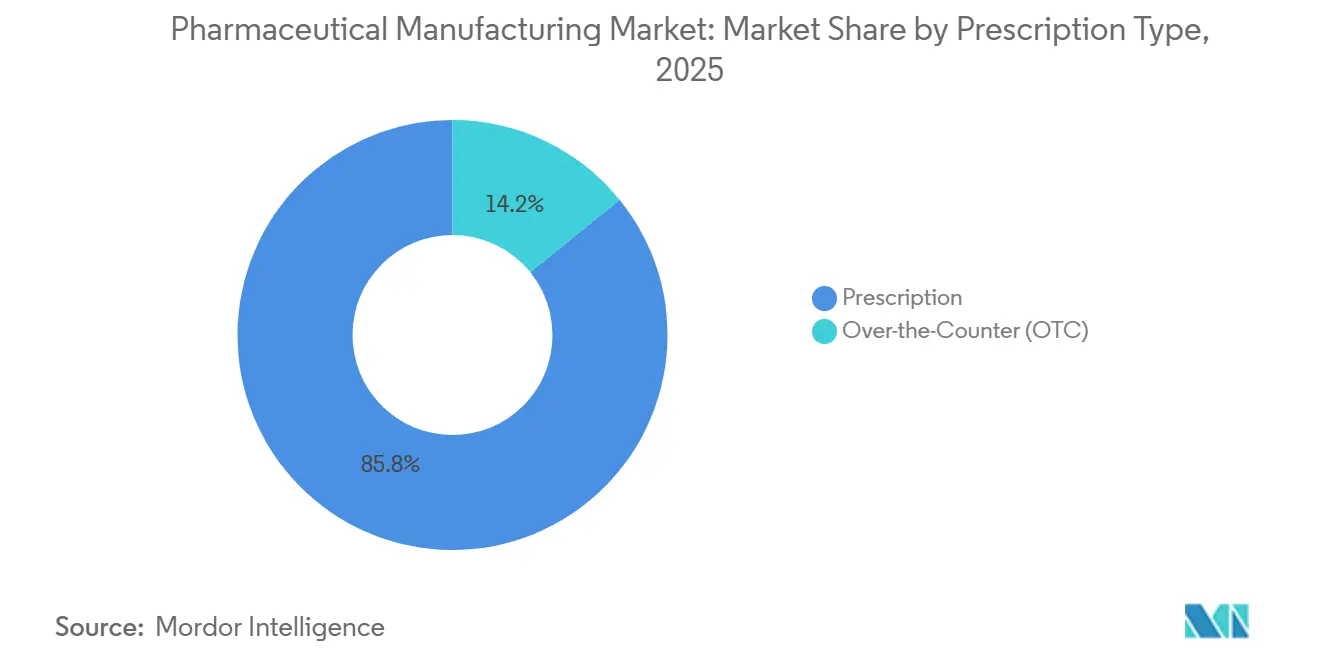
- By prescription type, prescription drugs accounted for 85.83% of the 2025 volume, while over-the-counter products are slated for a 11.14% CAGR to 2031.
- By geography, North America held 36.53% revenue in 2025, yet Asia-Pacific is predicted to climb at a 11.14% CAGR during 2026-2031.
Note: Market size and forecast figures in this report are generated using ���ϲ�����’s proprietary estimation framework, updated with the latest available data and insights as of 2026.
Global Pharmaceutical Manufacturing Market Trends and Insights
Drivers Impact Analysis*
| Driver | % Impact on CAGR Forecast | Geographic Relevance | Impact Timeline |
|---|---|---|---|
| Rising R&D Investments by Big Pharma | +2.1% | Global, with concentration in North America & Europe | Medium term (2-4 years) |
| Integration of AI-Enabled Automation in Legacy Lines | +1.8% | North America, Europe, APAC core (Japan, South Korea) | Short term (≤ 2 years) |
| Biosimilar Surge after Key Patent Cliffs | +2.3% | Global, early gains in Europe & APAC, spill-over to North America | Short term (≤ 2 years) |
| Reshoring & Localization of API Capacity | +1.6% | North America, Europe, India | Medium term (2-4 years) |
| Decentralized Micro-Batch Lines for Personalized Meds | +1.2% | North America & Europe, pilot deployments in APAC | Long term (≥ 4 years) |
| Heat- & Solvent-Free 3D Printing of Tablets | +0.9% | North America & Europe, limited APAC adoption | Long term (≥ 4 years) |
| Source: ���ϲ����� | |||
Rising R&D Investments by Big Pharma
Global pharmaceutical R&D spending reached USD 190 billion in 2025, 6.2% higher than in 2024, with 22% of that budget allocated to manufacturing sciences. Sponsors now plan continuous manufacturing feasibility as early as the IND stage, thereby collapsing the traditional gap between process development and scale-up. Eli Lilly’s Indiana and Irish hubs aim to onboard up to 15 new molecular entities per year, each supported by adjacent tech-transfer laboratories. AstraZeneca’s modular biologics complexes in Singapore and Maryland can alternate between monoclonal antibodies and gene therapies within 72 hours. Across 2025, the FDA granted 38 Emerging Technology designations, dropping batch-release cycles from 30 days to under 5 days for compliant plants.
Integration of AI-Enabled Automation in Legacy Lines
AI-driven process-analytical-technology now covers 28% of worldwide production lines, delivering a median 19% cut in out-of-specification batches and boosting overall equipment effectiveness by 14%. FDA guidance released in 2024 allows validated machine-learning models to replace end-product testing with in-process spectroscopy, lowering analytical costs. Novo Nordisk shaved changeover time by 40% on GLP-1 fill-finish lines, freeing capacity for six extra batches per quarter. Typical retrofits cost USD 0.8-1.2 million per line and achieve payback within 18 months. The UK MHRA’s 2025 digital twin pilot allows firms to submit virtual validation packages, a framework the EMA plans to adopt by 2027.
Biosimilar Surge After Key Patent Cliffs
Expiration of 11 blockbuster biologic patents between 2024 and 2026 opened USD 68 billion in annual reference sales and triggered 23 biosimilar approvals by mid-2025. Medicare Part B saved USD 3.2 billion in 2025 from biosimilar uptake, and savings are projected to triple by 2028. Samsung Biologics added 360,000 liters of bioreactor capacity in Incheon to meet eight newly signed biosimilar contracts. Yet interchangeability hurdles remain; only 22 of 58 licensed U.S. biosimilars enjoy pharmacy-level substitution rights. Europe’s penetration reached 47% of eligible biologic prescriptions in 2025, driven by earlier reimbursement parity.
Reshoring and Localization of API Capacity
The U.S. BARDA committed USD 1.2 billion in 2024-2025 to reshore 14 critical APIs, while the EU’s Critical Medicines Act offers 25% capital-expenditure tax credits for on-continent production. India’s PLI scheme had disbursed USD 2 billion by 2025 to lift self-sufficiency in key starting materials to 35% by 2028. Pfizer’s USD 1.5 billion North Carolina facility will consolidate nine molecules that are currently outsourced to Asia. Although reshored plants carry a 20-30% cost premium, sponsors are paying for resilience after 137 U.S. drug shortages in 2024.
Restraints Impact Analysis*
| Restraint | % Impact on CAGR Forecast | Geographic Relevance | Impact Timeline |
|---|---|---|---|
| Global Drug-Pricing Pressure & Cost-Containment | -1.9% | Global, acute in North America & Europe | Short term (≤ 2 years) |
| Critical-Input Supply-Chain Fragility | -1.4% | Global, concentrated risk in APAC sourcing | Medium term (2-4 years) |
| Shortage of GMP-Grade Recycled Solvents | -0.8% | Europe & North America, emerging in APAC | Medium term (2-4 years) |
| Cyber-Security Liability in Connected Plants | -1.1% | Global, heightened in North America & Europe with advanced digitalization | Short term (≤ 2 years) |
| Source: ���ϲ����� | |||
Global Drug-Pricing Pressure and Cost-Containment
Medicare’s 2026 price caps on 10 high-spend drugs will shave USD 40 billion from industry revenue by 2031, with biologics absorbing 60% of the hit. Europe’s 2024 HTA reforms now extend reimbursement negotiations to 270 days, eroding the net present value of new launches by 12%. Brazil capped biologic reimbursement at 65% of originator prices in 2025, propelling biosimilar uptake but squeezing CDMO fill-finish margins. PhRMA noted 18 discontinued clinical programs in 2025 as firms recalibrated ROI thresholds. Sponsors are turning to continuous processing to offset price compression, yet each line still demands USD 50-80 million in upfront capital.
Critical-Input Supply-Chain Fragility
The FDA tracked 137 active drug shortages in 2024, 62% of which were tied to disrupted Chinese and Indian API plants. Lead times for borosilicate vials doubled to 26 weeks amid surging GLP-1 demand. China’s 2024 rare-earth export limits hampered oncology catalysts, prompting U.S. Commerce funding for domestic refining. Firms lifted safety-stock cover to 75 days in 2025, locking an extra USD 8 billion of working capital industry-wide. Dual-source qualification adds 8-12% to procurement costs, straining mid-tier manufacturers.
*Our updated forecasts treat driver/restraint impacts as directional, not additive. The revised impact forecasts reflect baseline growth, mix effects, and variable interactions.
Segment Analysis
By Molecule Type: Biologics Reshape Capital Allocation
Biologics and biosimilars are set to outpace the broader pharmaceutical manufacturing market, expanding at a 10.57% CAGR through 2031 on the back of blockbuster antibody patent cliffs. Conventional drugs still captured 52.20% of 2025 revenue, but pricing pressure under the Inflation Reduction Act tempers their outlook. The pharmaceutical manufacturing market size tied to biosimilar launches reached USD 22 billion in addressable reference sales during 2025, driving capacity additions at Samsung Biologics and Lonza.
Smaller-molecule plants benefit from FDA ICH Q13 continuous-processing guidance, which removes 30-day holds once inline analytics are validated, thereby lowering working capital. In contrast, biologics lines face cold-chain and comparability hurdles, centralizing pharmaceutical manufacturing market share among leading CDMOs. AstraZeneca’s and Novo Nordisk’s combined 720,000 liters of fresh bioreactor space reflect the swing toward large-volume monoclonal and GLP-1 demand.


By Manufacturing Mode: In-House Lines Gain Momentum
Sponsors reclaimed margin by shifting select high-value assets back inside the fence, giving in-house production an 8.86% CAGR outlook. Despite CDMOs owning 59.51% of 2025 throughput, big-ticket expansions from Eli Lilly and Pfizer show board-level appetite for control after pandemic-era disruptions. For blockbuster biologics with annual sales exceeding USD 2 billion, internal plants avoid 15-20% in CDMO fee erosion and reduce IP leakage risk.
Contract partners are pivoting up the complexity ladder into CAR-T and mRNA, booking premium, multi-year slots that protect utilization. The FDA’s Advanced Manufacturing Technologies program, which issued 12 designations in 2025, now rewards both CDMOs and in-house sponsors that embrace continuous and single-use systems, keeping the playing field dynamic.
By Formulation: Injectables Capture Biologics Wave
While tablets contributed 31.13% of 2025 revenue, injectables are forecast at a 11.31% CAGR as sterile fill-finish backs rising biologics, GLP-1, and oncology therapies. The pharmaceutical manufacturing market for injectables continues to expand despite persistent vial and stopper shortages, which are pushing lead times to 6 months.
Oral solid-dose technology is evolving through 3D printing, as evidenced by Aprecia’s FDA-cleared Spritam dosage extensions. Yet adoption remains limited to neurology due to slower throughput and nozzle-maintenance costs. EMA’s 2024 combination-product guidance lifted capex for auto-injector programs by USD 5-8 million per asset but improved patient adherence and competitive differentiation
By Manufacturing Technology: Continuous Lines Break Batch Dominance
Batch systems still accounted for 71.74% of 2025 spend, yet continuous lines posted the highest growth at a 11.20% CAGR because they cut per-unit costs by 20-30% and accelerated release testing. Twenty-two of the FDA’s 38 Emerging Technology designations in 2025 backed fully continuous platforms with embedded.
Single-use hardware, present in 68% of 2025 bioreactor installs, underpins both batch and continuous biologics runs by trimming cleaning validation and downtime. Vertex halved lead times for its cystic fibrosis franchise by converting two batch lines to continuous operations, freeing USD 120 million in working capital. Retrofitting averages USD 50-80 million per line, a hurdle for smaller generics firms.
By Application: Neurology Therapies Drive Specialized Capacity
Oncology is the fastest-growing application, rising at a 11.62% CAGR through 2031. Oncology, with 29.47% of 2025 revenue, maintains scale leadership, yet ultra-potent compounds demand sub-5 microgram containment, hiking compliance budgets.
Eli Lilly allocated 40% of its USD 27 billion expansion to neurology and oncology suites situated near infusion centers, mirroring FDA guidance on decentralized manufacturing. Point-of-care CAR-T pilots by Novartis and Gilead cut vein-to-vein times to under two weeks, showcasing how the pharmaceutical manufacturing market can benefit from distributed nodes.
By Prescription Type: OTC Gains as Self-Care Expands
Prescription products accounted for 85.83% of 2025 volume, yet over-the-counter drugs will grow 11.14% annually as Europe and Asia-Pacific reclassify certain antihistamines and PPIs. The pharmaceutical manufacturing market share for OTC formats will widen because consumer channels bypass PBM rebates and allow premium branding.
Complying with OTC tamper-evident packaging adds 5-8% to unit cost but opens direct-to-consumer e-commerce. Japan added 12 OTC actives in 2024, and Australia shortened biologics reviews in collaboration with the TGA, nudging sponsors toward consumer-friendly delivery forms.
Geography Analysis
North America generated 36.53% of 2025 revenue, anchored by high-value biologics clusters in Indiana, Massachusetts, and North Carolina. The region’s pharmaceutical manufacturing market benefits from favorable IP regimes and a USD 150 billion investment wave spanning 2024-2026 led by Eli Lilly and Novo Nordisk. Canada and Mexico leverage USMCA to streamline API flows, but Mexico’s generics plants received 14 FDA warning letters during 2024-2025, signaling compliance headwinds.
Asia-Pacific is the fastest-growing theater, projected at a 11.14% CAGR, driven by India’s USD 2 billion PLI incentives and China’s push to localize mRNA vaccines after 2024 supply-chain shocks. Samsung Biologics added 360,000 liters of capacity and now tops the global CDMO volume league, underscoring the region’s scale gains. Australia’s streamlined TGA biologics pathway cut review times to 180 days, prompting CSL Behring to build a USD 530 million plasma plant in Melbourne.
Europe benefits from the Critical Medicines Act’s 25% capex tax credit, luring Pfizer and Novartis to invest a combined USD 2.4 billion in German and Swiss API sites. Saudi Arabia’s Public Investment Fund plans a USD 500 million biologics facility to boost regional self-sufficiency, while Brazil’s reference-pricing scheme squeezes margins but fuels local generics volume

Competitive Landscape
Competition is fragmented in oral solid dose and generics, housing over 200 regional players, yet concentrated in biologics, where Lonza, Catalent, Samsung Biologics, and Fujifilm Diosynth dominate monoclonal and cell-therapy capacity. Vertical integration is accelerating; Eli Lilly’s in-house investments reclaim up to 20% gross margin compared with CDMO outsourcing.
Technology adoption is the primary differentiator. The FDA’s FRAME and Emerging Technology programs granted 38 designations in 2025, recognizing continuous and AI-enabled lines that can compress launch timelines by up to 2 years. Patent filings for integrated continuous systems jumped 34% in 2025, led by Pfizer, Novartis, and Vertex, underscoring the innovation race.
New entrants such as Resilience and Multiply Labs raised sizable capital in 2024-2025 to build digitally native plants and robotic capsule lines, respectively, illustrating white-space niches around micro-batch, patient-specific manufacturing. Cybersecurity is an emerging moat; 2024 FDA guidance now mandates a software bill of materials for connected PAT, inflating compliance spend 12-15% for mid-tier CDMOs, but protecting incumbents with mature IT stacks.
Pharmaceutical Manufacturing Industry Leaders
Pfizer Inc.
AstraZeneca
Sanofi
F. Hoffmann-La Roche Ltd
Eli Lilly and Company
- *Disclaimer: Major Players sorted in no particular order

Recent Industry Developments
- February 2026: Lupin launched Topiramate extended-release capsules in four strengths for the U.S. market after securing FDA ANDA approval.
- February 2026: PharmaEssentia approved a USD 46 million outlay to establish a Puerto Rico plant to support global supply of BESREMi (ropeginterferon alfa-2b).


Global Pharmaceutical Manufacturing Market Report Scope
As per the report's scope, pharmaceutical manufacturing is the industrial-scale production of pharmaceutical drugs within the pharmaceutical industry. Drug manufacturing can be broken down into unit operations, such as milling, granulation, coating, and tablet pressing.
The pharma manufacturing market is segmented by molecule type, manufacturing mode, formulation, manufacturing technology, application, prescription type, and geography. By molecule type, the market is segmented into biologics and biosimilars and conventional drugs. By drug development type, the market is segmented into outsource and in-house. By manufacturing mode, the market is segmented into In-house and CMO / CDMO. By formulation, the market is segmented into tablets, capsules, injectables, topical & transdermal, nasal & pulmonary sprays, and others. By manufacturing technology, the market is segmented into batch, continuous, and single-use. By application, the market is segmented into oncology, diabetes, cardiovascular, neurology, respiratory, and others. By prescription type, the market is segmented into prescription medications and over-the-counter medications. By geography, the market is segmented into North America, Europe, Asia-Pacific, the Middle East and Africa, and South America. The market report also covers estimated market sizes and market trends for 17 countries across major regions worldwide. The report offers market value (in USD) for the above segments.
| Biologics & Biosimilars |
| Conventional Drugs |
| In-house |
| CMO / CDMO |
| Tablets |
| Capsules |
| Injectables |
| Topical & Transdermal |
| Nasal & Pulmonary Sprays |
| Others |
| Batch |
| Continuous |
| Single-Use |
| Oncology |
| Diabetes |
| Cardiovascular |
| Neurology |
| Respiratory |
| Others |
| Prescription |
| Over-the-Counter (OTC) |
| North America | United States |
| Canada | |
| Mexico | |
| Europe | Germany |
| United Kingdom | |
| France | |
| Italy | |
| Spain | |
| Rest of Europe | |
| Asia-Pacific | China |
| India | |
| Japan | |
| Australia | |
| South Korea | |
| Rest of Asia-Pacific | |
| Middle East and Africa | GCC |
| South Africa | |
| Rest of Middle East and Africa | |
| South America | Brazil |
| Argentina | |
| Rest of South America |
| By Molecule Type | Biologics & Biosimilars | |
| Conventional Drugs | ||
| By Manufacturing Mode | In-house | |
| CMO / CDMO | ||
| By Formulation | Tablets | |
| Capsules | ||
| Injectables | ||
| Topical & Transdermal | ||
| Nasal & Pulmonary Sprays | ||
| Others | ||
| By Manufacturing Technology | Batch | |
| Continuous | ||
| Single-Use | ||
| By Application | Oncology | |
| Diabetes | ||
| Cardiovascular | ||
| Neurology | ||
| Respiratory | ||
| Others | ||
| By Prescription Type | Prescription | |
| Over-the-Counter (OTC) | ||
| By Geography | North America | United States |
| Canada | ||
| Mexico | ||
| Europe | Germany | |
| United Kingdom | ||
| France | ||
| Italy | ||
| Spain | ||
| Rest of Europe | ||
| Asia-Pacific | China | |
| India | ||
| Japan | ||
| Australia | ||
| South Korea | ||
| Rest of Asia-Pacific | ||
| Middle East and Africa | GCC | |
| South Africa | ||
| Rest of Middle East and Africa | ||
| South America | Brazil | |
| Argentina | ||
| Rest of South America | ||


Key Questions Answered in the Report
How large will the pharmaceutical manufacturing market be by 2031?
It is projected to reach USD 881.52 billion by 2031, reflecting a 9.93% CAGR from 2026 to 2031.
Why are continuous-manufacturing lines gaining traction?
They shorten release cycles from 30 days to under 5 days, cut per-unit costs up to 30%, and receive expedited FDA review under the FRAME program.
What is driving Asia-Pacific capacity expansion?
India's PLI incentives, China's vaccine localization, and Samsung Biologics bioreactor builds together support a 10.66% CAGR for the region.
How does drug-pricing reform affect capital investment?
Medicare negotiations and EU HTA delays compress margins, steering sponsors toward cost-efficient continuous and single-use systems despite high upfront spend.
Which technology trend offers white-space opportunities?
Decentralized micro-batch and 3D-printed dosage platforms enable personalized therapies and patient-specific dosing with lower facility footprints.
Page last updated on:


