Needle Coke Market Size and Share
Market Overview
| Study Period | 2021 - 2031 |
|---|---|
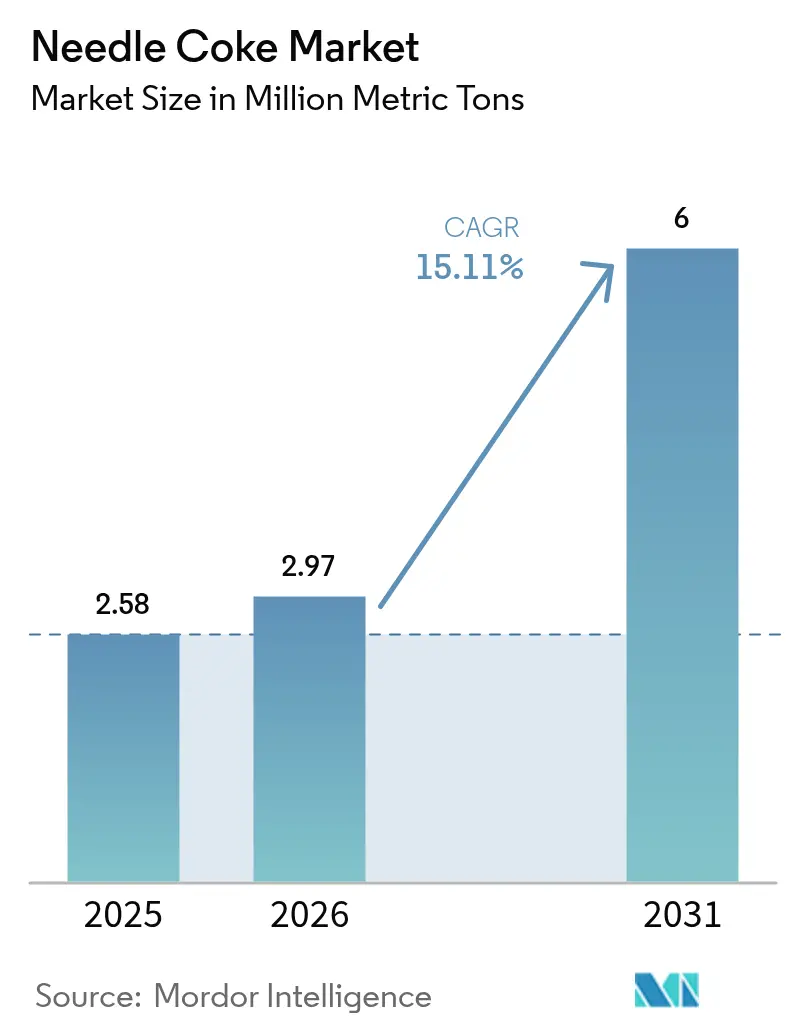
| Market Volume (2026) | 2.97 Million metric tons |
| Market Volume (2031) | 6 Million metric tons |
| Growth Rate (2026 - 2031) | 15.11% CAGR |
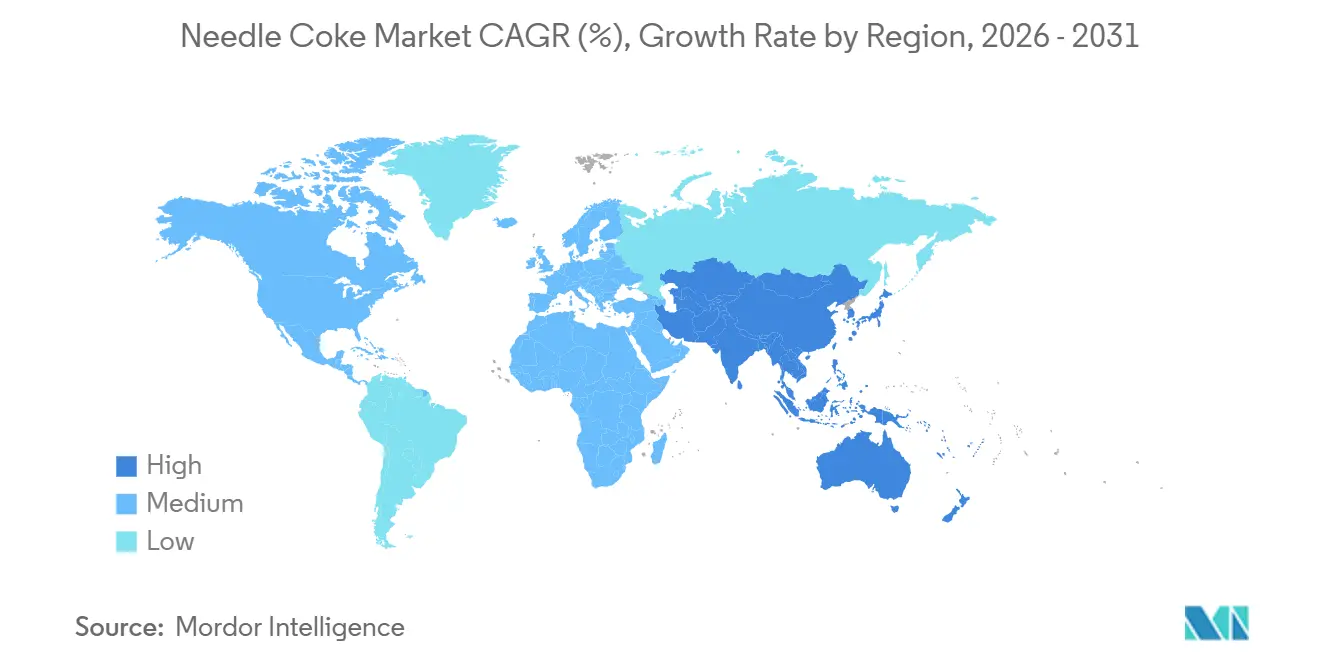
| Fastest Growing Market | Asia Pacific |
| Largest Market | Asia Pacific |
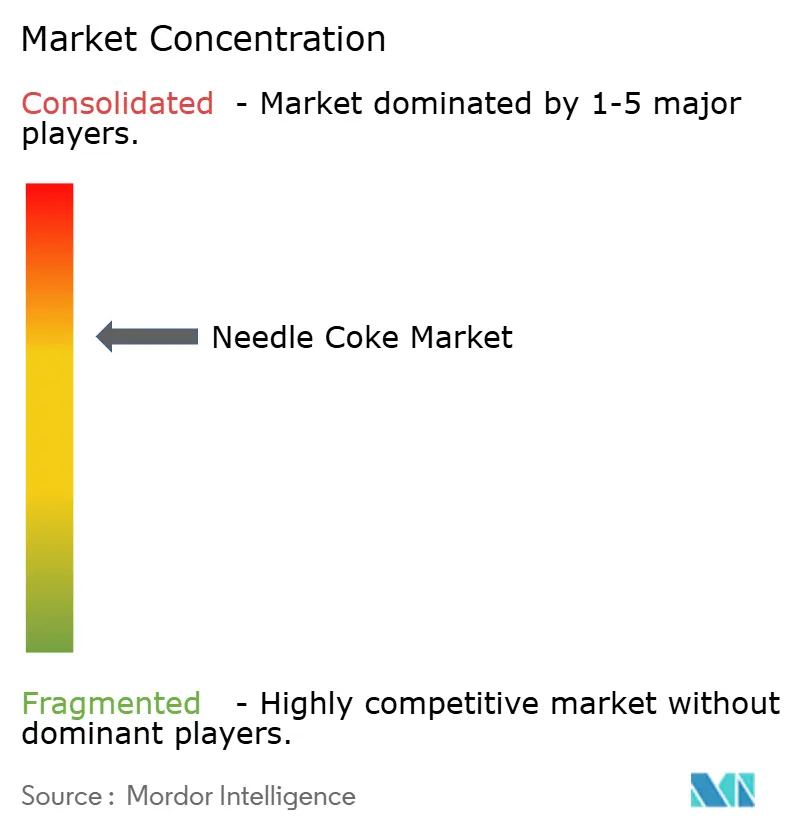
| Market Concentration | Medium |
Major Players *Disclaimer: Major Players sorted in no particular order Image © ���ϲ�����. Reuse requires attribution under CC BY 4.0. | |
Needle Coke Market Analysis by ���ϲ�����
The Needle Coke Market size is expected to grow from 2.58 Million metric tons in 2025 to 2.97 Million metric tons in 2026 and is forecast to reach 6 Million metric tons by 2031 at 15.11% CAGR over 2026-2031. Structural expansion in electric-arc-furnace (EAF) steel capacity and lithium-ion battery gigafactories is accelerating demand, while refinery upgrades that yield ultra-low-sulfur decant oil improve petroleum-route quality and supply consistency. Heightened scrap-steel mandates in China and the European Union add a durable floor under electrode consumption, and vertically integrated producers are using captive delayed-coking assets to stabilize feedstock costs. Meanwhile, process patents that suppress puffing in calcination and pilot-scale graphite recycling programs hint at cost reductions that could reshape long-run supply dynamics.
Key Report Takeaways
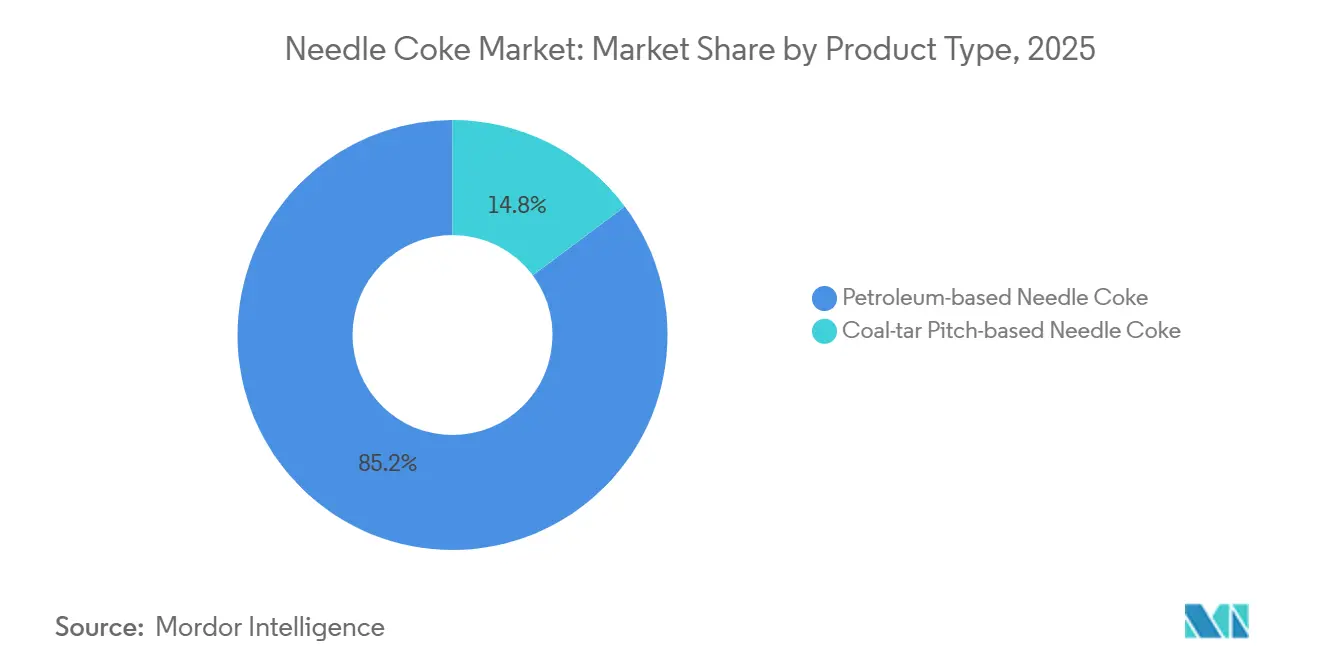
- By product type, petroleum-based needle coke led with an 85.23% needle coke market share in 2025 and is forecast to grow at a 16.18% CAGR to 2031.
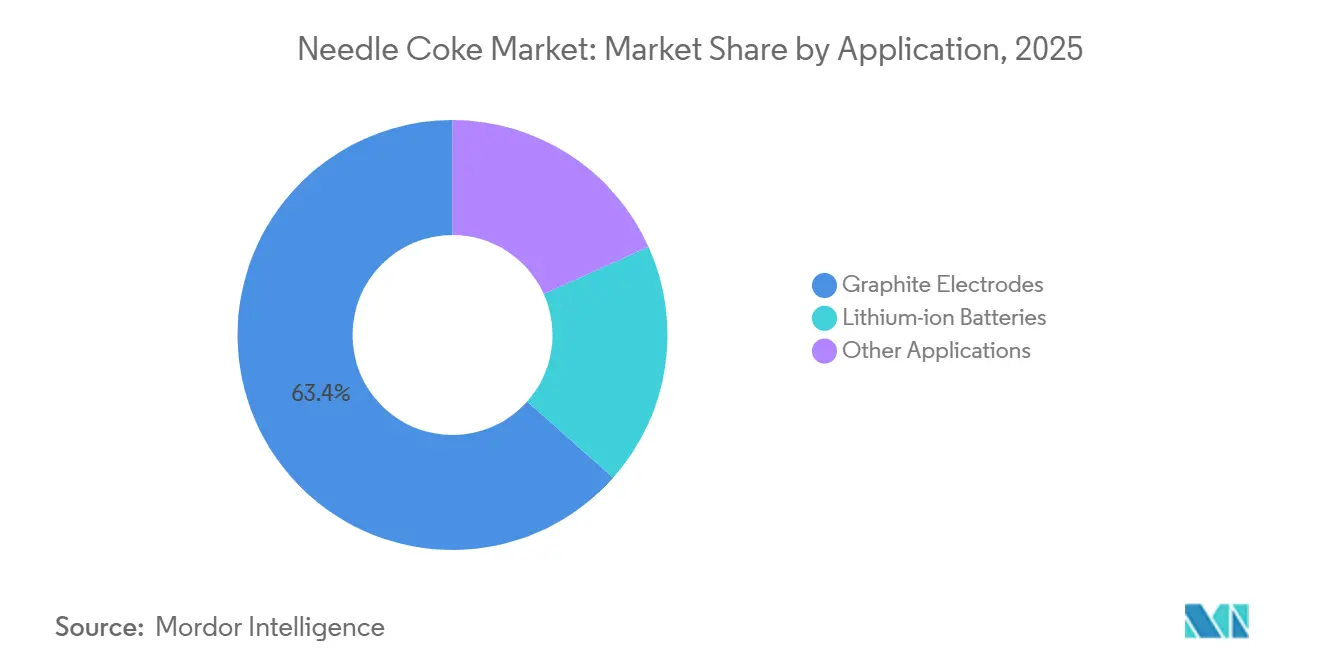
- By application, graphite electrodes continued to command 63.45% of 2025, while lithium-ion batteries recorded the fastest growth trajectory at a 22.38% CAGR through 2031.
- By geography, Asia-Pacific held 87.88% of 2025 volume and is forecast to grow at a 15.56% CAGR to 2031.
Note: Market size and forecast figures in this report are generated using ���ϲ�����’s proprietary estimation framework, updated with the latest available data and insights as of 2026.
Global Needle Coke Market Trends and Insights
Drivers Impact Analysis*
| Driver | (~) % Impact on CAGR Forecast | Geographic Relevance | Impact Timeline |
|---|---|---|---|
| Increasing EAF-steel capacity pipelines | +4.2% | Global, with APAC (China, India, South Korea) and North America leading pipeline additions | Medium term (2-4 years) |
| EV Li-ion battery gigafactories scaling globally | +5.8% | APAC core (China 99% synthetic graphite supply), spill-over to North America and Europe | Long term (≥ 4 years) |
| Scrap-steel mandates in China and European Union | +2.1% | China and EU, with secondary impact on Japan and South Korea electrode exports | Short term (≤ 2 years) |
| Refinery upgrades producing ultra-low-sulphur decant oil | +1.9% | North America, Middle-East, and select APAC refineries (Japan, South Korea) | Medium term (2-4 years) |
| Accelerated anode-grade graphite recycling patents | +1.1% | EU and North America (driven by circular-economy mandates), pilot-scale in China | Long term (≥ 4 years) |
| Source: ���ϲ����� | |||


Increasing EAF-Steel Capacity Pipelines
Global EAF projects totaling 337 million metric tons now represent nearly half of all announced steelmaking additions, and every 1 million metric tons of new EAF capacity consumes roughly 1,360 metric tons of ultra-high-power graphite electrodes. Based on a 40% conversion ratio, this pipeline translates into about 183,000 metric tons of incremental needle coke feedstock. Faster commissioning, lower capital intensity, and sharply lower direct-emission profiles position EAF mills as the favored growth vector, thereby reinforcing long-run demand for petroleum-based grades that meet stringent ash and sulfur limits.
EV Li-ion Battery Gigafactories Scaling Globally
Electric-vehicle sales are on track to top 27 million units in 2025, and each vehicle requires 50-80 kg of synthetic graphite anode material. Although Chinese anode capacity could run a small surplus later in the decade, only one-third of global petroleum coke output currently meets battery-grade purity thresholds. South Korea’s POSCO Future M, for example, is quadrupling anode-grade capacity under a USD 300 million program that pairs steel, electrode, and battery businesses to secure feedstock. Net result: the needle coke market continues to tighten despite pockets of localized graphite surplus.
Scrap-Steel Mandates in China and European Union
China’s 30% scrap ratio target for 2025 creates an 88 million-metric-ton incremental scrap requirement that raises EAF utilization and electrode demand. Parallel measures in the EU aim for a 70% steel-recycling rate by 2030, ensuring electrode offtake even if total crude steel output plateaus. Japan’s 95.2% anti-dumping tariff on Chinese electrodes further tightens regional supply and cements demand for domestically produced high-purity needle coke.
Refinery Upgrades Producing Ultra-Low-Sulfur Decant Oil
Delayed-coking retrofits at refineries in the United States and United Kingdom are lifting production of anode-grade green coke with ≤0.5% sulfur and ≤0.3% ash. Phillips 66’s Humber refinery can now supply enough battery-grade needle coke for 1.3 million EVs per year, and a September 2025 agreement with Epsilon Advanced Materials locks in feedstock for a 30,000 tpa graphite-anode plant in North Carolina.
Restraints Impact Analysis*
| Restraint | (~) % Impact on CAGR Forecast | Geographic Relevance | Impact Timeline |
|---|---|---|---|
| Occupational and environmental hazards in delayed coking | -1.8% | North America and EU (stringent EPA/EU emissions standards), moderate impact in APAC | Short term (≤ 2 years) |
| Feed-stock price volatility | -2.3% | Global, with acute exposure in non-integrated electrode producers and spot-market participants | Short term (≤ 2 years) |
| Emergence of bio-based hard-carbon anodes | -0.9% | EU and North America (sodium-ion battery R&D hubs), limited near-term commercial scale | Long term (≥ 4 years) |
| Source: ���ϲ����� | |||
Occupational and Environmental Hazards in Delayed Coking
U.S. EPA benzene-control rules require USD 80-120 million retrofits per unit, costs that many smaller refiners cannot absorb[1]U.S. Environmental Protection Agency, “National Emission Standards for Hazardous Air Pollutants,” epa.gov. Roughly 1.8 million t of North American coke capacity has already exited since 2021, concentrating output among firms with strong balance sheets and rigorous environmental compliance programs.
Emergence of Bio-Based Hard-Carbon Anodes
Hard-carbon derived from lignocellulosic waste exhibits favorable sodium-ion intercalation but still sits at pilot scale, with global sodium-ion battery capacity below 50 GWh versus more than 1,200 GWh for lithium-ion[2]U.S. Department of Energy, “Battery Materials Processing Grants,” energy.gov . Even if sodium-ion captures 15% of stationary storage by 2030, displaced needle coke demand would remain modest relative to total growth.
*Our updated forecasts treat driver/restraint impacts as directional, not additive. The revised impact forecasts reflect baseline growth, mix effects, and variable interactions.
Segment Analysis
By Product Type: Refinery Integration Favors Petroleum Routes
Petroleum-based needle coke accounted for 85.23% of 2025 volume, and their share of the needle coke market size is projected to rise further at a 16.18% CAGR through 2031 as refinery-integrated producers secure ultra-low-sulfur feedstock. Coal-tar routes remain constrained by higher ash and sulfur variability, yet Chinese producers are scaling 300,000 tpa deep-processing projects that could narrow the purity gap. Tightening EU carbon-footprint rules reinforce the petroleum advantage, given lower life-cycle emissions per tonne. Process innovation—such as Mitsubishi Chemical’s encapsulated inhibitor pitch—may lift coal-tar yields after 2027, but commercialization remains uncertain.
Cost spreads also favor refinery paths because co-production metrics allow fixed-cost absorption across fuel-grade coke and sulfur. Phillips 66’s Humber refinery supplies battery-grade output adequate for 1.3 million EVs annually, while GrafTech’s Seadrift plant covers about 19-20% of ex-China capacity, stabilizing its electrode margins.

By Application: Battery Anodes Outpace Traditional Electrode Demand
Graphite electrodes retained 63.45% of 2025 demand, but lithium-ion batteries are the fastest riser, expanding at a 22.38% CAGR and moving the application mix toward energy storage. The anode segment’s share of the needle coke market size is driven by growing EV sales. Each EV uses 50-80 kg of synthetic graphite, which anchors more than 540,000 t of upstream coke feedstock at the low end.
Electrode demand still grows on the back of EAF steel, yet capacity rationalization in Japan and Europe and a 95.2% Japanese anti-dumping duty on Chinese electrodes shift growth to Asia and North America. Group14’s and Sila’s silicon-doped anodes reduce graphite intensity per cell, but the sheer scale of new battery lines yields net positive volumes for the needle coke market.

Geography Analysis
Asia-Pacific dominated the needle coke market in 2025 with 87.88% volume and is forecast to keep expanding at a 15.56% CAGR through 2031. China alone supplied the majority of global output in 2024 and is growing as coal-tar and petroleum platforms ramp up. POSCO Future M in South Korea plans a 36,000 tpa synthetic-graphite line by 2026, while Indian Oil Corporation’s Paradip project will bring 56,000 tpa calcined capacity online by 2028, underlining regional integration.
North America presently holds a moderate share yet benefits from captive assets such as GrafTech’s 140,000 tpa Seadrift plant and Phillips 66’s Lake Charles refinery, which inked a 2025 supply deal with Epsilon Advanced Materials. The U.S. Department of Energy lists needle coke as a critical battery material and has earmarked USD 16 million in grant funding to spur domestic projects. These moves are projected to lift regional output and reduce import reliance, raising the needle coke market share in the United States by up to 2 percentage points by 2031 .
Europe remains supply-short with only Phillips 66’s Humber refinery producing battery-grade output sufficient for 1.3 million EVs annually. Tokai Carbon’s retreat from its German electrode unit underscores lingering margin pressure. EU Battery Regulation 2023/1542, however, is catalyzing 2,000 tpa pilot recycling lines such as EMR’s Birmingham facility, which offers 99.9%-purity recovered graphite compliant with ASTM specifications.

Competitive Landscape
Global supply is moderately concentrated: GrafTech International and Phillips 66 together control most of the capacity outside China, while at least 14 coal-tar producers and several state-owned refiners compete inside China. Vertical integration is the dominant hedge; GrafTech secures electrode feedstock internally, and Phillips 66 melds refinery and anode-grade output to lock in long-term contracts, the latest being its 2025 agreement with Epsilon Advanced Materials. Non-integrated electrode firms such as Tokai Carbon have faced cost pressure, prompting a 10% price rise and facility consolidation in 2025.
Innovation races on two fronts. Established firms file process patents to improve yield and quality, while newcomers pursue recycling and bio-based hard carbon. Most recyclers remain below commercial scale, but pilot purity levels already meet 99.8-99.9% thresholds, suggesting viable supplement capacity after 2028. Compliance with ISO 9001 and ISO 14001 has become a de-facto entry requirement, favoring incumbents with audited systems.
Mergers and strategic alliances continue. POSCO Future M is moving upstream into graphite electrode technology, and GrafTech has announced a USD 200 million Texas expansion. The EU’s carbon-footprint declaration requirement from 2027 and the U.S. Inflation Reduction Act’s domestic-content incentives encourage new localized capacity, likely sustaining moderate concentration while inviting specialist entrants capable of clean, traceable supply chains.
Needle Coke Industry Leaders
ENEOS Corporation
GrafTech International
Mitsubishi Chemical Group Corporation
Phillips 66 Company
China Baowu Steel Group Corp., Ltd
- *Disclaimer: Major Players sorted in no particular order

Recent Industry Developments
- October 2025: Iranian researchers developed a method to produce high-purity, nano-structured needle coke using oil residues and asphaltenes, which are low-cost domestic materials. The project aimed to reduce imports and create a sustainable supply chain for graphite electrodes used in steel and aluminum production.
- September 2025: Epsilon Advanced Materials (EAM) partnered with Phillips 66 Company to establish a long-term supply agreement for needle coke from the Lake Charles refinery. This agreement supported the development of a planned 30,000 tpa graphite-anode plant in North Carolina, ensuring a stable supply of the essential feedstock for manufacturing graphite active anode material used in Electric Vehicles (EVs) and Energy Storage Systems (ESS).


Global Needle Coke Market Report Scope
Needle coke is a high-quality carbon raw material produced from coal tar and petroleum. It is generally formed as highly crystalline graphene-like carbons exhibiting long-range microstructural order with few impurities and a low coefficient of thermal expansion. It is primarily used for the manufacturing of graphite electrodes and lithium-ion batteries.
The needle coke market is segmented by product type, application, and geography. By product type, the market is segmented into petroleum-based needle coke and coal-tar pitch-based needle coke. By application, the market is segmented into graphite electrodes, lithium-ion batteries, and other applications. The report also covers the market sizes and forecasts for needle coke in 16 countries across major regions. For each segment, the market sizing and forecasts have been done on the basis of volume (Metric Tons).
| Petroleum-based Needle Coke |
| Coal-tar Pitch-based Needle Coke |
| Graphite Electrodes |
| Lithium-ion Batteries |
| Other Applications |
| Asia-Pacific | China |
| India | |
| Japan | |
| South Korea | |
| Rest of Asia-Pacific | |
| North America | United States |
| Canada | |
| Mexico | |
| Europe | Germany |
| United Kingdom | |
| France | |
| Italy | |
| Russia | |
| Rest of Europe | |
| South America | Brazil |
| Argentina | |
| Rest of South America | |
| Middle-East and Africa | Saudi Arabia |
| South Africa | |
| Rest of Middle-East and Africa |
| By Product Type | Petroleum-based Needle Coke | |
| Coal-tar Pitch-based Needle Coke | ||
| By Application | Graphite Electrodes | |
| Lithium-ion Batteries | ||
| Other Applications | ||
| By Geography | Asia-Pacific | China |
| India | ||
| Japan | ||
| South Korea | ||
| Rest of Asia-Pacific | ||
| North America | United States | |
| Canada | ||
| Mexico | ||
| Europe | Germany | |
| United Kingdom | ||
| France | ||
| Italy | ||
| Russia | ||
| Rest of Europe | ||
| South America | Brazil | |
| Argentina | ||
| Rest of South America | ||
| Middle-East and Africa | Saudi Arabia | |
| South Africa | ||
| Rest of Middle-East and Africa | ||


Key Questions Answered in the Report
What is the forecast volume for global needle coke demand by 2031?
It is projected to reach 6.00 million metric tons by 2031, reflecting a 15.11% CAGR from 2026.
Which product type leads consumption?
Petroleum-based grades led with 85.23% of 2025 volume and are forecast to grow at 16.18% CAGR through 2031.
Why is Asia-Pacific so dominant?
China, South Korea, and India house most delayed-coking and battery-anode capacity, giving the region 87.88% of 2025 volume and a forecast 15.56% CAGR.
Are bio-based hard-carbon anodes a threat?
Not in the medium term, as global sodium-ion capacity is still under 50 GWh and pilot economics trail synthetic graphite by around 10%.
Page last updated on:


