Hungary ICT Market Size and Share
Market Overview
| Study Period | 2020 - 2031 |
|---|---|
| Forecast Data Period | 2026 - 2031 |
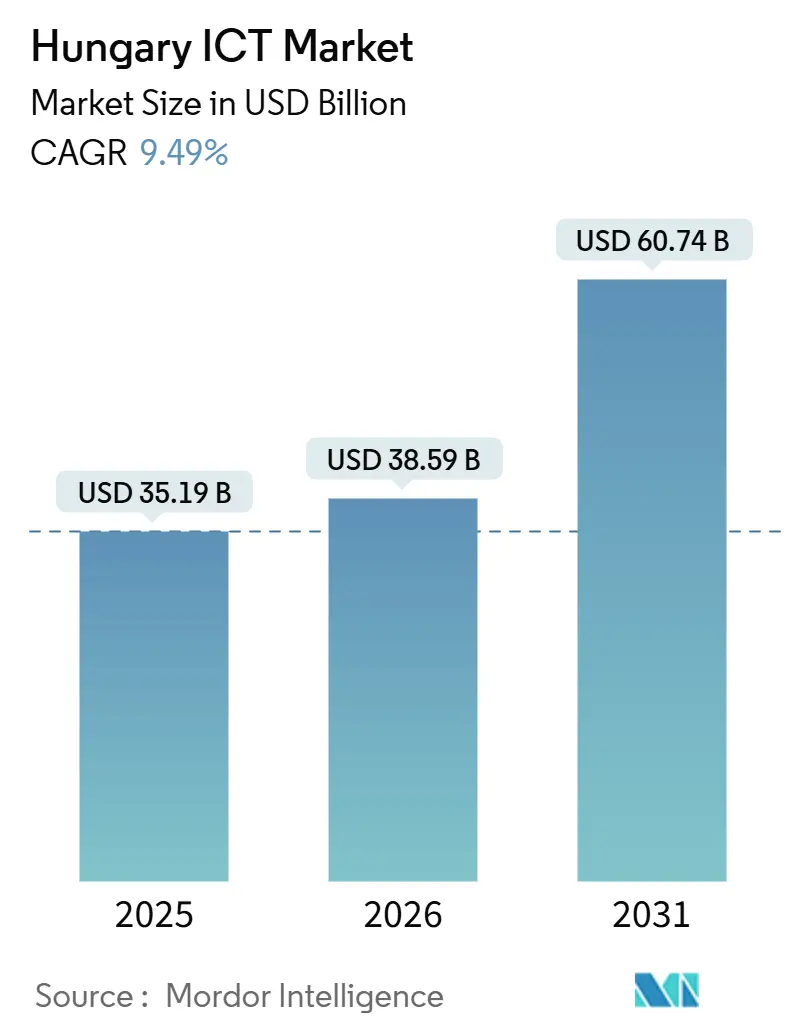
| Base Year Market Size (2025) | USD 35.19 Billion |
| Market Size (2026) | USD 38.59 Billion |
| Market Size (2031) | USD 60.74 Billion |
| Growth Rate (2026 - 2031) | 9.49% CAGR |
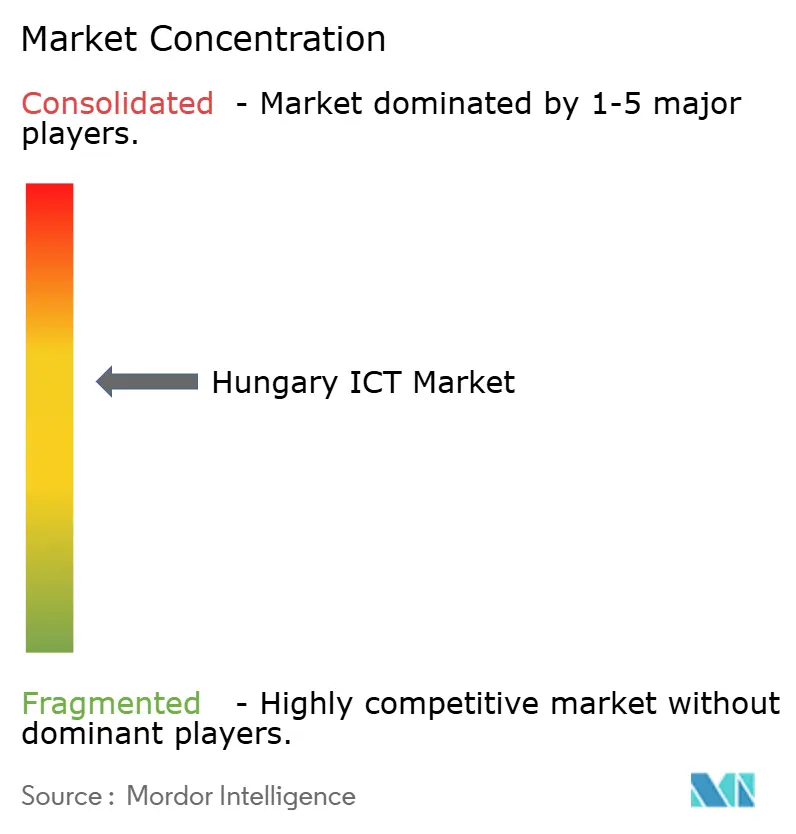
| Market Concentration | Medium |
Major Players *Disclaimer: Major Players sorted in no particular order Image © ���ϲ�����. Reuse requires attribution under CC BY 4.0. | |
Hungary ICT Market Analysis by ���ϲ�����
The Hungary ICT Market size is expected to increase from USD 35.19 billion in 2025 to USD 38.59 billion in 2026 and reach USD 60.74 billion by 2031, growing at a CAGR of 9.49% over 2026-2031.
Persistent recovery and resilience funding, nearshoring demand from Western Europe, and mandatory e-invoicing rules together anchor short-term momentum in the Hungary ICT market. Cloud spending accelerates as public procurement requires European Economic Area data residency, steering workloads toward providers with local availability zones. Carriers leverage the country’s 76.2% fiber-to-the-premises footprint to layer private 5G slices for automotive original equipment manufacturers, while zero-trust security architectures replace perimeter firewalls under the NIS2 directive. Supply-chain exposure to imported semiconductors continues to pressure margins, yet vendors that bundle local hosting, managed cybersecurity, and sector-specific edge stacks are capturing higher-value contracts in the Hungary ICT market.
Key Report Takeaways
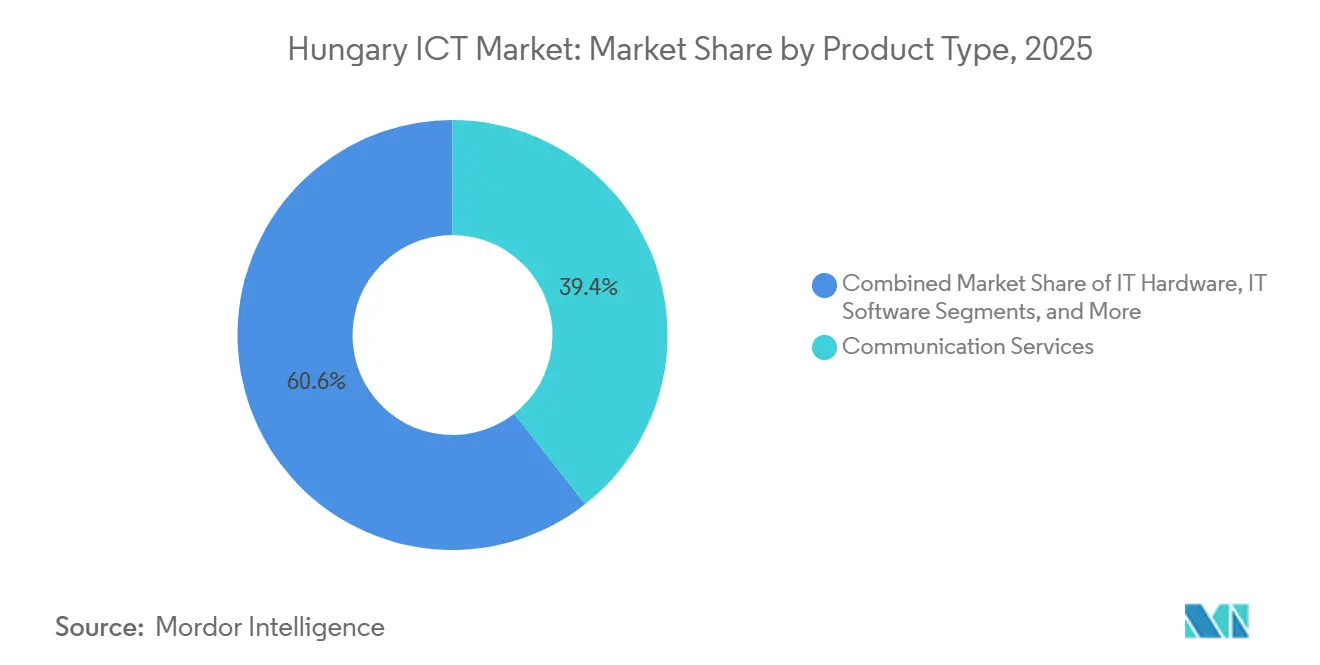
- By product type, communication services led with 39.40% revenue share in 2025, while IT security is advancing at a 10.40% CAGR through 2031.
- By enterprise size, large enterprises held 63.10% of the Hungary ICT market share in 2025, whereas small and medium enterprises are projected to expand at a 9.70% CAGR through 2031.
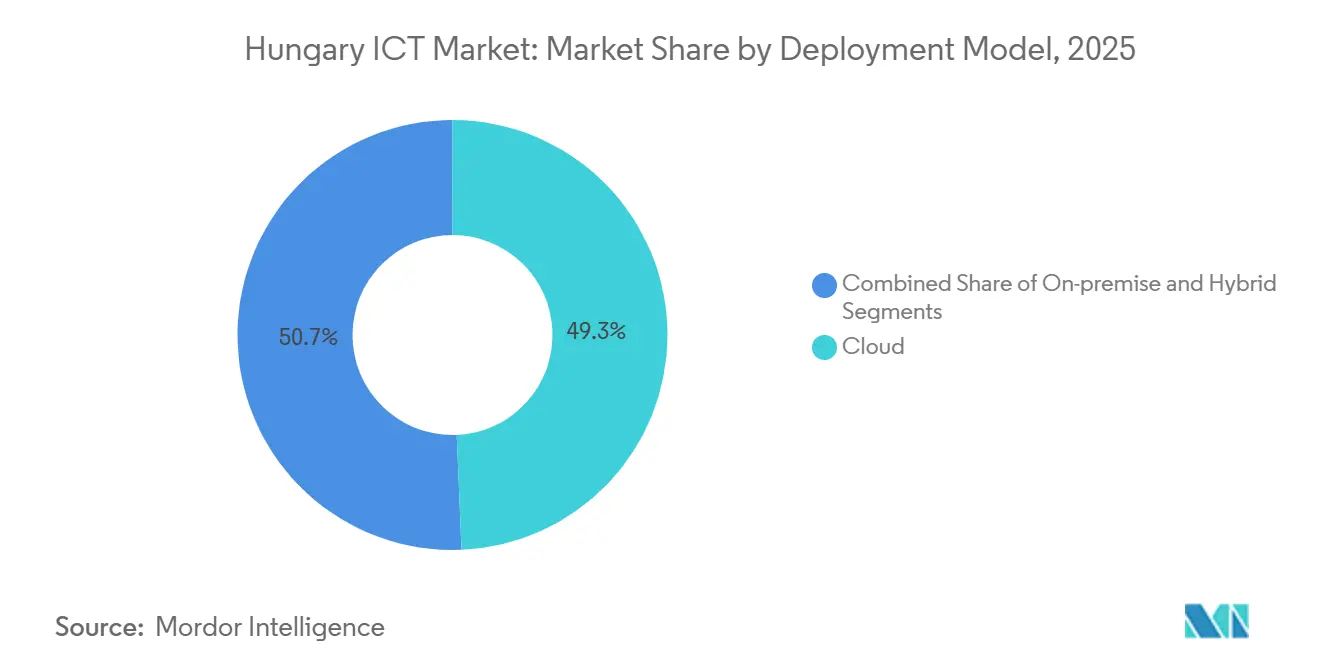
- By deployment model, cloud captured 49.34% of the Hungary ICT market size in 2025 and is forecast to grow at an 11.40% CAGR to 2031.
- By end-user vertical, government and public administration accounted for a 22.10% share of the Hungary ICT market size in 2025; gaming and esports is moving at a 12.80% CAGR through 2031.
Note: Market size and forecast figures in this report are generated using ���ϲ�����’s proprietary estimation framework, updated with the latest available data and insights as of January 2026.
Hungary ICT Market Trends and Insights
Drivers Impact Analysis
| Driver | (~)% Impact on CAGR Forecast | Geographic Relevance | Impact Timeline |
|---|---|---|---|
| Government's Digital Success Program 2030 Accelerating Public-Sector ICT Spending | +2.1% | National, concentrated in Budapest and regional capitals | Medium term (2-4 years) |
| Ultrafast Broadband and 5G Deployment Supported by EU Structural Funds | +1.8% | National, with early gains in Budapest, Debrecen, Szeged | Short term (≤ 2 years) |
| Nearshoring of EU Software Development to Hungary's Skilled, Cost-Competitive Talent Pool | +1.5% | National, spill-over to Visegrad Four region | Long term (≥ 4 years) |
| SMB Cloud Adoption Driven by Mandatory e-Invoicing and Digital Tax Compliance | +1.3% | National, strongest in trade and retail sectors | Short term (≤ 2 years) |
| Industry 4.0 Roll-out in Automotive Manufacturing Clusters Fueling IIoT Demand | +1.2% | Regional, focused on Győr, Kecskemét, Esztergom automotive hubs | Medium term (2-4 years) |
| RRF-Funded Cybersecurity Modernization in Critical Infrastructure | +0.9% | National, prioritizing energy, utilities, transport | Medium term (2-4 years) |
| Source: ���ϲ����� | |||
Government's Digital Success Program 2030 Accelerating Public-Sector ICT Spending
Recovery and Resilience Facility allocations earmark significant capital for interoperable e-government platforms. Ministries that delayed procurements until 2025 are now specifying cloud-native designs, bypassing legacy technical debt[1]Source: European Commission, “Recovery and Resilience Facility,” commission.europa.eu. A unified citizen-identity gateway scheduled for 2027 will consolidate 18 authentication systems and trigger follow-on middleware contracts worth roughly EUR 120 million (USD 132 million). Demand is shifting from hardware refresh to API orchestration, rewarding integrators with Kubernetes expertise. Mid-career cloud architects remain scarce outside Budapest, inflating wage premiums. Collectively, these factors keep the Hungary ICT market on a robust growth trajectory.
Ultrafast Broadband and 5G Deployment Supported by EU Structural Funds
Fiber penetration reached 76.2% in 2024 after the Connecting Europe Facility co-financed last-mile builds in settlements below 5,000 inhabitants. Rural connectivity unlocks precision-agriculture and telemedicine use cases, generating edge-gateway demand. Magyar Telekom and Vodafone Hungary activated 5G standalone cores in 15 cities by late 2025. Spectrum obligations to cover 90% of the population by 2029 front-load capex, tightening operator cash flows yet widening the serviceable base for low-latency applications. Open radio access network interfaces gain favor as carriers diversify suppliers amid geopolitical scrutiny. These network foundations underpin medium-term expansion in the Hungary ICT market.
Nearshoring of EU Software Development to Hungary's Skilled, Cost-Competitive Talent Pool
Western European enterprises relocated roughly 12,000 developer roles to Hungary between 2023 and 2025, attracted by labor costs 40% below Frankfurt and a 94% English-proficiency rate among computer-science graduates[2]Source: OECD, “Skills Strategy,” oecd.org. Budapest’s innovation quarters post office occupancy rates near 97%, with rents up 18% year on year. Senior architects now command salaries close to Western parity, eroding cost advantages, while junior developers lack exposure to regulated-industry frameworks, prolonging onboarding cycles. Universities produced 8,200 information-technology graduates in 2024, yet 30% emigrate within two years. Employers respond with equity incentives and remote-first policies that disperse investment into secondary cities, gradually broadening the Hungary ICT market.
SMB Cloud Adoption Driven by Mandatory e-Invoicing and Digital Tax Compliance
The National Tax and Customs Administration’s real-time invoice gateway processed 3.2 billion transactions in 2025 after the revenue threshold for mandatory reporting fell to HUF 100 million (USD 280,000). Small businesses rushed toward cloud enterprise resource planning suites with native application programming interface connectors, lifting software-as-a-service penetration by 35 percentage points between 2023 and 2025. The schema’s 87 mandatory fields and strict 5-second validation reject manual entry, effectively locking out desktop packages. Retailers handling 40% of invoice volume now pilot anomaly-detection modules, opening a compliance-as-a-service niche. Regulatory lock-in secures recurring revenue streams inside the Hungary ICT market.
Restraint Impact Analysis
| Restraint | (~)% Impact on CAGR Forecast | Geographic Relevance | Impact Timeline |
|---|---|---|---|
| Regional Digital Skills Shortage Outside Budapest | -1.4% | National, acute in counties beyond Pest, Győr-Moson-Sopron | Long term (≥ 4 years) |
| Dependence on Imported Hardware Components Exposes Supply-Chain Risks | -0.8% | National, affecting all hardware-dependent segments | Medium term (2-4 years) |
| Legacy Public-Sector Systems Hindering Seamless Integration Projects | -0.7% | National, concentrated in ministries and state-owned enterprises | Medium term (2-4 years) |
| Data-Sovereignty Concerns Slowing Public Cloud Uptake in Regulated Industries | -0.6% | National, strongest in BFSI and healthcare verticals | Short term (≤ 2 years) |
| Source: ���ϲ����� | |||
Regional Digital Skills Shortage Outside Budapest
Only 51% of citizens possessed basic digital skills in 2024, well below the European Union’s 80% target. Counties such as Debrecen and Pécs experience hiring cycles of up to 9 months for mid-level cloud architects, compared with 8 weeks in the capital. Universities outside Budapest graduated 1,800 information-technology specialists in 2024, compared with 6,400 in the capital. Limited career progression drives attrition, reinforcing regional gaps. Government vocational funding of EUR 45 million (USD 49.5 million) trails employer demand, prolonging talent imbalances that are tempering the expansion of the Hungarian ICT market.
Dependence on Imported Hardware Components Exposes Supply-Chain Risks
Hungary imports 94% of semiconductors, switches, and server parts, mainly from East Asia. Red Sea shipping disruptions in 2024 doubled delivery windows for storage arrays. A 10% depreciation in forints raises hardware costs by roughly 7% because contracts are dollar-denominated. Domestic fabrication capacity is negligible, and the European Chips Act has yet to steer greenfield plants toward Hungary[3]Source: European Commission, “European Chips Act,” ec.europa.eu . These vulnerabilities squeeze integrator margins and may slow refresh cycles inside the Hungary ICT market.
Segment Analysis
By Products Type: Security Spending Outpaces Legacy Infrastructure Refresh
Hungary ICT market size for product categories tilted toward communication services in 2025, when the segment captured 39.40% of revenue. IT security, however, is projected to expand at a 10.40% CAGR to 2031 as NIS2 compliance pushes operators to adopt zero-trust network access platforms. The Hungary ICT market share for IT security rose steadily during 2024-2025, and ransomware incidents among critical-infrastructure operators intensified demand for endpoint detection and response suites. Meanwhile, IT services benefit from a strong nearshoring pipeline valued at EUR 420 million (USD 462 million) in 2025. Hardware vendors face squeezed margins because 94% of components are sourced from abroad, while software vendors migrate customers from on-premises licenses to subscription models tied to the NAV invoice gateway.
Communication services growth moderates as fiber buildouts near saturation and mobile operators divert investment toward software-defined overlays. IT infrastructure spending transitions from capital expenditure to consumption-based public cloud models, a shift accelerated by the Ministry of Interior’s mandate that citizen data reside in a sovereign government cloud. Vendors with Hungarian data centers or transparent data-lineage tooling position favorably. Conversely, pure software-as-a-service players without local points of presence face procurement disqualification despite feature parity, reshaping competitive positioning in the Hungary ICT market.
Note: Segment shares of all individual segments available upon report purchase
By End-User Enterprise Size: SME Acceleration Narrows the Deployment Gap
Large enterprises commanded 63.10% of the Hungary ICT market share in 2025, reflecting early adoption of enterprise resource planning and customer relationship management platforms. Small and medium enterprises now represent the fastest-growing cohort, advancing at a 9.70% CAGR on the back of mandatory e-invoicing rules. Monthly subscription pricing aligns with SME cash-flow constraints, while the Digital Leap Loan Program provided EUR 85 million (USD 93.5 million) in subsidized credit during 2025, shortening payback periods. Large enterprises continue to drive hybrid-cloud deployments that protect intellectual property on-site while exploiting public-cloud elasticity for commodity workloads.
Financing and talent distinguish the segments. SMEs lack internal information-technology staff, relying on out-tasked support, whereas large enterprises build dedicated cloud-operations teams. Currency volatility exposes large multi-year enterprise agreements to unforeseen cost spikes when energy tariffs or colocation fees rise. As NAV expands real-time reporting scope, up to 18,000 additional small firms must digitize finance workflows, securing a durable pipeline for vendors serving the Hungary ICT market.
By Deployment Model: Cloud Dominance Driven by Regulatory Lock-In
Cloud installations accounted for 49.34% of deployments in 2025 and are set to grow at an 11.40% CAGR through 2031, the highest rate among deployment models. Hungary ICT market size for cloud expands as public procurement requires European Economic Area residency and ISO 27001 certification. On-premise footprints persist inside banking core systems and utility operational-technology networks, yet refresh cycles lengthen to seven years while organizations plan cloud migrations. Hybrid architectures thrive in automotive and manufacturing plants that need millisecond response for industrial internet of things telemetry before pushing aggregated analytics into regional clouds.
Sovereign cloud offerings from Magyar Telekom and 4iG gained traction after the Ministry of Interior instructed agencies in 2025 to store citizen data locally. Financial institutions blend private cloud for payment processing with public cloud for analytics, balancing National Bank of Hungary oversight with scalability. The Schrems II ruling continues to steer enterprises away from U.S. providers lacking EU data-processing addenda, keeping workload growth inside European zones and reinforcing momentum in the Hungary ICT market.
Note: Segment shares of all individual segments available upon report purchase
By End-User Industry Vertical: Gaming Surge Contrasts with Mature BFSI Spend
Government and public administration represented 22.10% of spending in 2025, energized by EUR 1.73 billion (USD 1.9 billion) in Recovery and Resilience Facility allocations. Gaming and esports, however, is the fastest-growing vertical at a 12.80% CAGR to 2031, buoyed by Budapest’s ambition to become Central Europe’s tournament hub. Banking, financial services, and insurance posts mid-single-digit growth constrained by cautious cloud adoption for payment workloads. Manufacturing investment rises with automotive electrification, as Audi and Mercedes-Benz deploy edge platforms for battery production.
Retail and logistics accelerate omnichannel projects despite inflation pressure, while healthcare lags Western peers because fragmented hospital ownership complicates procurement coordination. Energy and utilities concentrate on cybersecurity modernization under NIS2, and other verticals adopt ICT solutions at varied paces tied to sector-specific triggers. This diversity cushions cyclical swings, giving the Hungary ICT market a balanced demand profile.
Geography Analysis
Budapest and Pest County captured roughly 68% of Hungary ICT market spending in 2025, driven by the capital’s concentration of multinational headquarters, ministries, and banks. Győr-Moson-Sopron County ranks second thanks to automotive Industry 4.0 deployments that require private 5G networks and edge gateways.
Debrecen and Szeged emerge as secondary hubs; Debrecen’s BMW battery-assembly facility is expected to generate EUR 35 million (USD 38.5 million) in ICT procurement through 2028. Smaller counties such as Nógrád lag because digital-skills penetration trails the national average by 22 percentage points.
Vienna-based firms increasingly route software contracts through Budapest to exploit Hungary’s 9% corporate tax rate, the lowest in the European Union, and labor costs 35% below Austrian equivalents. Hungary’s 2025 cloud, big data, and artificial intelligence adoption rate of 42% lies between Czechia’s 51% and Poland’s 38%. Rural internet gaps persist despite Connecting Europe Facility co-financing, leaving 22% of eligible addresses without last-100-meter fiber, which may not close until 2027. Innovation centers in Pécs, Miskolc, and Nyíregyháza attract seed-stage startups but struggle to retain them beyond 18 months, as venture capital and talent remain capital-centric.
Competitive Landscape
The top five suppliers controlled an estimated 38% combined revenue in 2025, giving the Hungary ICT market a moderately concentrated profile. 4iG’s EUR 1.8 billion (USD 1.98 billion) purchase of Vodafone Hungary created the first vertically integrated player bundling connectivity, managed security, and edge solutions. Global integrators leverage Hungary’s dense fiber backbone for hybrid-cloud migrations, yet outside Budapest digital-skills shortages inflate bill rates by up to 40%, opening niches for nearshore delivery models blending Hungarian juniors with Western senior oversight.
White-space opportunities cluster in sovereign cloud, NIS2-aligned cybersecurity-as-a-service, and low-latency gaming back-ends. Local specialists such as Aliz Technologies and Balasys IT win enterprise deals by holding premier certifications in Google Cloud and Palo Alto Networks ecosystems.
Patent filings remain sparse, only 47 ICT patents were granted in 2024 versus 312 in Czechia, so competitive differentiation hinges on implementation speed and regulatory fluency rather than proprietary algorithms. Overall, successful vendors co-locate compute inside Hungary, offer transparent data-lineage tooling, and bundle sector-specific services that align with sovereignty policies.
Hungary ICT Industry Leaders
IBM Corporation
Tata Consultancy Services
SAP SE
Oracle Corporation
Cognizant Technology Solutions Corp.
- *Disclaimer: Major Players sorted in no particular order
Recent Industry Developments
- February 2026: Microsoft Hungary broke ground on its Budapest cloud region, keeping delivery timelines on track for a 2027 launch, after securing building permits in late 2025.
- January 2025: Magyar Telekom completed nationwide 5G standalone deployment across 18 cities at a capital outlay of EUR 240 million (USD 264 million).
- March 2025: The European Court of Auditors concluded that digital components in RRF plans require clearer focus to maximise impact on Hungary’s transformation.
- December 2024: Microsoft Hungary announced a EUR 150 million (USD 165 million) data-center investment to meet public-sector data-residency mandates.
- October 2024: 4iG finalized the integration of Vodafone Hungary, realizing EUR 45 million (USD 49.5 million) in annual cost synergies.
Research Methodology Framework and Report Scope
Market Definitions and Key Coverage
Our study tracks all spending on hardware, packaged and custom software, IT consulting, managed services (including cloud IaaS / PaaS), and fixed as well as mobile telecommunication services that originate inside Hungary's borders. Values are recorded in USD at buyer price, net of VAT, and cover both private and public sector demand.
Scope Exclusion: Pure-play media content, stand-alone consumer electronics retail, and offshore BPO exports are outside this scope.
Segmentation Overview
- By Products Type
- IT Hardware
- IT Software
- IT Services
- IT Infrastructure
- IT Security
- Communication Services
- By End-User Enterprise Size
- Small and Medium Enterprises
- Large Enterprises
- By Deployment Model
- On-premise
- Cloud
- Hybrid
- By End-User Industry Vertical
- Government and Public Administration
- BFSI
- Energy and Utilities
- Retail, E-commerce and Logistics
- Manufacturing and Industry 4.0
- Healthcare and Life Sciences
- Oil and Gas (Up-, Mid-, Down-stream)
- Gaming and Esports
- Other Verticals
Detailed Research Methodology and Data Validation
Primary Research
Mordor analysts interviewed domestic telecom operators, CIOs from banks, retail chains, manufacturers, and digital-policy officials across Budapest, Debrecen, and Szeged. Discussions clarified cloud adoption rates, 5Grollout timelines, average service price shifts, and planned government ICT allocations, allowing us to fill evident data gaps and challenge secondary assumptions.
Desk Research
We began by mining national statistics released by the Hungarian Central Statistical Office, Eurostat's ICT expenditure tables, the EU DESI index, and filings from the National Media & Infocommunications Authority. Trade insights from the U.S. International Trade Administration and IMF macro data anchored macro-economic ratios. Our team also sifted through company 10-Ks, Budapest Stock Exchange filings, and reputable press to capture operator revenue splits. Paid platforms such as D&B Hoovers and Dow Jones Factiva enriched corporate breakouts and historical series.
These sources provided base indicators, device imports, subscriber counts, and corporate ICT budgets that frame total addressable spend. The list above is illustrative; many additional public and subscription sources were referenced to validate and cross-check figures.
Market-Sizing & Forecasting
We apply a top-down build that reconstructs national ICT outlays from government accounts, enterprise IT ratios to GDP, and telecom ARPU multiplied by active subscriptions, which are then corroborated through selected bottom-up checks such as sampled vendor revenues and channel ASP x volume benchmarks. Key model drivers include GDP growth, enterprise cloud penetration, mobile 5Gsubscriber ramp, average data traffic per user, ICT wage inflation, and public digital transformation budgets. Forecasts are generated through multivariate regression blended with ARIMA to capture cyclical patterns, with scenario adjustments endorsed by our interview panel. When bottom-up totals diverge beyond a 5 percent threshold, inputs are iterated before final lock-in.
Data Validation & Update Cycle
Outputs pass variance screening versus historical series, peer ratios, and independent signals. Senior reviewers vet anomalies, and any material event, policy change, M&A, or spectrum auction triggers an interim refresh. Reports are fully rebuilt each year, and a last-minute sense check is completed before delivery to clients.
Why Mordor's Hungary ICT Baseline Inspires Confidence
Estimates published for Hungary often vary because each firm favors unique service mixes, currency conversions, and refresh cadences.
Key gap drivers include narrower service baskets, single-year currency locks, and shorter forecast horizons used elsewhere, while Mordor maintains a six-year outlook, annual FX updates, and explicit inclusion of telecom carrier revenues.
Benchmark comparison
| Market Size | Anonymized source | Primary gap driver |
|---|---|---|
| USD 35.19 B (2025) | ���ϲ����� | |
| USD 32.19 B (2024) | Regional Consultancy A | excludes public cloud spend and updates biennially |
| USD 5.4 B (2024) | Industry Data Firm B | analyzes only hardware and packaged software layers |
| USD 31.59 M (2025) | Niche Analytics C | focuses on sampled SMEs; omits telecom services entirely |
These contrasts show that, by combining comprehensive scope with disciplined variable selection and frequent refreshes, ���ϲ����� delivers a balanced, transparent baseline that decision-makers can trust.
Key Questions Answered in the Report
How big will the Hungary ICT market be by 2031?
It is projected to reach USD 60.74 billion by 2031, expanding at a 9.49% CAGR from 2026.
Which product type grows fastest within the country?
IT security leads with a 10.40% CAGR through 2031, driven by NIS2-related zero-trust adoption.
Why are small and medium enterprises accelerating tech spending?
Mandatory real-time e-invoicing forces cloud enterprise resource planning adoption, lifting SME outlays at a 9.70% CAGR.
What share of deployments use cloud today?
Cloud holds 49.34% of installations and is set to grow faster than on-premise or hybrid alternatives.


