Chemical TIC Market Size and Share
Market Overview
| Study Period | 2020 - 2031 |
|---|---|
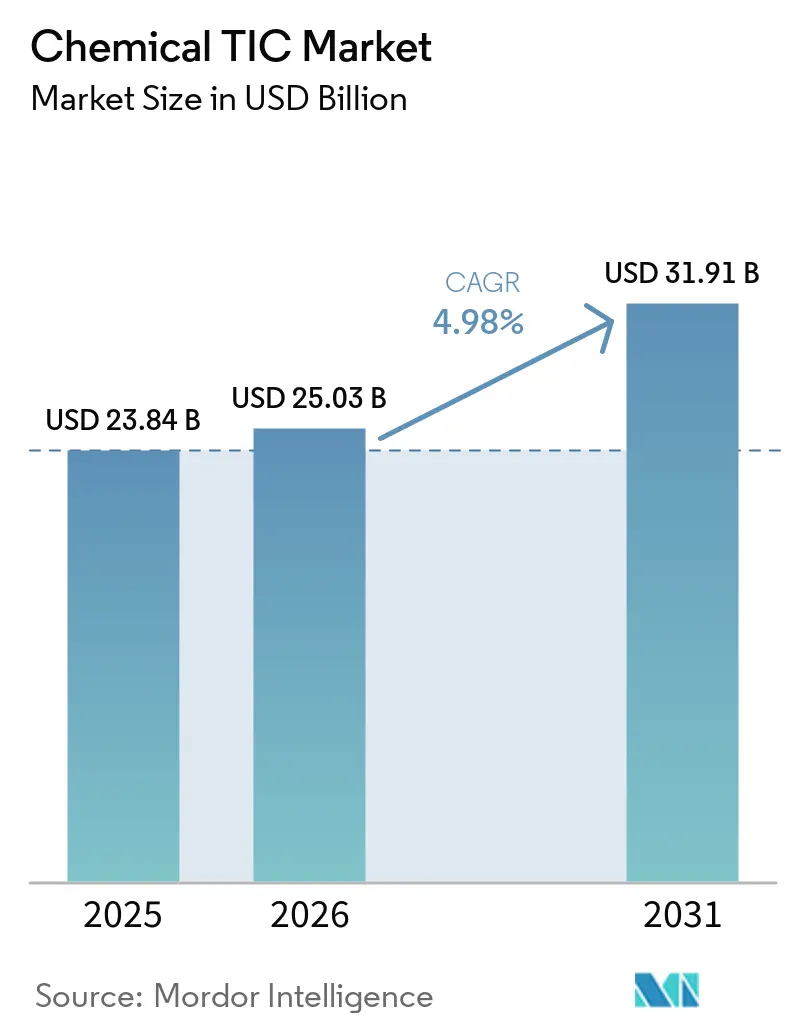
| Market Size (2026) | USD 25.03 Billion |
| Market Size (2031) | USD 31.91 Billion |
| Growth Rate (2026 - 2031) | 4.98% CAGR |
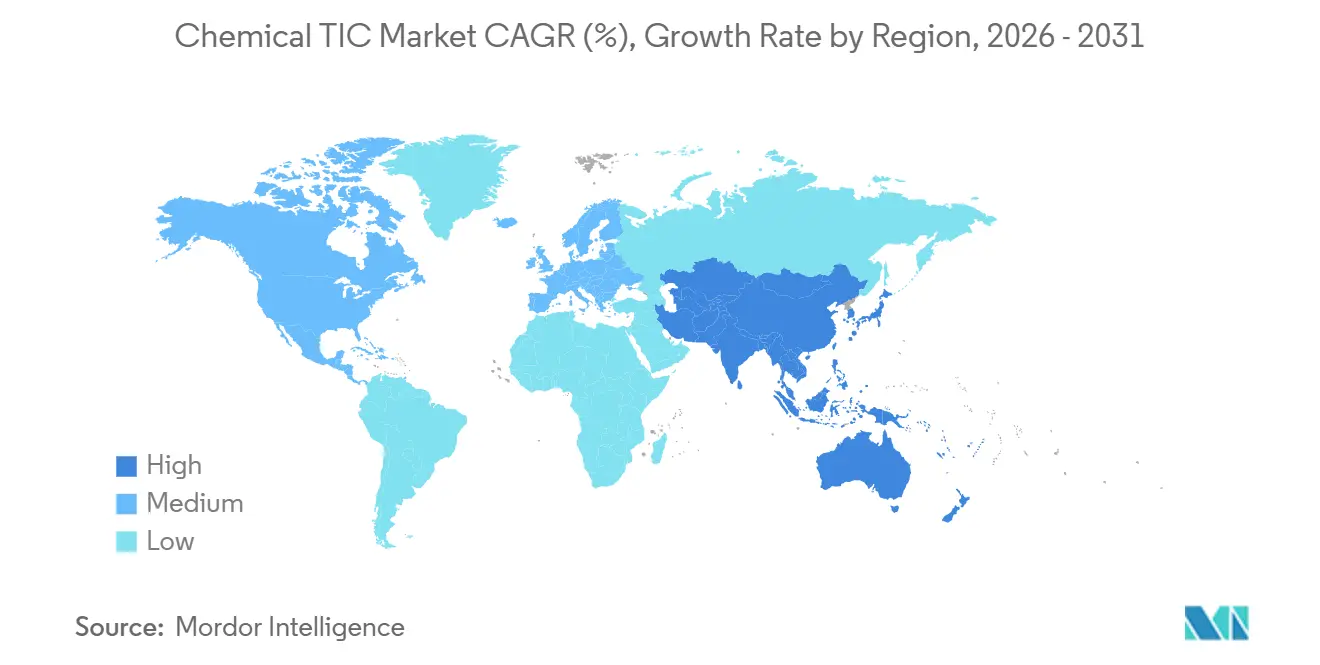
| Fastest Growing Market | Asia Pacific |
| Largest Market | North America |
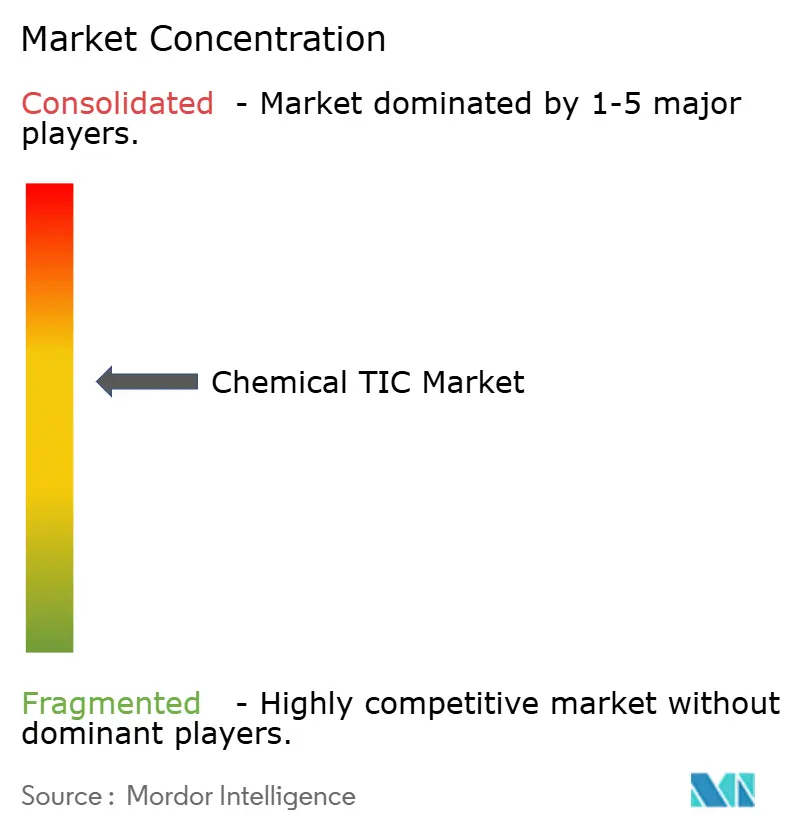
| Market Concentration | Medium |
Major Players *Disclaimer: Major Players sorted in no particular order Image © ���ϲ�����. Reuse requires attribution under CC BY 4.0. | |
Chemical TIC Market Analysis by ���ϲ�����
The chemical TIC market was valued at USD 23.84 billion in 2025 and is estimated to grow from USD 25.03 billion in 2026 to USD 31.91 billion by 2031, at a CAGR of 4.98% from 2026 to 2031. Demand is shifting from periodic audits to near-continuous verification as regulators narrow compliance windows and expand substance bans. Third-party laboratories with validated ultra-trace methods are winning business as PFAS limits tighten, while digital reporting platforms and harmonized data formats shorten the time to recognition for foreign test reports. Outsourcing is accelerating because mid-tier producers cannot afford capital-intensive LC-MS/MS and ICP-MS systems. At the same time, Asia-Pacific capacity additions and North American reshoring are creating fresh inspection backlogs, giving regional specialists opportunities to scale.
Key Report Takeaways
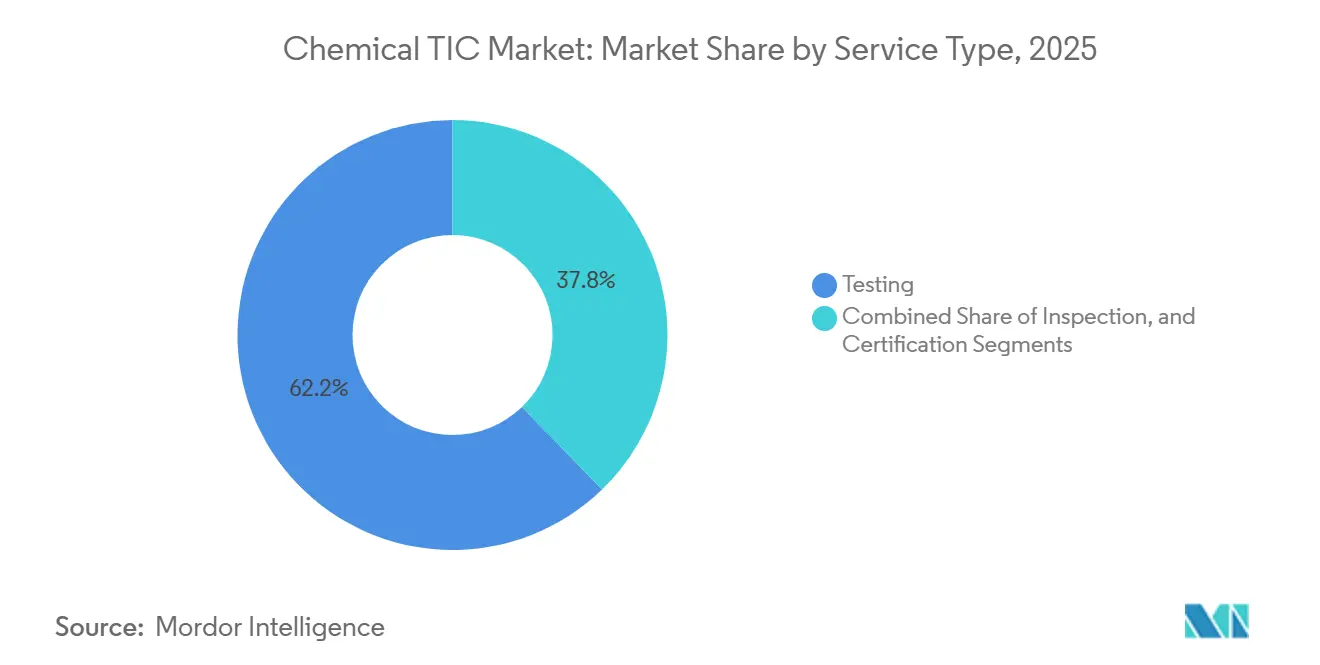
- By service type, testing led with 62.23% of the chemical TIC market share in 2025, while certification is forecast to expand at a 5.25% CAGR through 2031.
- By sourcing type, in-house laboratories accounted for 56.25% of the chemical TIC market share in 2025, whereas outsourced services are projected to grow at a 5.65% CAGR to 2031.
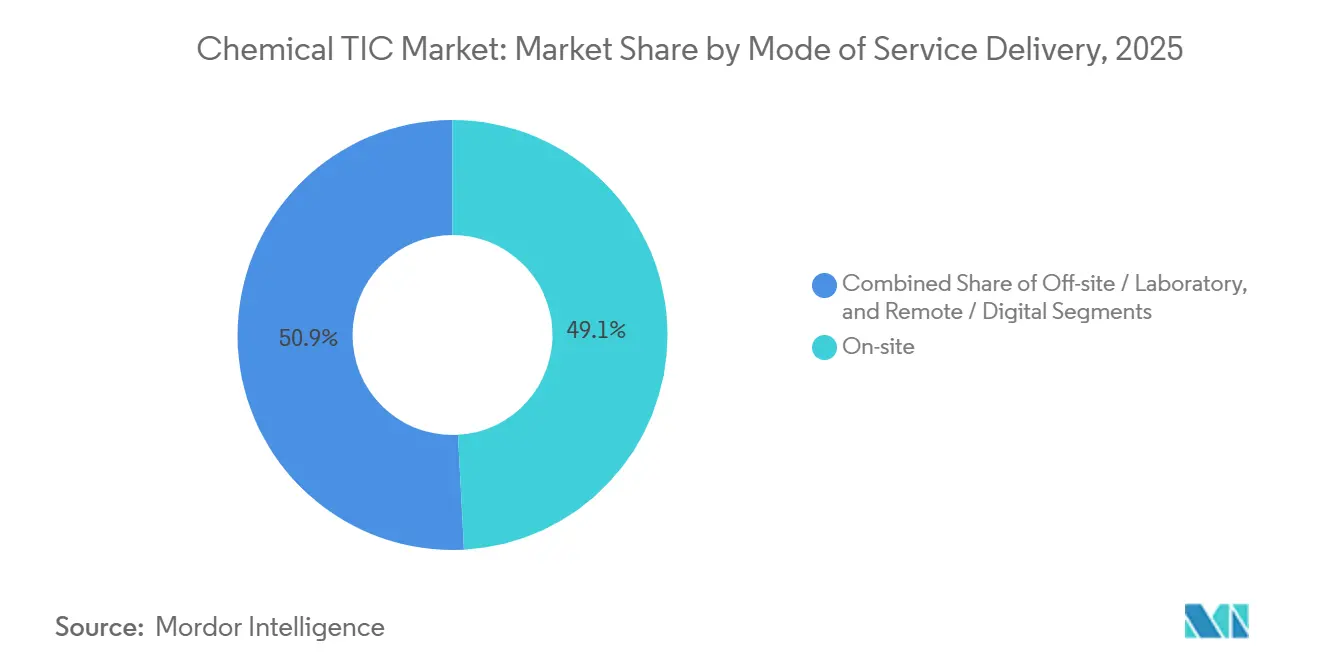
- By mode of service delivery, on-site inspection held 49.14% of the chemical TIC market share in 2025 and remote and digital modalities are advancing at a 5.56% CAGR through 2031.
- By geography, North America held 32.31% share of the chemical TIC market share in 2025 and Asia-Pacific is advancing at a 5.81% CAGR through 2031.
Note: Market size and forecast figures in this report are generated using ���ϲ�����’s proprietary estimation framework, updated with the latest available data and insights as of January 2026.
Global Chemical TIC Market Trends and Insights
Drivers Impact Analysis*
| Driver | (~) % Impact on CAGR Forecast | Geographic Relevance | Impact Timeline |
|---|---|---|---|
| Tightening global chemical-safety regulations | +1.4% | Global, strongest in North America and EU | Medium term (2-4 years) |
| Rising sustainability and ESG disclosure mandates | +1.1% | Global, led by EU and North America | Medium term (2-4 years) |
| Surge in PFAS ultra-trace testing demand | +0.9% | North America and EU core, expanding to Asia-Pacific | Short term (≤ 2 years) |
| Growing outsourcing to specialized TIC providers | +0.8% | Global, accelerating in Asia-Pacific and South America | Long term (≥ 4 years) |
| Rapid industrial growth in Asia-Pacific chemical production | +0.6% | Asia-Pacific core, spillover to Middle East | Long term (≥ 4 years) |
| Digital-twin validation for chemical plants | +0.2% | North America and EU early adopters, Asia-Pacific following | Long term (≥ 4 years) |
| Source: ���ϲ����� | |||
Tightening Global Chemical-Safety Regulations
One-substance-one-assessment rules in the EU and stricter PFAS thresholds in the United States have cut filing times and raised analytical standards. Programs such as EPA Methods 533, 537.1, and 1633 now serve as pass-or-fail gates for contract awards, so labs without validated protocols lose access to lucrative municipal tenders. The unified EU dossier removes duplicate national reviews, making early compliance essential for exporters. These moves, taken together, widen the moat for laboratories with multi-jurisdictional accreditation, boosting high-margin compliance testing.[1]European Commission, “Corporate Sustainability Reporting Directive,” Ec.europa.eu
Rising Sustainability and ESG Disclosure Mandates
The EU CSRD and ESRS made third-party assurance obligatory for roughly 50 000 companies starting with fiscal-year 2024 reports. Verification now covers greenhouse gas emissions, water, waste, and biodiversity metrics, driving demand for life-cycle analysis, environmental product declarations, and carbon footprint labels. Similar rules by the U.S. SEC, though narrower, still require auditable Scope 1 and 2 data. Large testing, inspection and certification (TIC) groups have responded by bundling financial, environmental, and process audits, locking in multi-year contracts.
Surge in PFAS Ultra-Trace Testing Demand
Federal and state MCLs of single-digit parts-per-trillion forced a pivot from GC-MS to LC-MS/MS with isotopic standards. Capital investment per instrument exceeds USD 0.5 million and demands cleanrooms and rigorous QA, driving consolidation toward providers already accredited under EPA quality-assurance programs. Growth has spilled into food-contact materials, biosolids, and battery chemistries, further deepening backlogs.
Growing Outsourcing to Specialized TIC Providers
A 2025 survey showed 37% of laboratories already outsource analytical testing, and 67-91% have no plans to order new instruments. Mergers such as SGS-ATS expanded their geographic reach and method portfolios, allowing mid-tier chemical companies to shift cost centers to operating expenses. Regional shortages of skilled analysts strengthen the case for outsourcing across Asia-Pacific and South America.
Restraints Impact Analysis*
| Restraint | (~) % Impact on CAGR Forecast | Geographic Relevance | Impact Timeline |
|---|---|---|---|
| High capital cost of advanced analytical instrumentation | -0.7% | Global, most acute in emerging markets | Medium term (2-4 years) |
| Shortage of skilled chemists and inspectors | -0.5% | Global, severe in North America and EU | Long term (≥ 4 years) |
| Price pressure on commoditized routine tests | -0.3% | Global, intensifying in Asia-Pacific | Short term (≤ 2 years) |
| Cyber-security liabilities of cloud-connected labs | -0.2% | North America and EU, expanding to Asia-Pacific | Medium term (2-4 years) |
| Source: ���ϲ����� | |||
High Capital Cost of Advanced Analytical Instrumentation
LC-MS/MS and ICP-MS systems required for parts-per-trillion detection routinely cost more than USD 500 000. Annual service contracts and consumables add as much as 20% to the initial outlay. When cleanroom build-outs, ultra-pure water systems, and specialized waste lines are included, breakeven volumes can exceed 25 000 samples per year, levels unattainable for regional labs. Limited access to low-cost credit in emerging markets exacerbates the barrier, forcing smaller firms to enter into partnerships or divestments.[2]Agilent Technologies, “LC-MS/MS Systems for PFAS Analysis,” Agilent.com
Shortage of Skilled Chemists and Inspectors
Roughly 30% of chemical-industry employees are already over 50 years old, forecasting a retirement cliff within the decade. Surveys in 2025 found that half of science-based SMEs rated recruitment as hard or very hard, and that the United Kingdom alone will need 11 million new graduates by 2035 to meet cross-sector demand. Testing, inspection and certification (TIC) companies are opening academies and apprenticeships, yet mastering ultra-trace methods still takes three-plus years, slowing capacity ramp-ups.
*Our updated forecasts treat driver/restraint impacts as directional, not additive. The revised impact forecasts reflect baseline growth, mix effects, and variable interactions.
Segment Analysis
By Service Type: Certification Gains as Sustainability Labels Proliferate
Certification services are expanding at a 5.25% CAGR through 2031, reflecting demand for safe-by-design claims, recycled-content verification, and carbon-neutral labels. Testing retained a dominant 62.23% share of the chemical TIC market in 2025, driven by PFAS detection, active pharmaceutical ingredient batch release, and export conformity checks. The value proposition is moving from sheer throughput to defensible data packages and quick turnaround. ISO/IEC 17025 accreditation remains the basic entry ticket, but clients now bundle it with ISO 9001 and ISO 14001, or sector-specific schemes such as the EPA National Environmental Laboratory Accreditation Program. Certification bodies are responding by acquiring niche LCA consultancies and expanding voluntary ecolabel portfolios, especially in the Asia-Pacific.
A notable shift is the rise of voluntary chemical-footprint benchmarks in downstream sectors such as automotive and consumer electronics, which press suppliers to obtain independent cradle-to-gate attestations. Tighter EU rules on Product Environmental Footprints and the Ecodesign for Sustainable Products Regulation are also steering new revenue. As a result, certification’s share of the chemical TIC market size is projected to climb steadily, while testing laboratories differentiate on method depth and data integrity rather than price. Inspection stays relevant for pre-start-up safety reviews and asset-integrity checks, but drones, thermal cameras, and gas detectors are reducing on-site labor hours.


By Sourcing Type: Outsourced Services Capture Mid-Tier Producers
In-house laboratories held 56.25% of the chemical TIC market share in 2025, largely anchored at large integrated producers with high sample volumes and strict IP controls. Smaller firms are switching to external partners to avoid heavy capex and recurring validation expenses. Outsourced services are projected to post a 5.65% CAGR through 2031, outpacing the overall market. The trend is most evident in Asia-Pacific, where greenfield projects outpace lab build-outs, and in North America, where reshoring adds multi-state compliance obligations.
Third-party providers are cementing their edge by locating laboratories near new petrochemical hubs, integrating cloud-connected LIMS, and offering bundled testing-and-certification packages. The chemical TIC industry segment also benefits from mounting evidence that outsourcing reduces time-to-market by allowing producers to focus on formulation research and development. Nevertheless, large multinationals still favor hybrid models, retaining core analytical capabilities for proprietary work while outsourcing surge volumes or specialty tests.
By Mode of Service Delivery: Remote and Digital Modalities Accelerate
On-site inspection accounted for 49.14% of 2025 revenue, yet its share is slowly eroding as remote and digital modalities grow at a 5.56% CAGR through 2031. Cloud-based platforms allow real-time certificate downloads and instant deviation alerts, cutting turnaround from weeks to days. Drone flights and fixed IoT sensors eliminate the need for manual tank entries, enhancing safety while meeting regulatory evidence requirements.
Off-site laboratory testing remains the mainstay because ultra-trace instruments demand stable utilities, vibration isolation, and highly trained staff. However, the boundary is blurring as mobile labs equipped with mini LC-MS systems perform preliminary screens before dispatching samples to central hubs.[3]Agilent Technologies, “LC-MS/MS Systems for PFAS Analysis,” Agilent.com Cyber-security has become a gating factor: clients now require ISO/IEC 27001 and NIST CSF compliance, and some specify secure private-cloud instances. Providers able to demonstrate hardened architecture are more likely to win long-term data-streaming contracts, cementing the remote modality’s role in the chemical TIC market.
Geography Analysis
North America captured 32.31% market share in 2025, driven by PFAS regulations, pharmaceutical batch-release demand, and the reshoring of chemical capacity. New water-quality standards require continuous LC-MS/MS monitoring, so laboratories in the United States expanded aggressively to secure accreditation before the April 2027 compliance deadline. Acquisitions such as SGS-ATS immediately increased geographic coverage, while facility builds in Arizona and Louisiana attracted pre-operational safety audits. Canada and Mexico benefit from near-shoring as multinational producers relocate supply chains, spurring the establishment of regional test hubs.
Europe maintains a robust base because of the CSRD, the Chemicals Strategy for Sustainability, and region-wide circular-economy objectives. About 50 000 companies must now secure limited or reasonable assurance on sustainability data, driving volume to certified bodies. Germany, France, the United Kingdom, and Italy dominate orders, though elevated energy prices and decarbonization costs erode margins for some local labs. The coming EU common data platform, slated for 2029, is expected to further streamline cross-border certificate recognition, giving scale players an edge.
Asia-Pacific with 5.81% CAGR is the fastest-growing territory through 2031. China alone plans more than 12 million tonnes of extra polyolefin capacity between 2025 and 2026, while India targets USD 87 billion in petrochemical investments over the decade.[4]S&P Global, “Asia-Pacific Chemical Capacity Outlook,” Spglobal.com Each greenfield plant requires start-up safety reviews, ISO 14001 certifications, and product-quality attestations, underpinning multi-year TIC demand. Regional hubs in Shanghai, Mumbai, and Singapore are widening their scope to battery materials, hydrogen, and semiconductor-grade chemicals.

Competitive Landscape
The four largest providers, SGS, Bureau Veritas, Intertek, and Eurofins hold a significant share of global revenue, leaving room for regional specialists. Consolidation gathered pace in 2025-2026 as capital needs for LC-MS/MS and ICP-MS escalated. SGS bought Applied Technical Services for USD 1.325 billion to gain 85 U.S. facilities and at least USD 30 million in annual synergies. Bureau Veritas added Lab System in Brazil, EcoPlus in South Korea, and nuclear consultancy Dornier Hinneburg, while exploring but ultimately shelving a merger with SGS that would have created a USD 30 billion giant.
Strategic positioning now revolves around data integrity, digital workflows, and niche accreditations. MISTRAS Group consolidated software assets under its MISTRAS Data Solutions brand to leverage industrial IoT and predictive analytics. UL Solutions improved EBITDA by 20.7% in 2025 through footprint optimization and AI-driven lab productivity, and Element Materials Technology invested USD 10 million in hydrogen-testing rigs and secured Volkswagen accreditation.[5]S&P Global, “Asia-Pacific Chemical Capacity Outlook,” Spglobal.com
Smaller players like SOCOTEC, Kiwa, and Apave established a strong position by specializing in microplastics analysis, delving into advanced chemistry research, and conducting environmental forensics. These companies frequently collaborate with public research institutes, a strategy that not only bolsters their credibility but also expedites the validation of their innovative methods.
Chemical TIC Industry Leaders
SGS SA
Bureau Veritas SA
Intertek Group plc
Eurofins Scientific SE
TÜV Rheinland AG
- *Disclaimer: Major Players sorted in no particular order

Recent Industry Developments
- February 2026: Element Materials Technology achieved Volkswagen accreditation for materials testing at its Warren and Plymouth laboratories in the United States.
- January 2026: SGS completed the USD 1.325 billion acquisition of Applied Technical Services, adding 85 U.S. facilities and more than 2,100 employees.
- January 2026: TÜV Rheinland completed the integration of Burotec, expanding its inspection and safety offerings for green-energy and hydrogen projects.
- November 2025: Bureau Veritas acquired Brazil-based Lab System Institute of Research and Testing, strengthening its Latin American presence.
- October 2025: Intertek launched extractables and leachables testing at its Reinach, Switzerland GMP laboratory to support Korean Pharmacopeia compliance.


Global Chemical TIC Market Report Scope
The Chemical TIC Market Report is Segmented by Service Type (Testing, Inspection, and Certification), Sourcing Type (In-house, and Outsourced), Mode of Service Delivery (On-site, Off-site/Laboratory, and Remote/Digital), and Geography (North America, Europe, Asia-Pacific, Middle East, Africa, and South America). The Market Forecasts are Provided in Terms of Value (USD).
| Testing |
| Inspection |
| Certification |
| In-house |
| Outsourced |
| On-site |
| Off-site / Laboratory |
| Remote / Digital |
| North America | United States |
| Canada | |
| Mexico | |
| Europe | United Kingdom |
| Germany | |
| France | |
| Italy | |
| Rest of Europe | |
| Asia-Pacific | China |
| Japan | |
| India | |
| South Korea | |
| Rest of Asia-Pacific | |
| Middle East | Israel |
| Saudi Arabia | |
| United Arab Emirates | |
| Turkey | |
| Rest of Middle East | |
| Africa | South Africa |
| Egypt | |
| Rest of Africa | |
| South America | Brazil |
| Argentina | |
| Rest of South America |
| By Service Type | Testing | |
| Inspection | ||
| Certification | ||
| By Sourcing Type | In-house | |
| Outsourced | ||
| By Mode of Service Delivery | On-site | |
| Off-site / Laboratory | ||
| Remote / Digital | ||
| By Geography | North America | United States |
| Canada | ||
| Mexico | ||
| Europe | United Kingdom | |
| Germany | ||
| France | ||
| Italy | ||
| Rest of Europe | ||
| Asia-Pacific | China | |
| Japan | ||
| India | ||
| South Korea | ||
| Rest of Asia-Pacific | ||
| Middle East | Israel | |
| Saudi Arabia | ||
| United Arab Emirates | ||
| Turkey | ||
| Rest of Middle East | ||
| Africa | South Africa | |
| Egypt | ||
| Rest of Africa | ||
| South America | Brazil | |
| Argentina | ||
| Rest of South America | ||


Key Questions Answered in the Report
What is the current size of the chemical TIC market?
The chemical TIC market size stands at USD 23.84 billion in 2025 and is projected to reach USD 31.91 billion by 2031.
Which service type dominates spending?
Testing services led the market with 62.23% revenue share in 2025, driven by ultra-trace PFAS analysis and pharmaceutical batch releases.
Why are chemical producers outsourcing more laboratory work?
Mid-tier firms avoid the USD 0.5 million capital cost of LC-MS/MS systems and the recurring burden of accreditation renewals, choosing to partner with specialized TIC providers instead.
How are ESG rules affecting TIC demand?
Mandatory assurance under the EU CSRD and similar U.S. measures is boosting orders for greenhouse-gas verification, life-cycle analysis, and environmental product declarations.
What technologies are reshaping inspection services?
Drone inspections, IoT sensor networks, and cloud-connected LIMS platforms are shortening turnaround times and enabling remote compliance audits.
Which regions will grow fastest through 2031?
Asia-Pacific is set to post the highest CAGR of 5.81% due to massive polyolefin and specialty-chemical capacity additions in China and India.
Page last updated on:


