Automatic Pill Dispenser Market Size and Share
Market Overview
| Study Period | 2020 - 2031 |
|---|---|
| Market Size (2026) | USD 3.71 Billion |
| Market Size (2031) | USD 5.28 Billion |
| Growth Rate (2026 - 2031) | 7.31% CAGR |
| Fastest Growing Market | Asia-Pacific |
| Largest Market | North America |
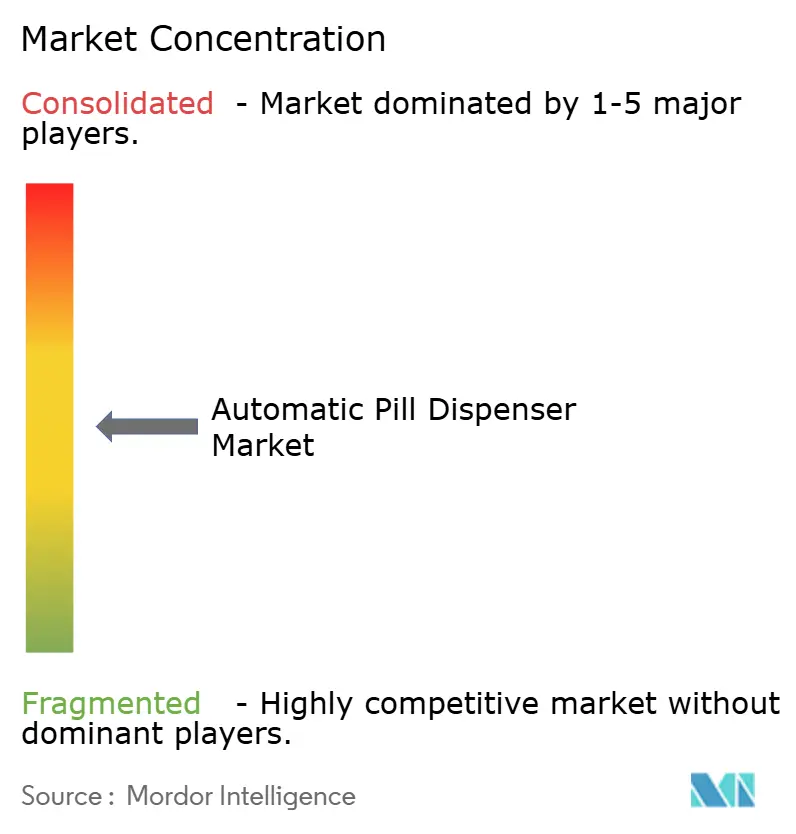
| Market Concentration | Medium |
Major Players *Disclaimer: Major Players sorted in no particular order Image © ���ϲ�����. Reuse requires attribution under CC BY 4.0. | |
Automatic Pill Dispenser Market Analysis by ���ϲ�����
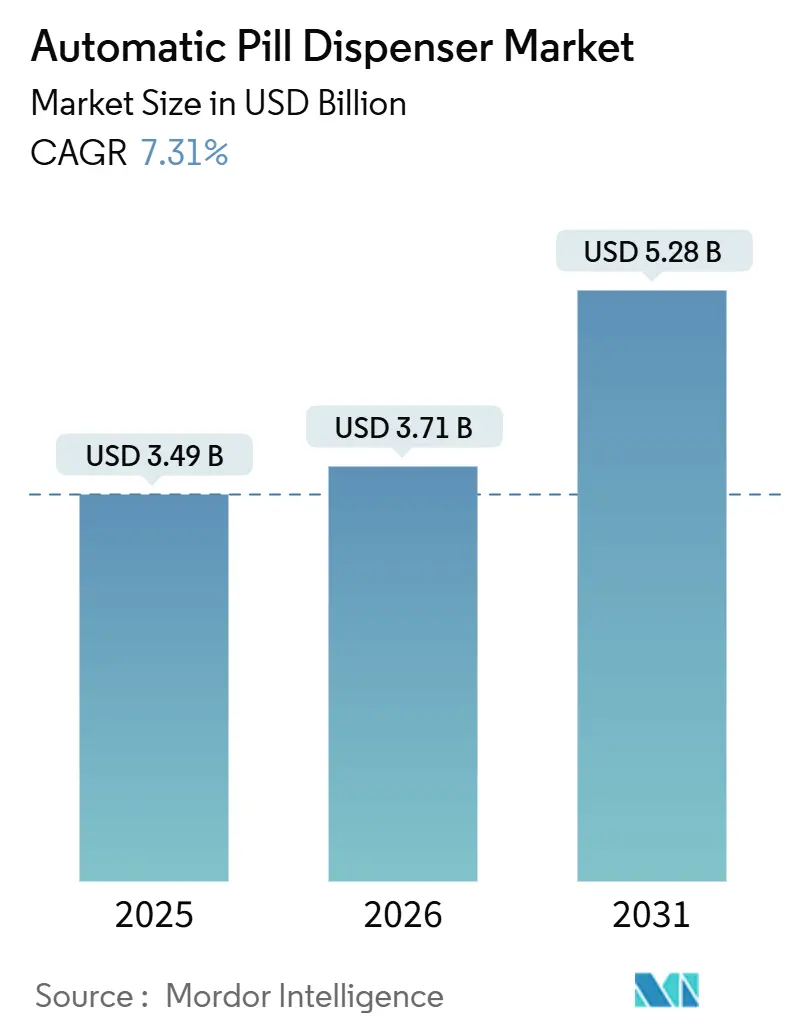
The Automatic Pill Dispenser Market size is expected to increase from USD 3.49 billion in 2025 to USD 3.71 billion in 2026 and reach USD 5.28 billion by 2031, growing at a CAGR of 7.31% over 2026-2031.
Hospital-pharmacy buyers continue to anchor demand because automation mitigates staffing gaps and barcode-verification mandates, yet the commercial spotlight is drifting toward connected devices that support home-based care. Reimbursement for remote monitoring, larger chronic-disease populations, and decentralised clinical-trial protocols are tilting budgets away from ward-level cabinets and toward smart dispensers that collect timestamped adherence data. Suppliers that bundle predictive software with hardware score higher win rates because buyers see faster payback when stock-outs fall and controlled-substance audits shorten. Cyber-hygiene and integration skills now influence vendor short-lists as hospital CIOs insist that new cabinets plug into single-sign-on and zero-trust networks before capital committees approve spend.
Key Report Takeaways
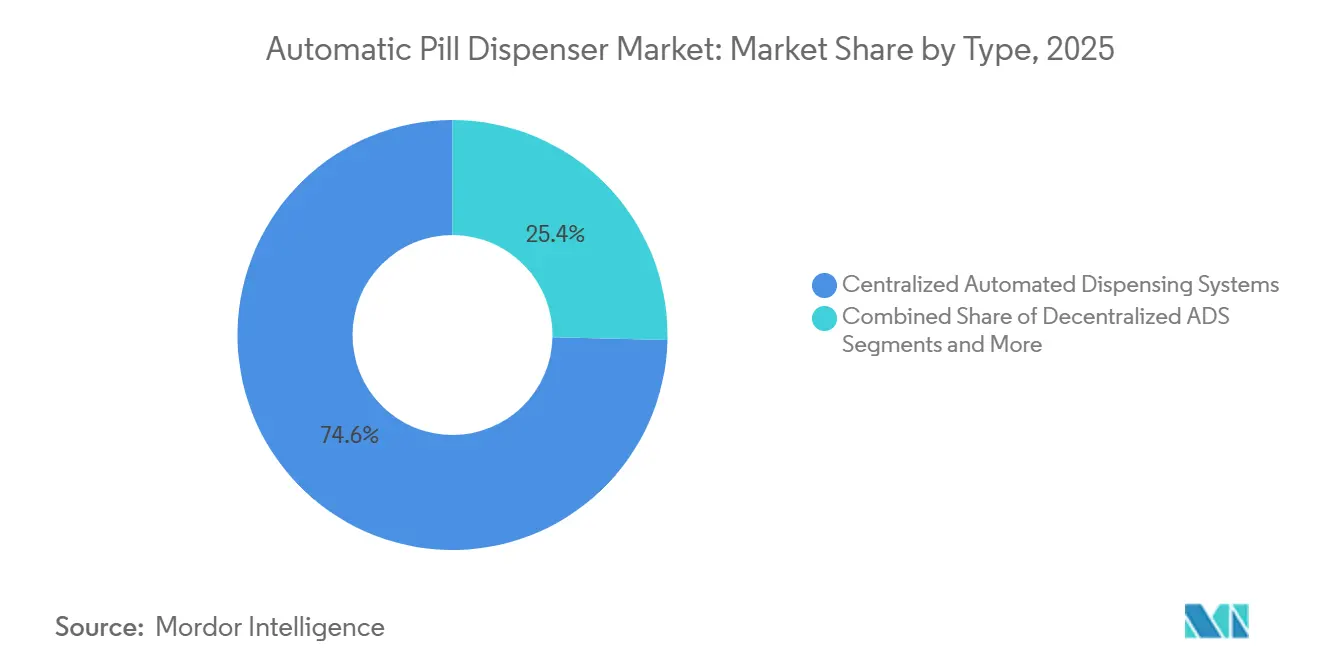
- By type, centralized automated dispensing systems commanded 74.63% of 2025 revenue; smart/IoT-enabled home devices will climb at 11.44% CAGR through 2031.
- By capacity, mid-range units captured 44.13% of 2025 revenue, whereas high-capacity units are forecast to advance at 10.33% CAGR over 2026-2031.
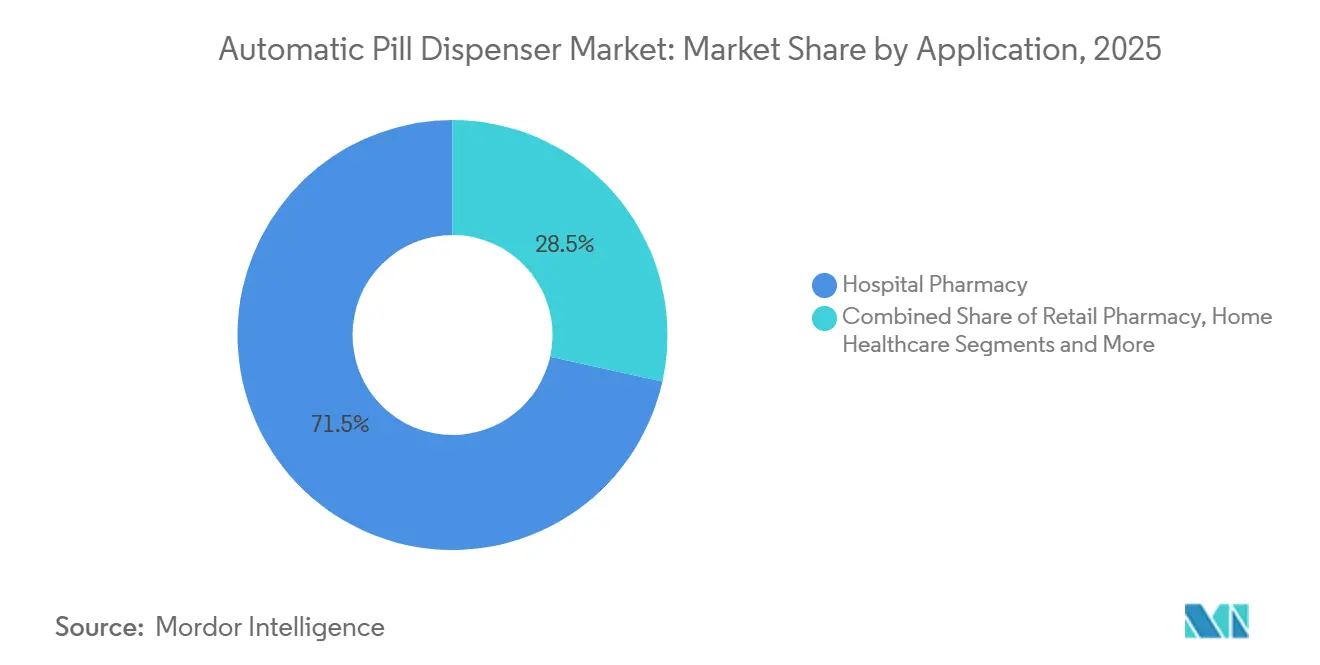
- By application, hospital pharmacies held 71.53% share of the automatic pill dispenser market size in 2025, while home-healthcare demand is rising at an 11.57% CAGR to 2031.
- By technology, electronic-alarm dispensers accounted for 42.24% of 2025 revenue; AI-assisted predictive units are expanding at 11.78% CAGR during the forecast window.
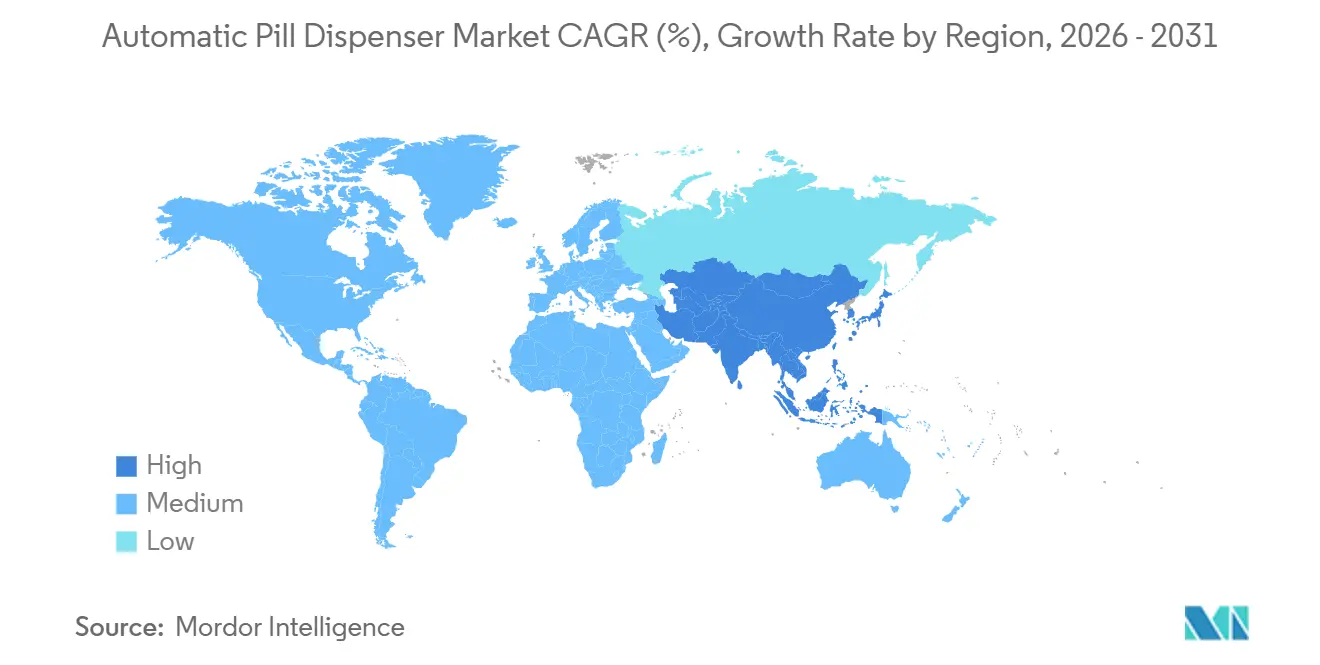
- North America retained 49.62% of 2025 revenue; Asia-Pacific is projected to post the quickest regional climb at 9.24% CAGR between 2026 and 2031.
Note: Market size and forecast figures in this report are generated using ���ϲ�����’s proprietary estimation framework, updated with the latest available data and insights as of January 2026.
Global Automatic Pill Dispenser Market Trends and Insights
Drivers Impact Analysis
| Driver | (~) % Impact on CAGR Forecast | Geographic Relevance | Impact Timeline |
|---|---|---|---|
| Growing Geriatric Population & Chronic Disease Burden | +1.8% | Global, strongest in North America, Europe, aging APAC | Long term (≥ 4 years) |
| Government Initiatives to Curb Medication Errors | +1.5% | North America, EU, expanding APAC | Medium term (2-4 years) |
| Hospital Workforce Shortages Accelerating Pharmacy Automation | +1.3% | Worldwide, acute in North America, Western Europe | Short term (≤ 2 years) |
| Integration of AI/ML Predictive Analytics for Inventory Optimization | +1.1% | North America, EU, tech-forward APAC hubs | Medium term (2-4 years) |
| Rise of Home-Based Clinical Trials Using Connected Dispensers | +0.9% | North America, EU, pilot APAC markets | Medium term (2-4 years) |
| Emergence of Micro-Fulfilment “Store-Within-Store” Pharmacy Hubs | +0.7% | Urban North America, early UK & Germany | Long term (≥ 4 years) |
| Source: ���ϲ����� | |||
Growing Geriatric Population & Chronic Disease Burden
Older adults fill multiple prescriptions and often juggle complex regimens. The United Nations projected the 65-plus cohort will double to 1.6 billion by 2050, creating sustained medication volumes.[1]United Nations, “World Population Ageing 2024,” un.org More than 40% of U.S. seniors already meet polypharmacy thresholds, and each extra drug raises adverse-event odds, prompting hospitals to adopt cabinets that cross-check allergies and duplicate therapies automatically.[2]Nashwa Masnoon, “What Is Polypharmacy? A Systematic Review,” BMC Geriatrics, bmcgeriatr.biomedcentral.com Chronic illnesses such as diabetes and heart failure demand daily adherence; connected dispensers with visual and audio prompts boost on-time dosing and cut readmissions in pilot programmes. Non-communicable diseases represent 74% of global deaths, underscoring why insurers fund adherence technology that keeps patients out of acute care.
Government Initiatives to Curb Medication Errors
Regulators are tightening electronic-tracking rules to reduce preventable harm. The U.S. CMS now withholds quality bonuses if medication-administration records are not linked to dispensing hardware by 2026.[3]Centers for Medicare & Medicaid Services, “Interoperability and Patient Access Rule,” cms.gov Canada’s 2025 sterile-products guideline stresses barcode verification at the bin level, nudging hospitals into centralized systems. Europe’s Falsified Medicines Directive requires serialisation and automated track-and-trace, capabilities built into most high-end cabinets. Australia intends to mandate electronic logs for controlled medicines, effectively making automation compulsory for hospital pharmacies handling Schedule 4 and 8 drugs.
Hospital Workforce Shortages Accelerating Pharmacy Automation
Pharmacist and technician vacancies have widened each year since 2023, pushing chief pharmacy officers to invest in robots rather than compete on wages. In 2025, 73.6% of U.S. hospitals struggled to hire pharmacists, and tech turnover topped 25%. Automated cabinets cut technician hours per patient-day by 18%, freeing staff for clinical consults. Similar shortages in the NHS and Japanese hospitals are fast-tracking procurement programmes that allow overnight unmanned dispensing.
Integration of AI/ML Predictive Analytics for Inventory Optimization
Hospitals shifting from static par levels to algorithmic forecasting report fewer emergency orders and lower waste. Omnicell’s pilots flagged stock-outs down 32%, while BD’s natural-language analytics identify interaction risks before a pharmacist intervenes. Predictive tools harvest admission patterns, surgical schedules, and flu-season data to adjust cabinet refills daily, something manual tally sheets cannot achieve. U.S. ONC notes that interoperable data exchange across facilities enables central pharmacies to ship surplus stock before expiry.
Restraints Impact Analysis
| Restraint | (~) % Impact on CAGR Forecast | Geographic Relevance | Impact Timeline |
|---|---|---|---|
| High Upfront Capital & Maintenance Costs | −0.8% | Global, severe in South America, MEA, rural APAC | Short term (≤ 2 years) |
| Integration Challenges with Legacy EHR/HIS Systems | −0.6% | North America, EU | Medium term (2-4 years) |
| Data-Privacy & Cybersecurity Compliance Burden | −0.5% | Global, strictest in EU & North America | Medium term (2-4 years) |
| Component Shortages amid EV & IoT Boom Pressuring Small Makers | −0.4% | Global supply chain | Short term (≤ 2 years) |
| Source: ���ϲ����� | |||
High Upfront Capital & Maintenance Costs
Total ownership often tops USD 1 million per install with annual service fees of 12-15%. Smaller hospitals see limited labour offsets and defer projects, even though leasing models exist. Maintenance covers software licences and on-site service, adding up to USD 150,000 yearly, a heavy burden for Medicaid-heavy facilities.
Integration Challenges with Legacy EHR/HIS Systems
Only 38% of U.S. hospitals enjoy seamless two-way data flow between cabinets and EHRs. Custom interfaces add six-month delays and can stall projects entirely. A 2025 HIMSS poll ranked interface complexity as the top reason for cancelling automation bids.
Segment Analysis
By Type: Centralised Units Still Rule, Smart Devices Surge
Centralised systems drove 74.63% of revenue in 2025, confirming their entrenched role in compliance workflows that guard controlled substances. Their scale supports tight inventory control and diversion monitoring. Decentralised cabinets on wards reduce nurse walk-time but carry higher stocking cost. The automatic pill dispenser market share for smart/IoT-enabled home devices is small today yet set to rise fastest at 11.44% CAGR thanks to payer support for out-of-hospital chronic care. Robotic pharmacy systems remain niche due to space and capital demands but unlock the deepest labour savings in mega-centres processing thousands of scripts daily.
Adoption patterns hinge on regulatory clarity. FDA’s software-as-medical-device guidance means connected dispensers with dosing advice face 510(k) hurdles that favour incumbents with compliance teams. Vendors that pre-certify integration connectors for major EHRs lower go-live risk and capture cross-sell revenue from analytics modules.
Note: Segment shares of all individual segments available upon report purchase
By Capacity: Mid-Range Leads, High-Volume Growth Quickens
Mid-capacity units captured 44.13% of 2025 spend because they balance throughput with hospital floor-space constraints. Low-capacity drawers serve emergency rooms and clinics with narrow formularies. High-capacity machines will post a 10.33% CAGR as academic centres centralise multi-site distribution. Modular architectures allow staged expansion, avoiding forklift upgrades. Studies show high-capacity cabinets cut retrieval time 42% and free pharmacists for clinical rounds, boosting governance scores that health authorities now audit.
By Application: Hospital Pharmacy Anchors, Home Care Accelerates
Hospital pharmacies retained 71.53% of 2025 demand owing to barcode mandates and the need to secure opioids. Yet home-healthcare is the breakout story, with Medicare’s 2024 remote-monitoring codes covering connected dispensers. Retail adoption lags because independent pharmacies lack scale, but big chains pair robots with telepharmacy desks to raise script volume per staff hour. Long-term care remains underpenetrated; only 22% of U.S. skilled-nursing sites automated by 2024, offering white-space to vendors that can package financing with service.
Note: Segment shares of all individual segments available upon report purchase
By Technology: Electronic Alarms Dominate, AI Systems Gain Pace
Electronic alarm devices supplied 42.24% of revenue in 2025 as they offer a low-cost step-up from mechanical timers. However, AI-assisted dispensers will grow fastest at 11.78% CAGR because accountable-care contracts reward any tech that prevents readmissions. Cloud-connected units create data lakes that health plans mine for population-health insights, increasing bargaining power for vendors that own the data stack. Mechanical devices are on a replacement curve as caregivers demand connectivity and predictive refills.
Automatic Pill Dispenser Industry Geography Analysis
North America held 49.62% revenue in 2025, underpinned by broad cabinet penetration and quality-linked reimbursement. DEA tightened Schedule II inventory rules in 2024, spurring upgrades to systems with diversion analytics. Canada’s provincial tenders cite pharmacist shortages as a driver, and Mexico’s private hospitals automate to lure insured patients.
Europe layers rigorous privacy rules over mature infrastructure. Germany and France fund automation via statutory insurers, while the NHS evaluates bidders on total cost of ownership and integration with e-prescribing. Italy and Spain expand cabinet fleets to counter shortages, though MDR compliance raises vendor costs. Hospitals favour on-premises deployments to keep patient identifiers inside EU borders.
Asia-Pacific will clock the quickest regional CAGR at 9.24%. Japan already exceeds 60% cabinet penetration, and China’s health-modernisation plan funnels capital to provincial hospitals for EHR-integrated robots. India’s private networks automate to secure JCI accreditation, whereas public tenders move slowly. South Korea broadened reimbursement for automated dispensing in 2025, boosting ROI cases. Australia now holds community-pharmacy robots to hospital-grade standards, smoothing vendor marketing.
Middle East & Africa and South America start from smaller bases yet show pockets of acceleration. Gulf states fund smart-hospital builds, and Brazil legalised remote pharmacy oversight, enabling tele-dispensing. Supply-chain volatility and currency swings temper momentum in Argentina and some African markets, but multi-lateral grants for digital health could unlock latent demand.
Competitive Landscape
Market concentration is moderate. Omnicell and BD own the lion’s share of hospital accounts, supported by service contracts that lock customers in for a decade. Automatic pill dispenser market rivals target white spaces: long-term care and connected home devices. Patent filings on computer vision, blockchain audit trails, and AI forecasting hint that differentiation will intensify through 2027. Omnicell’s 2024 patent on shape-and-imprint recognition promises 60% faster verification, while BD embeds cabinet functions directly in leading EHR nursing screens.
Vertical integration is the new moat. Omnicell bought adherence-analytics start-ups to sell hardware-software bundles, and BD partners with EHR majors to cut training cycles. Smaller firms chase niches such as paediatric micro-dosing or offer subscription pricing to lower barriers. Component shortages and interface complexity squeeze mid-tier suppliers, making them acquisition targets for cash-rich incumbents wanting footprint in emerging regions or consumer channels.
Automatic Pill Dispenser Industry Leaders
Omnicell Inc.
Swisslog Healthcare
Capsa Healthcare
Becton Dickinson & Company
Hero Health Inc.
- *Disclaimer: Major Players sorted in no particular order
Recent Industry Developments
- January 2026: Utah’s Office of Artificial Intelligence Policy approved a programme with Doctronic that lets an AI system co-sign prescription renewals via automated dispensers, the first such state-sanctioned model.
- October 2025: Amazon will roll out medication-vending kiosks at One Medical sites, starting in Los Angeles with hundreds of common drugs and expanding nationwide in 2026.
- March 2025: MIT-WPU launched a modular IoT dispenser featuring remote monitoring and user-defined schedules, targeting complex dosing needs.
Research Methodology Framework and Report Scope
Market Definitions and Key Coverage
Our study defines the automatic pill dispenser market as all electronically controlled devices that store, schedule, and release solid-dose medications without manual counting, spanning centralized carousel or robotic benches installed in pharmacies and smaller IoT linked units used at ward level or in home care settings. The valuation tracks new equipment sales and associated embedded software revenues in US dollar terms.
Scope exclusion: after-sales consumables, service contracts, and stand-alone smart pill bottles that lack programmable dispensing are not counted.
Segmentation Overview
- By Type
- Centralized Automated Dispensing Systems
- Decentralized Automated Dispensing Systems
- Smart/IoT-Enabled Home Pill Dispensers
- Robotic Pharmacy Dispensing Systems
- By Capacity Class
- Low‐Capacity (<100 doses)
- Mid-Capacity (100–499 doses)
- High-Capacity (≥500 doses)
- By Application
- Hospital Pharmacy
- Retail Pharmacy
- Home Healthcare
- Long-term Care Facilities
- Other Outpatient Settings
- By Technology
- Mechanical Timed Dispensers
- Electronic Alarm Dispensers
- Connected (Cloud / IoT) Dispensers
- AI-Assisted Predictive Dispensers
- By Geography
- North America
- United States
- Canada
- Mexico
- Europe
- Germany
- France
- United Kingdom
- Italy
- Spain
- Rest of Europe
- Asia-Pacific
- China
- Japan
- India
- South Korea
- Australia
- Rest of Asia-Pacific
- Middle East & Africa
- GCC
- South Africa
- Rest of Middle East & Africa
- South America
- Brazil
- Argentina
- Rest of South America
- North America
Detailed Research Methodology and Data Validation
Primary Research
Mordor analysts spoke with pharmacy directors, biomedical engineers, long-term care administrators, and home care device distributors across North America, Europe, and Asia Pacific. Interviews validated average shift level transaction counts, adoption barriers, and price dispersion, while short surveys with geriatric caregivers refined home use penetration rates.
Desk Research
We gathered baseline volumes and prices from public datasets such as US FDA device registrations, Medicare hospital cost reports, EU Eudamed listings, and Japan's PMDA import filings. We then supplemented them with usage data from trade groups like the American Society of Health-System Pharmacists and the International Pharmaceutical Federation. Company 10-Ks, investor decks, and reputable media articles offered shipment disclosures and ASP hints, which were cross-checked inside D&B Hoovers and Dow Jones Factiva. Additional unit flow clarity came from customs codes HS 847989 and HS 902110 available via Volza. This list is illustrative; many other open sources informed data cleaning and gap fills.
Market-Sizing & Forecasting
A top down model starts with installed pharmacy outlets and hospital beds by country, applies dispenser penetration ratios, and multiplies by weighted average selling prices. Selective bottom up checks roll up shipments disclosed by key manufacturers to keep totals grounded. Variables that move the base include: 1) new prescription volume per capita, 2) geriatric population growth, 3) chronic disease prevalence, 4) average dispenser replacement cycle, and 5) capital budget allocation trends. Multivariate regression links these drivers to historical sales, while an ARIMA overlay captures short run shocks such as pandemic era tele-pharmacy surges. Gaps in supplier data are bridged with region specific ASP imputation before results are re-benchmarked.
Data Validation & Update Cycle
Outputs face three stage peer review, variance checks versus external device shipment tallies, and anomaly flags that trigger re-contact with sources. Reports refresh yearly, with mid-cycle tweaks for material recalls or regulatory shifts; a final analyst pass guarantees clients receive the latest vetted view.
Why Our Automatic Pill Dispenser Baseline Commands Reliability
Published estimates often differ because firms pick unique device lists, pricing ladders, and refresh cadences.
Key gap drivers we observe are divergent inclusion of smart pill boxes, varying assumptions on hospital versus home mix, currency conversion dates, and whether refurbished units are counted.
Benchmark comparison
| Market Size | Anonymized source | Primary gap driver |
|---|---|---|
| 3.64 B (2025) | ���ϲ����� | - |
| 3.10 B (2024) | Regional Consultancy A | Excludes home care IoT units, uses 2021 ASPs |
| 2.90 B (2024) | Trade Journal B | Counts only centralized pharmacy systems, omits Asia Pacific sales |
In summary, by aligning scope with real world purchasing channels, using live ASP checks, and refreshing every twelve months, Mordor delivers a balanced, transparent baseline that decision makers can trace back to clear variables and repeatable steps.
Key Questions Answered in the Report
How fast will connected home dispensers grow between 2026 and 2031?
Smart/IoT home devices are projected to rise at 11.44% CAGR, the quickest pace among product types.
Which application segment will generate the most incremental revenue through 2031?
Home-healthcare use cases will add the most new dollars as payers reimburse remote adherence monitoring.
What is the biggest roadblock for mid-sized hospitals?
Upfront capital plus annual maintenance that can exceed USD 150,000 strains budgets under value-based reimbursement.
Which region offers the highest growth upside for vendors in 2026-2031?
Asia-Pacific leads with a 9.24% CAGR thanks to infrastructure spending in China, India, and South Korea.
How are vendors defending hospital accounts against newcomers?
Incumbents lock customers in with service contracts, proprietary software integrations, and patents on computer-vision verification.
Why does cybersecurity weigh heavily on purchasing decisions?
Hospitals faced 725 large breaches in 2024, so CIOs demand zero-trust architectures and ongoing patch support before authorising buys.


