Market Overview
| Study Period | 2020 - 2031 |
|---|---|
| Forecast Data Period | 2026 - 2031 |
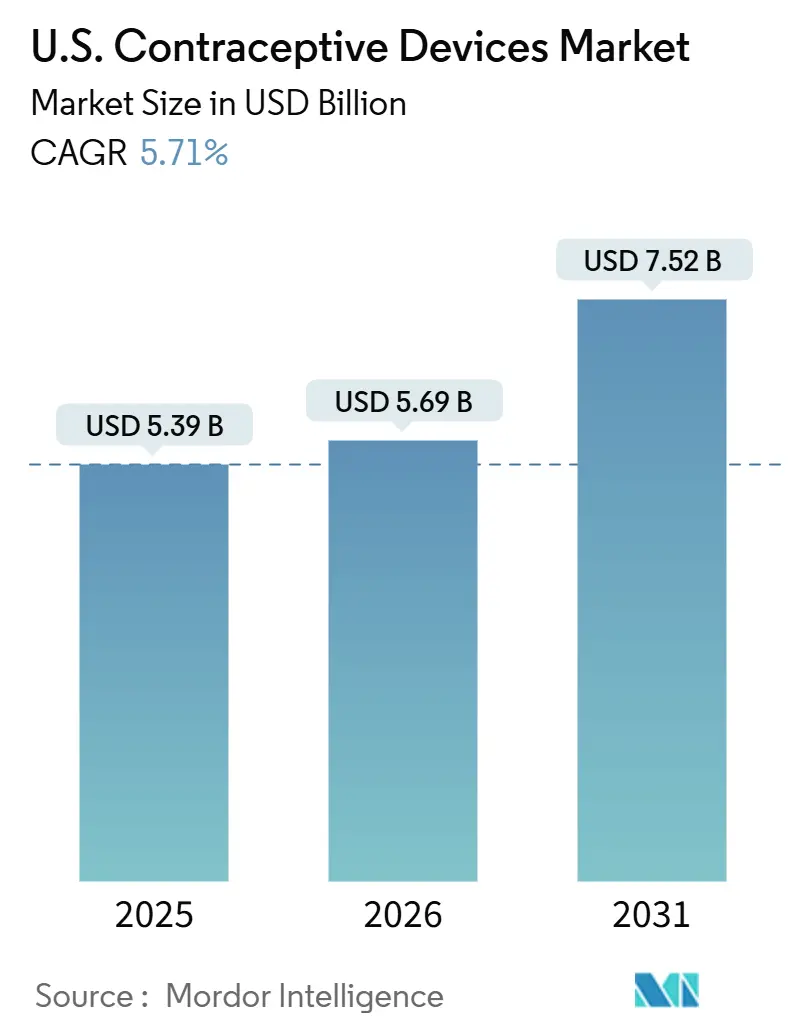
| Base Year Market Size (2025) | USD 5.39 Billion |
| Market Size (2026) | USD 5.69 Billion |
| Market Size (2031) | USD 7.52 Billion |
| Growth Rate (2026 - 2031) | 5.71% CAGR |
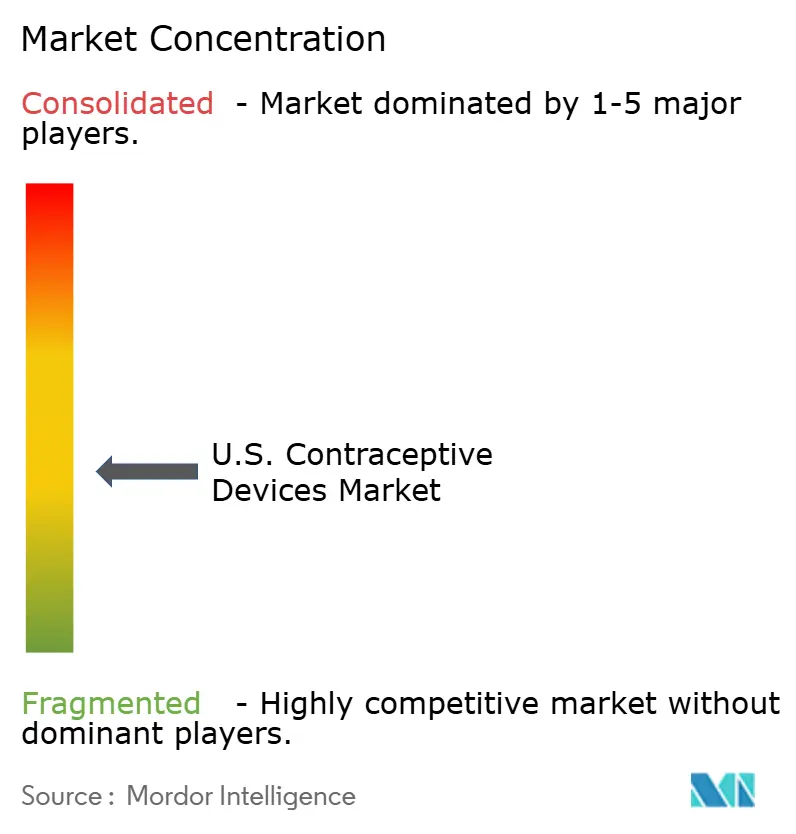
| Market Concentration | Medium |
Major Players *Disclaimer: Major Players sorted in no particular order Image © ���ϲ�����. Reuse requires attribution under CC BY 4.0. | |
U.S. Contraceptive Devices Market Analysis by ���ϲ�����
The U.S. Contraceptive Devices Market size was valued at USD 5.39 billion in 2025 and is estimated to grow from USD 5.69 billion in 2026 to reach USD 7.52 billion by 2031, at a CAGR of 5.71% during the forecast period (2026-2031).
Growth holds steady despite post-Dobbs regulatory turbulence as consumers place higher priority on reproductive autonomy, Medicaid reimbursement expands, and employer-sponsored benefits add momentum. Long-acting reversible contraceptives (LARCs) gain popularity because of superior efficacy and convenience, while direct-to-consumer channels and telehealth streamline access and limit the need for in-person visits. Technology upgrades, such as less-painful IUD insertion tools, address historic barriers to uptake and broaden appeal beyond traditional demographics. Parallel investment in male contraceptive R&D signals an evolving view of shared responsibility, and retail pharmacies solidify their role as pivotal access points even as online platforms post the fastest growth. Ongoing litigation linked to IUD adverse events and cultural pushback in select regions temper, but do not derail, overall demand.
Key Report Takeaways
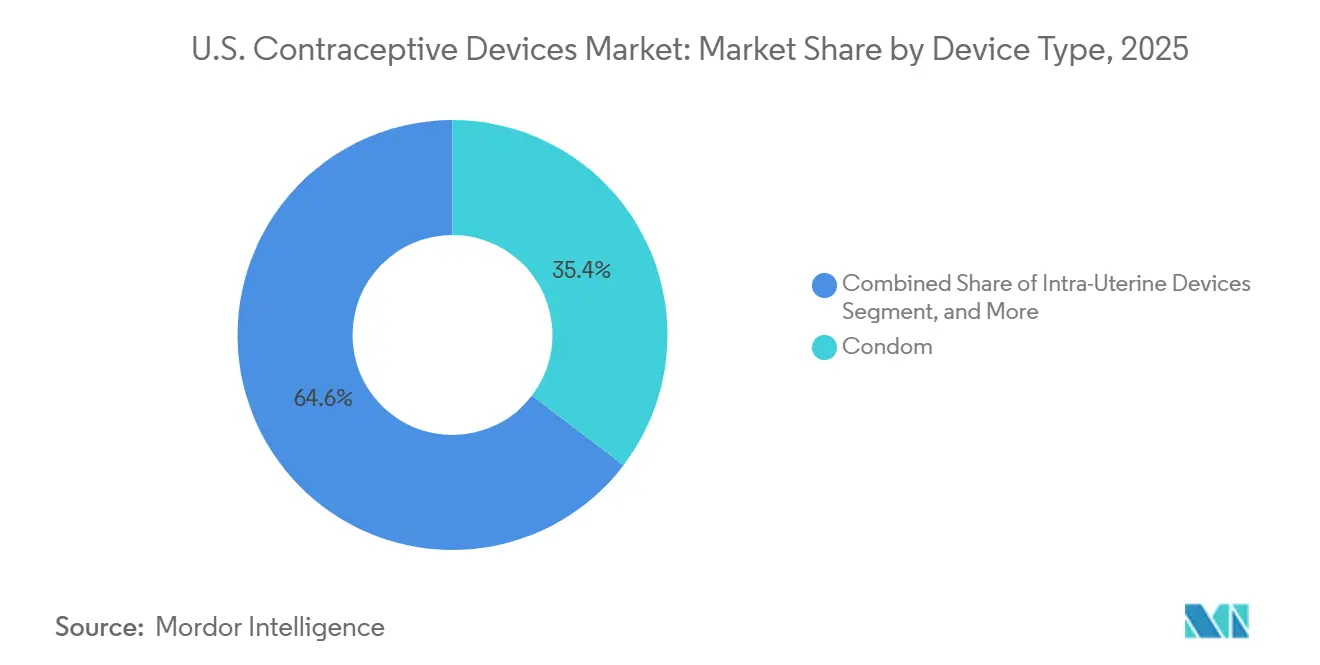
- By device type, condoms led with 35.36% of the United States contraceptive devices market share in 2025; hormonal IUDs are forecast to grow at an 8.43% CAGR through 2031.
- By technology, non-hormonal devices controlled 56.56% of the United States contraceptive devices market size in 2025, while hormonal devices are projected to expand at a 7.98% CAGR to 2031.
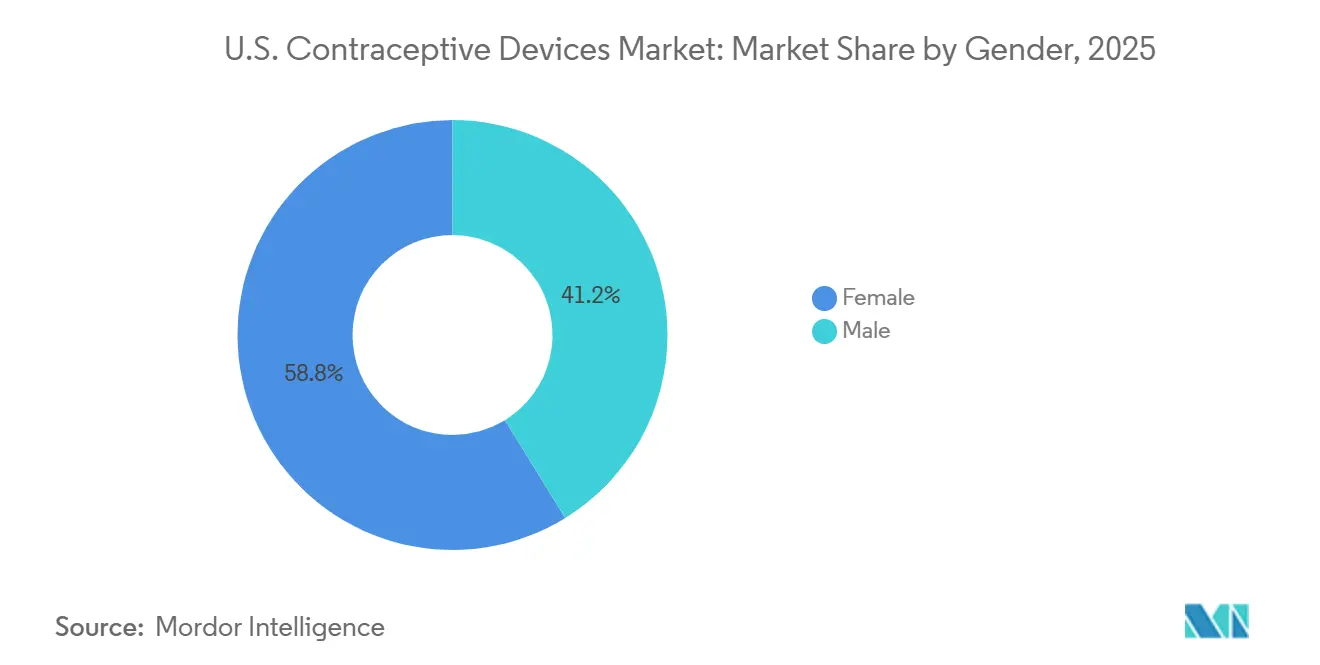
- By gender, female-focused products held 58.58% of the United States contraceptive devices market share in 2025; male contraceptives are set to post a 7.01% CAGR to 2031.
- By end user, home-care and individual users commanded 66.56% of the market in 2025; clinics and community health centers are advancing at a 7.58% CAGR over the same horizon.
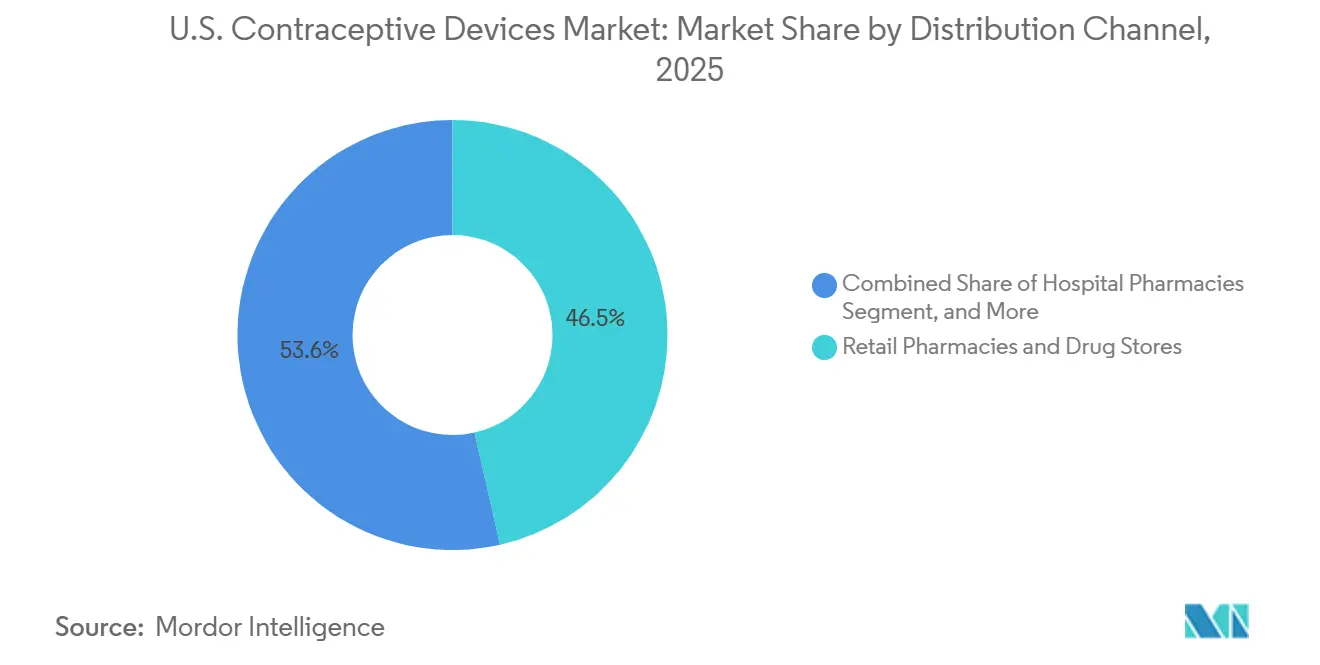
- By distribution channel, retail pharmacies captured 46.45% of the United States contraceptive devices market size in 2025, but online and direct-to-consumer channels will grow the fastest at a 9.12% CAGR to 2031.
Note: Market size and forecast figures in this report are generated using ���ϲ�����’s proprietary estimation framework, updated with the latest available data and insights as of January 2026.
U.S. Contraceptive Devices Market Trends and Insights
Drivers Impact Analysis
| DRIVER | (~) % IMPACT ON CAGR FORECAST | GEOGRAPHIC RELEVANCE | IMPACT TIMELINE |
|---|---|---|---|
| Expansion of Medicaid reimbursement and employer-sponsored benefits | +1.2% | National, strongest in Medicaid-expansion states | Medium term (2–4 years) |
| Accelerating adoption of LARCs | +1.5% | National, highest in urban centers and reproductive-rights states | Short term (≤ 2 years) |
| Technological advances in IUD insertion and delivery | +0.8% | National, early uptake in academic medical centers | Medium term (2–4 years) |
| Direct-to-consumer and telehealth platforms | +1.1% | National, higher in abortion-restrictive states | Short term (≤ 2 years) |
| Teen-pregnancy prevention campaigns | +1.5% | National, concentrated in metropolitan districts | Short term (≤ 2 years) |
| Surge in male contraceptive R&D pipelines | +0.8% | National, spearheaded by university trials | Medium term (2–4 years) |
| Source: ���ϲ����� | |||
Expansion of Medicaid Reimbursement and Employer-Sponsored Benefits
The August 2024 CMS bulletin obliges states to cover family-planning services without cost-sharing, smoothing the path to LARC uptake.[1]Centers for Medicare & Medicaid Services, “Federal Policy Guidance,” medicaid.gov A JAMA Health Forum study linked separate postpartum LARC reimbursement with a 1.58 percentage-point jump in overall LARC use within 60 days after delivery, underscoring how policy shifts remove long-standing cost barriers for underserved groups. Large employers have followed suit; mandates in California, Illinois, and New York now prohibit cost-sharing for all FDA-approved contraceptives, prompting self-funded plans to add high-priced options such as Annovera and Phexxi. Religious exemptions, however, still carve out gaps for employees at faith-based institutions, sustaining patchy coverage in parts of the Midwest and South.
Accelerating Adoption of LARCs
Post-Dobbs demand for longer-term protection pushes more consumers toward IUDs and implants. The Bixby Center reported higher LARC requests, while Tulsa County’s Take Control Initiative distributed 2,855 IUDs and implants in 2024, reflecting heightened awareness of cost-effectiveness and reliability. The Dobbs decision intensified that pivot; a 2024 JAMA study found residents of abortion-ban states were 23% more likely to initiate an IUD or implant within six months of the ruling compared with counterparts in protected-access states.[2]JAMA Network Open, “Telehealth vs In-Person Contraceptive Counseling,” jamanetwork.com
Technological Advances in IUD Insertion and Delivery
Updated CDC guidelines recognize insertion pain as a barrier and promote pain-management best practices, which, combined with device refinements such as Sebela’s flexible MIUDELLA frame, ease apprehension and improve acceptance.[3]CDC, “Selected Practice Recommendations for Contraceptive Use,” cdc.gov
A 2024 randomized trial confirmed that the aspiration technique cut pain scores by 30% compared with legacy insertion approaches. Planned Parenthood integrated lidocaine blocks and misoprostol softening protocols, halving abandonment rates during placement visits.[4]YourChoice Therapeutics, “YCT-529 Non-Hormonal Male Contraceptive,” YourChoice Therapeutics, yourchoicetherapeutics.com Self-insertion feasibility research at UCSF showed promise for remote-guided placement with a simplified prototype, hinting at future models that may bypass clinic visits. Notably, the February 2025 approval of Miudella introduced a slimmer, pre-loaded copper option that reduces procedural complexity for busy outpatient settings.[5]U.S. Food and Drug Administration, “FDA Approves First Copper IUD in Over 40 Years,” FDA, fda.gov
Direct-to-Consumer and Telehealth Platforms
More than half of contraceptive users now prefer remote care, according to a 2024 JAMA Network Open study, pushing investment toward digital counseling and online fulfillment. Telehealth respondents rated counseling quality comparably high, demonstrating parity with in-person visits while cutting travel and scheduling friction.[6]Mary Curtis, “LARC Uptake Surges After Dobbs Ruling,” JAMA Network, jamanetwork.com
By 2025, 80% of publicly supported clinics offered asynchronous contraceptive consultations, enabling blood pressure documentation via home devices and mail-order refills. Commercial platforms such as Nurx and Hims & Hers logged 40% subscription growth in 2024, with the steepest demand curves in states enforcing abortion bans where discreet access is prized.
Restraints Impact Analysis
| RESTRAINT | (~) % IMPACT ON CAGR FORECAST | GEOGRAPHIC RELEVANCE | IMPACT TIMELINE |
|---|---|---|---|
| Regulatory uncertainty post-Dobbs decision | -0.9% | National, acute in ban states | Short term (≤ 2 years) |
| Recalls and litigation linked to IUD adverse events | -0.6% | National, litigation-prone regions | Medium term (2–4 years) |
| Cultural and religious opposition in select demographics | -0.9% | National, pronounced in rural South | Short term (≤ 2 years) |
| Limited insurance coverage for premium devices | -0.6% | National, gaps in small-group plans | Medium term (2–4 years) |
| Source: ���ϲ����� | |||
Regulatory Uncertainty Post-Dobbs Decision
States with full abortion bans saw a 65% plunge in emergency contraceptive fills one year after Dobbs, along with a 25.6% fall in oral contraceptive prescriptions, stoking confusion among providers about legal parameters and hindering timely dispensing. Idaho and Missouri bills sought to block public funds for any method perceived as impairing implantation, prompting clinics to stockpile devices. The proposed Title X spending freeze for 2025 threatened 834,000 low-income patients and forced some centers to reduce hours. Medicaid cuts under discussion in Congress would undermine immediate postpartum LARC gains if implemented.
Recalls and Litigation Linked to IUD Adverse Events
Nearly 2,937 Paragard claims are pending as of February 2025, and Mirena litigation continues, exposing manufacturers to sizable legal costs and reputational hits. Adverse-event reports exceed 53,000 for Paragard, with 22,000 labeled serious, prompting some consumers to delay or avoid IUD adoption. More than 2,700 lawsuits allege that Paragard’s frame may fracture during removal, with internal surveillance noting breakage in up to 1.6% of cases. Though the FDA has not recalled the device, some providers have pivoted to Miudella or hormonal IUDs, eroding CooperSurgical’s position. A separate 2024 safety communication covered rare Nexplanon implant migration events below 0.01% incidence, yet the social-media echo amplified user anxiety. An ACOG-sponsored 2025 survey found 18% of potential IUD adopters cited fear of breakage or migration as a key deterrent.
Segment Analysis
By Device Type – Rapid LARC Upswing
Condoms accounted for 35.36% of contraceptive devices market share in 2025, yet IUDs are forecast to advance at an 8.43% CAGR through 2031, the swiftest clip across categories. LARC efficacy below 1% failure, combined with post-Dobbs risk calculus, is encouraging user migration away from coitally dependent barriers. The contraceptive devices market size tied to vaginal rings, implants, diaphragms, and caps remains modest but stable. Subdermal implants ride Nexplanon’s three-year longevity and single-visit placement, whereas Miudella’s slim inserter targets providers deterred by older copper models. Condom leaders continue to refresh latex alternatives and eco-friendly packaging, but their growth track is becoming defensive as long-term methods capture share.
Diaphragms, caps, and sponges collectively remain below a 2% sliver, constrained by fitting appointments and spermicide pairing requirements. Vaginal rings split into monthly NuvaRing and annual Annovera; the reusable Annovera commands a premium exceeding USD 2,000 annually when uninsured, narrowing its audience to high-income or fully covered groups. On-demand gel barriers such as Phexxi attract hormone-averse users yet face fluctuating reimbursement and 86% perfect-use efficacy that lags IUDs.


By Technology – Hormonal Devices Gather Pace
Non-hormonal products still lead with 56.56% share, but hormonal devices are on track for a 7.98% CAGR through 2031, outstripping their counterparts as extended-duration IUDs and implants lower lifetime cost per year protected. The contraceptive devices market size attributable to hormonal LARCs will expand as Mirena’s eight-year label reduces swap-out visits and as Kyleena and Skyla cater to nulliparous users. Meanwhile, Miudella resets the copper category by shedding insertion complexity. Condoms, the largest non-hormonal bloc, remain vital for STI defense yet increasingly play a supplementary role to LARCs in steady partnerships.
By Gender – Emerging Male Modalities
Female-centered devices continue to dominate with 58.78% share, yet a sizeable 8.1 million women report using non-preferred methods, exposing unmet need. Simultaneously, male interest grows: an Andrology study estimates up to 15.5 million potential male users for new methods, and vasectomies spiked 95% after the Dobbs ruling. Innovations such as Vasalgel hydrogel filtration aim to supply durable, reversible male options, fostering diversification in the United States contraceptive devices market.
By End-User – Clinic Channel Ascends
Home and individual use accounts for 66.56% of overall sales, propelled by Opill’s over-the-counter debut at USD 19.99 per month and policy efforts to waive prescription requirements. Clinics and community health centers, however, register the fastest growth at a 7.58% CAGR, as initiatives like South Carolina’s Choose Well demonstrate that on-site counseling and immediate LARC availability increase uptake.
By Distribution Channel: Digital Platforms Disrupt Traditional Retail
Retail pharmacies held 46.45% share in 2025, buoyed by condom sales and Opill’s OTC debut, yet online portals are sprinting at 9.12% CAGR. The contraceptive devices market increasingly relies on app-based refills, mail delivery, and bundled STI services that deepen user engagement cycles. Proposed counseling mandates in certain states could modestly tilt scripts back to physical stores, but nationwide telehealth coverage parity and relaxed Ryan Haight rules still favor digital channels.
Geography Analysis
Regional disparities remain stark across the United States contraceptive devices market. Southern and Midwestern states record lower prescription and telehealth quality scores compared with coastal peers. Areas enforcing stringent abortion limits witness a 65% fall in emergency contraceptive orders and a 24% drop in pill prescriptions. Conversely, states that legislate coverage parity, such as California’s Contraceptive Equity Act and New Jersey’s pharmacist-dispensing rules, expand access and spur local demand. Programs like Utah’s Family Planning Elevated and California’s policy mandates illustrate how tailored state actions can mitigate access gaps. Nationally, remote consultation options are narrowing geographic inequities by circumventing facility shortages, although broadband penetration and digital literacy still constrain uptake in rural pockets. Variations across the United States mirror the policy patchwork that followed the Dobbs ruling. States that codified reproductive rights, including California, Illinois, New York, and Washington, are expanding LARC programs through publicly funded campaigns and school-based clinics. Colorado and Oregon illustrate best-practice Medicaid rollouts, each posting postpartum LARC uptake above 15% by 2025.
Competitive Landscape
Market concentration is moderate. Bayer leads hormonal IUDs with Mirena, Kyleena, and Skyla. CooperSurgical controls copper IUDs via Paragard but is fighting multidistrict litigation; Miudella’s arrival raises competitive intensity. Church & Dwight governs the condom aisle under Trojan and SKYN branding, yet faces encroachment from sustainability-oriented startups.
Emerging players carve out specialized niches: Femasys secured CE mark for FemBloc non-surgical permanent birth control; Evofem’s Phexxi targets 23.3 million hormone-averse women; NEXT Life Sciences completed trials for Plan A male hydrogel contraception. Digital health firms add competitive pressure by controlling direct relationships with end users and using data insights to tailor product recommendations, eroding the historic dominance of brick-and-mortar channels.
U.S. Contraceptive Devices Industry Leaders
Cooper Surgical Inc
Reckitt Benckiser
Teva Pharmaceutical Industries Ltd
Bayer AG
Church & Dwight Co., Inc. (Trojan)
- *Disclaimer: Major Players sorted in no particular order

Recent Industry Developments
- January 2026: The FDA cleared a supplemental application that expanded Nexplanon's labeling for broader reproductive-age coverage.
- February 2025: Sebela Women’s Health earned FDA approval for MIUDELLA, a flexible copper IUS slated for commercial release in 2025.
- January 2025: 3Daughters raised more than USD 2 million to advance a novel IUD.
- May 2025: Femasys obtained CE certification for FemBloc, a non-surgical permanent birth-control system, and lined up its European launch.
- February 2025: Sebela Women’s Health gained FDA clearance for MIUDELLA, preparing a commercial rollout.
- January 2025: 3Daughters raised USD 2 million to advance a novel frameless IUD prototype.


Research Methodology Framework and Report Scope
Market Definitions and Key Coverage
Our study treats the United States contraceptive devices market as the value generated by every new, FDA-cleared physical product, including condoms, diaphragms, cervical caps, sponges, vaginal rings, sub-dermal implants, and intra-uterine devices, that is sold through medical, retail, or direct-to-consumer channels to prevent pregnancy.
Scope Exclusion: Permanent surgical sterilization, prescription drugs, emergency pills, and fertility-tracking apps are outside this device scope.
Segmentation Overview
- By Device Type
- Condoms
- Intra-Uterine Devices
- Vaginal Rings
- Subdermal Implants
- Diaphragms
- Cervical Caps
- Sponges
- Other Devices (Patches, Gel Barriers)
- By Technology
- Hormonal Devices
- Non-Hormonal Devices
- By Gender
- Male
- Female
- By End-User
- Home-care/Individual Users
- Hospitals
- Clinics & Community Health Centers
- Specialty & Ambulatory Surgery Centers
- By Distribution Channel
- Retail Pharmacies & Drug Stores
- Hospital Pharmacies
- Online & Direct-to-Consumer Platforms
Detailed Research Methodology and Data Validation
Primary Research
Phone and web interviews with OB/GYNs, family-planning nurses, Medicaid purchasing officers, e-pharmacy managers, and device distributors across the Midwest, Northeast, South, and West clarify average selling prices, inventory turns, and emerging user cohorts. Structured questionnaires help us reconcile differing viewpoints on LARC uptake and OTC condom price elasticity.
Desk Research
Mordor's analysts first built a fact base from tier-1 public sources such as CDC National Center for Health Statistics, FDA 510(k) clearances, Title X clinic utilization files, United Nations Demographic Yearbook, and trade data from the U.S. International Trade Commission. Company 10-Ks, investor decks, and patient-level studies in journals like Contraception supplement the view. Subscription datasets, including D&B Hoovers for manufacturer revenues and Questel for patent intensity, provide additional context on competitive breadth.
Monthly search sweeps on Dow Jones Factiva, leading OB/GYN association releases, and Medicaid State Drug Utilization files keep the secondary pool fresh. The sources cited are illustrative; many more inputs were consulted for validation and gap-filling.
Market-Sizing & Forecasting
A top-down reconstruction starts with sexually active female population pools, Title X visit volumes, and device import-export records, which are then multiplied by modeled penetration rates for each device class. Select bottom-up checks, including sample supplier revenue roll-ups and online channel unit sales, anchor assumptions. Key variables include average device life, Medicaid reimbursement ceilings, OTC condom ASP trends, adolescent LARC adoption, and state-level restrictive policy shifts. A multivariate regression with ARIMA overlays projects these drivers through 2030, while expert consensus guides scenario weighting. Gaps in input granularity are bridged by regional ratios derived from validated clinic surveys.
Data Validation & Update Cycle
Outputs face variance checks versus CDC supply metrics and manufacturer earnings. A senior analyst reviews anomalies before sign-off. Reports refresh annually, and any policy shock, such as a federal OTC IUD ruling, triggers an interim update.
Why Mordor's US Contraceptive Devices Baseline Commands Reliability
Published estimates diverge because firms mix drugs with devices, assume different channel mixes, or freeze exchange rates at disparate points.
Key gap drivers include scope creep into oral pills, use of list rather than transaction prices, and longer refresh cycles that miss post-Dobbs demand surges. Our model stays device only, applies weighted ASPs confirmed in interviews, and is updated every twelve months.
Benchmark comparison
| Market Size | Anonymized source | Primary gap driver |
|---|---|---|
| USD 5.39 B (2025) | ���ϲ����� | - |
| USD 9.10 B (2024) | Global Consultancy A | Includes drugs, uses wholesale list prices, yearly refresh |
| USD 5.90 B (2023) | Trade Journal B | Applies straight-line growth, no channel split, older base year |
| USD 3.70 B (2024) | Regional Consultancy C | Excludes online sales and implant ASP inflation |
The comparison shows that once scope alignment, price realism, and timely updates are imposed, Mordor's balanced baseline stands out as the dependable starting point for planners and investors.


Key Questions Answered in the Report
How fast is demand for LARCs growing in the United States?
Intrauterine devices are projected to post an 8.43% CAGR from 2027 to 2031, the fastest growth rate among all device categories.
Which new non-hormonal product recently entered the U.S. market?
Miudella, a copper IUD with a slimmer inserter, gained FDA approval in February 2025 and is the first new copper device in more than four decades.
What policy change is driving clinic-based postpartum insertions?
Forty-six states and the District of Columbia now reimburse immediate postpartum LARC separately from delivery, removing an USD 800 average cost barrier for hospitals.
Are any male contraceptives close to commercialization?
YourChoice Therapeutics non-hormonal pill YCT-529 and Contralines ADAM hydrogel are in early clinical phases and could reach the market toward the late 2020s if trials progress as planned.
How does telehealth influence distribution channels?
Online and direct-to-consumer platforms are advancing at a 9.12% CAGR by leveraging asynchronous consultations, mail delivery, and bundled wellness services.
What is the main litigation risk affecting IUD adoption?
More than 2,700 lawsuits claim Paragard can fracture during removal, prompting some providers to shift to alternate copper or hormonal options.
How Large the United States Contraceptives devices market in 2026?
It reached USD 5.69 billion in 2026 and is on track to reach USD 7.52 billion by 2031.
Page last updated on:


