United States Full Service Restaurants Market Size and Share
Market Overview
| Study Period | 2021 - 2031 |
|---|---|
| Forecast Data Period | 2026 - 2031 |
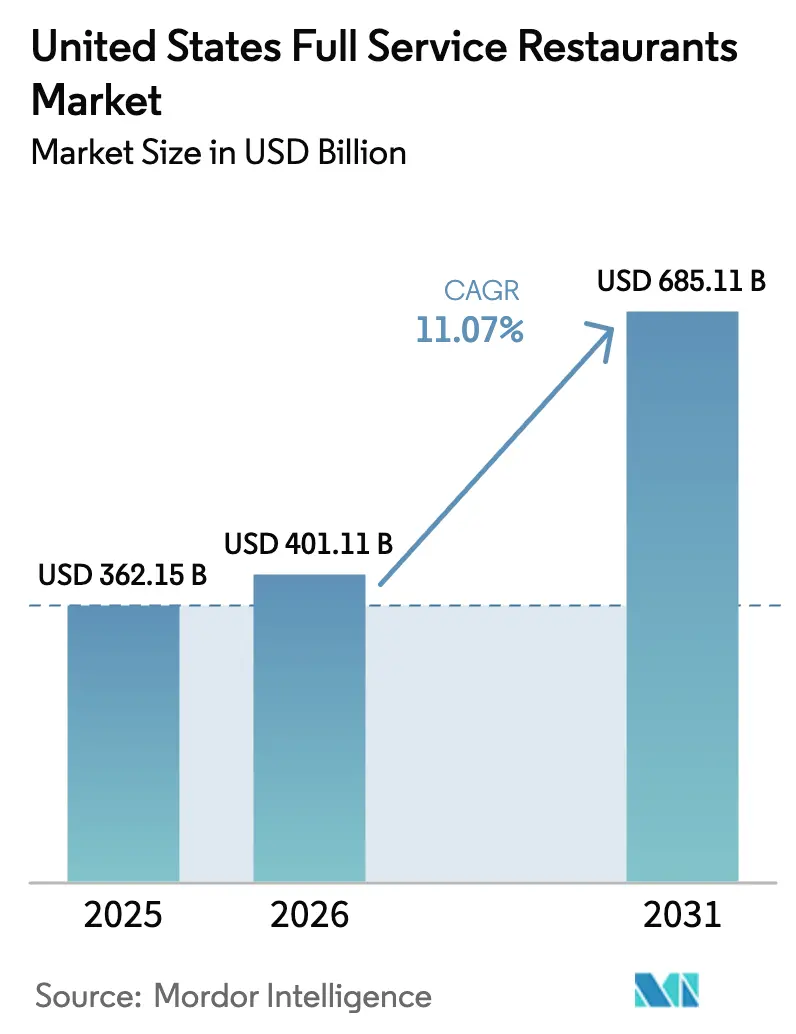
| Base Year Market Size (2025) | USD 362.15 Billion |
| Market Size (2026) | USD 401.11 Billion |
| Market Size (2031) | USD 685.11 Billion |
| Growth Rate (2026 - 2031) | 11.07% CAGR |
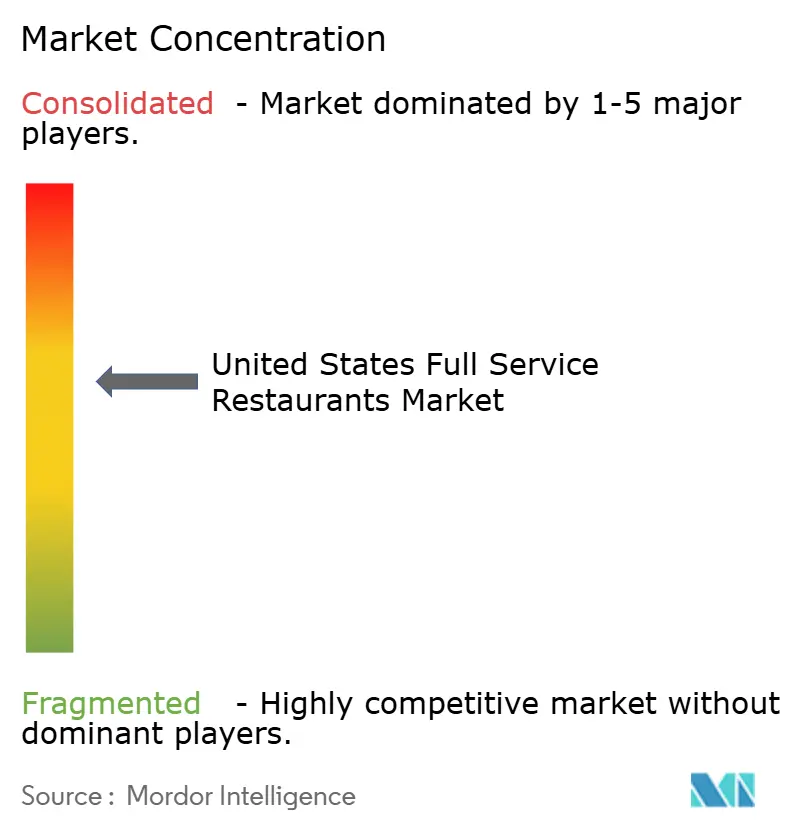
| Market Concentration | Medium |
Major Players*Disclaimer: Major Players sorted in no particular order Image © ���ϲ�����. Reuse requires attribution under CC BY 4.0. |
|
United States Full Service Restaurants Market Analysis by ���ϲ�����
The United States full-service restaurant market size was valued at USD 362.15 billion in 2025 and estimated to grow from USD 405.28 billion in 2026 to reach USD 685.11 billion by 2031, at a CAGR of 11.07% during the forecast period (2026-2031). Pent-up social dining demand, expanding third-party delivery ecosystems, and operator investments in guest data platforms are accelerating revenue recovery. Chained brands are broadening profit pools through ghost kitchens and proprietary loyalty programs, while independents capitalize on authenticity and local sourcing to sustain elevated traffic. Menu innovation that blends health-forward options with comfort classics is widening average checks, and disciplined cost control around food, labor, and technology is lifting store-level margins. The United States full service restaurant market is also benefiting from tourism marketing initiatives that position dining as a core travel experience.
Key Report Takeaways
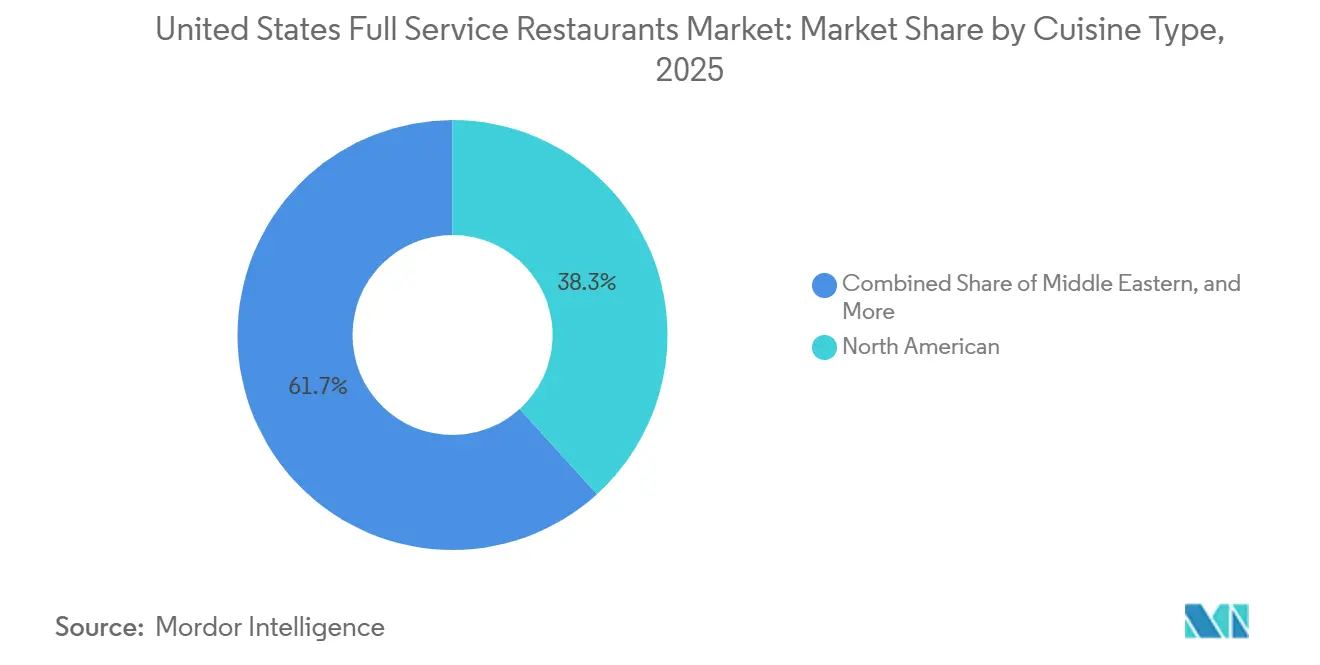
- By cuisine, North American cuisine led with 38.28% revenue share in 2025; Middle Eastern offerings are forecast to expand at a 12.85% CAGR through 2031.
- By outlet, independent operators held 78.62% of the United States full-service restaurant market share in 2025, while chains are poised for the fastest 12.25% CAGR to 2031.
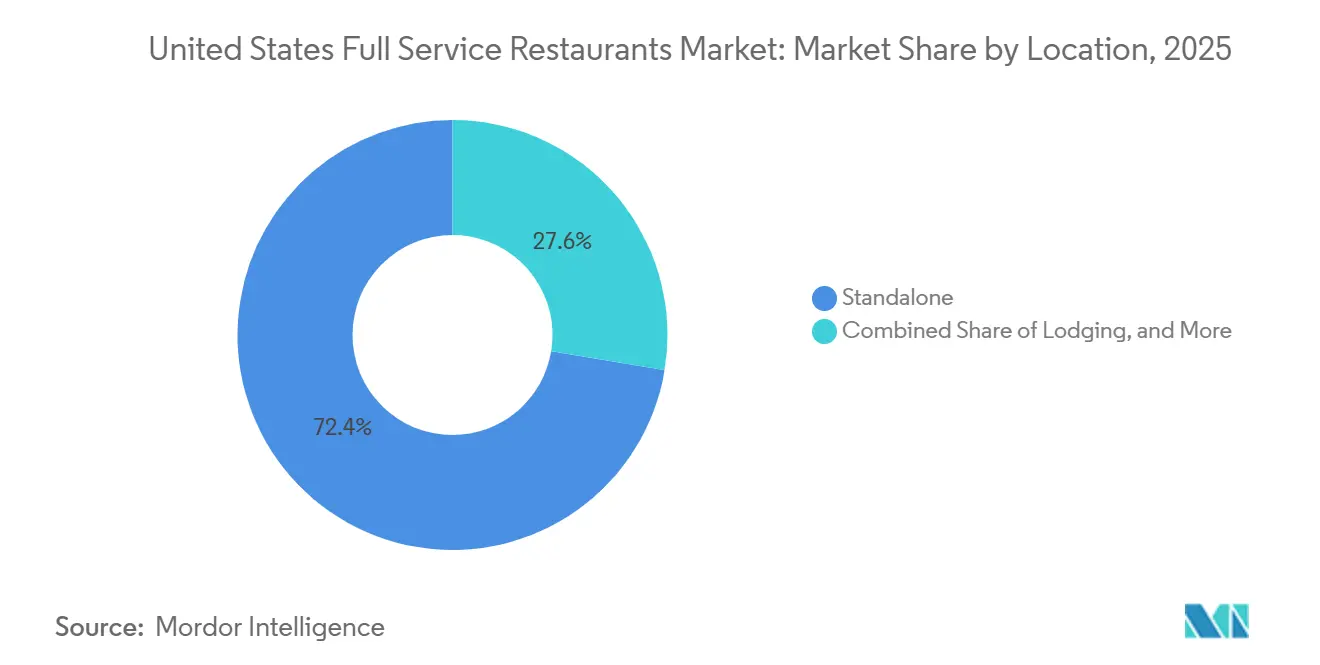
- By location, standalone venues accounted for 72.39% of positioning in 2025; lodging-integrated restaurants are projected to achieve a 15.0212.21
- By service type, dine-in captured 58.22% of sales in 2025, whereas delivery is projected to grow at a 12.38% CAGR through 2031.
Note: Market size and forecast figures in this report are generated using ���ϲ�����’s proprietary estimation framework, updated with the latest available data and insights as of 2026.
United States Full Service Restaurants Market Trends and Insights
Drivers Impact Analysis*
| Driver | (~) % Impact on CAGR Forecast | Geographic Relevance | Impact Timeline |
|---|---|---|---|
| Expansion of Delivery and Online Booking Platforms | +2.1% | National, with concentration in urban metros and suburban clusters | Medium term (2-4 years) |
| Innovation in Menus with Health-Focused Choices | +1.4% | National, with early adoption in coastal markets and college towns | Medium term (2-4 years) |
| Growth via Virtual Kitchen Models | +1.8% | Urban cores and high-density suburbs where real estate costs are prohibitive | Short term (≤ 2 years) |
| Adoption of Loyalty Schemes and Tech-Driven Tools | +1.6% | National, with higher penetration among chained operators | Medium term (2-4 years) |
| Surge in Global Cuisine Preferences | +1.3% | National, with accelerated growth in diverse metropolitan areas | Long term (≥ 4 years) |
| Policy Support for Tourism and Local Dining Ventures | +0.9% | Tourist-dependent regions and gateway cities | Long term (≥ 4 years) |
| Source: ���ϲ����� | |||
Expansion of Delivery and Online Booking Platforms
Third-party aggregators and proprietary delivery networks are reshaping revenue mix by converting incremental occasions that would have defaulted to at-home cooking or quick-service alternatives. Uber Eats expanded its partnership with Instacart in 2024 to offer restaurant meals alongside grocery delivery, reducing customer acquisition costs and increasing order frequency. DoorDash signed a multi-year agreement with Domino's in 2025, marking a strategic pivot as even delivery-native brands recognize the value of aggregator reach. Online reservation platforms like OpenTable and Resy are embedding dynamic pricing and pre-payment options, enabling operators to capture deposits and reduce no-show rates that historically eroded weekend capacity utilization. This infrastructure layer lowers barriers for independents to compete on convenience, yet commission rates averaging 20-30% compress margins and force operators to raise menu prices or absorb the cost as a customer acquisition expense.
Innovation in Menus with Health-Focused Choices
Protein-forward, plant-based, and allergen-conscious menu development is no longer a niche differentiator but a baseline expectation among millennial and Gen Z diners who prioritize nutritional transparency. Sweetgreen introduced grass-fed steak in 2024, blending its plant-centric positioning with animal protein to capture flexitarian demand and lift average check size. Full-service chains are reformulating sauces to reduce sodium and sugar, responding to FDA voluntary sodium reduction targets and consumer backlash against ultra-processed ingredients. This trend intersects with supply-chain complexity: sourcing certified organic, non-GMO, or regeneratively farmed ingredients requires deeper supplier relationships and often higher input costs, yet operators who execute well can command premium pricing and build brand loyalty that insulates them from price-driven competition.
Growth via Virtual Kitchen Models
Ghost kitchens and virtual brands allow operators to test new concepts, expand delivery radius, and amortize fixed costs across multiple revenue streams without incurring front-of-house labor or dining-room real estate expenses. Chipotle opened its first digital-only location in 2024, featuring dedicated pickup shelves and no dine-in seating, targeting urban cores where rent per square foot exceeds USD 100. Bloomin' Brands launched virtual concepts under existing kitchen infrastructure, leveraging brand equity and operational expertise to capture incremental delivery sales with minimal capital outlay. This model is particularly attractive in secondary markets where population density justifies delivery demand but cannot support standalone full-service locations. However, virtual brands face discovery challenges on crowded delivery platforms and lack the experiential differentiation that drives repeat visits in traditional formats.
Policy Support for Tourism and Local Dining Ventures
Federal and state initiatives aimed at revitalizing hospitality sectors post-pandemic include tax credits for restaurant renovations, workforce training grants, and streamlined permitting for outdoor dining expansions. The Restaurant Revitalization Fund, though exhausted in 2024, established a precedent for targeted relief that state governments have replicated through local programs, according to the U.S. Small Business Administration[1]Source: U.S. Small Business Administration, "Restaurant Revitalization Fund." sba.gov. Tourism boards in gateway cities are partnering with restaurant associations to promote culinary tourism, driving incremental visits from domestic and international travelers who prioritize dining experiences. These policies disproportionately benefit full-service operators in tourist-dependent regions, yet they also create competitive pressure as new entrants capitalize on subsidized capital to enter markets previously dominated by incumbents.
Restraint Impact Analysis*
| Restraints | (~) % Impact on CAGR Forecasts | Geographic Relevance | Impact Timeline |
|---|---|---|---|
| Escalating Costs of Food and Ingredients | -1.7% | National, with acute pressure in regions dependent on imported commodities | Short term (≤ 2 years) |
| Heightened Consumer Sensitivity to Prices Amid Economic Volatility | -1.3% | National, with pronounced effects in middle-income and rural markets | Medium term (2-4 years) |
| Hurdles in Brick-and-Mortar Growth from High Real Estate Expenses | -1.0% | Urban cores and high-traffic suburban corridors | Long term (≥ 4 years) |
| Expenses and Complexities in Technology Adoption | -0.8% | National, with disproportionate impact on independents and small chains | Medium term (2-4 years) |
| Source: ���ϲ����� | |||
Escalating Costs of Food and Ingredients
In 2024, food commodity inflation slowed to 2.2%, but it accelerated again to 2.7% in 2025. This resurgence was primarily driven by climate-related disruptions to crop production, geopolitical shocks impacting supply chains, and persistent labor shortages in the agricultural sector, according to the USDA Economic Research Service[2]Source: USDA Economic Research Service, "Food Price Inflation Data." ers.usda.gov. Protein prices have remained unpredictable; beef prices are elevated due to herd liquidation cycles, while poultry supply has been constrained by outbreaks of avian influenza. These factors have placed operators in a challenging position, forcing them to choose between absorbing rising input costs, which compresses profit margins, or increasing prices, which could lead to a decline in customer traffic. To mitigate these pressures, some operators are turning to menu engineering strategies, such as promoting higher-margin items or reducing portion sizes. However, these tactics come with the risk of alienating value-conscious customers who may perceive such changes as deceptive. Larger restaurant chains, on the other hand, are leveraging their scale by utilizing centralized procurement systems and entering into forward contracts to hedge against commodity price volatility. This approach not only helps them manage costs more effectively but also widens the competitive gap with independent operators, who often lack the scale and resources to negotiate favorable terms, leaving them more vulnerable to market fluctuations.
Heightened Consumer Sensitivity to Prices Amid Economic Volatility
Discretionary spending on dining out remains under pressure as households contend with elevated mortgage rates, student loan repayment resumptions, and persistent inflation in non-food categories. Full-service restaurants, which command higher check averages than quick-service and fast-casual alternatives, are particularly vulnerable to trading down as consumers prioritize value over experience. Brinker International's Chili's brand capitalized on this dynamic by promoting value-oriented combo meals and limited-time offers that drove traffic gains, yet this strategy compresses per-guest profitability and risks brand dilution if sustained over multiple quarters. Operators must balance promotional intensity with brand positioning, a calculus that becomes more difficult as economic uncertainty persists and consumers defer celebration occasions that historically drove full-service visits.
*Our updated forecasts treat driver/restraint impacts as directional, not additive. The revised impact forecasts reflect baseline growth, mix effects, and variable interactions.
Segment Analysis
By Cuisine: Middle Eastern Concepts Challenge North American Dominance
In 2025, North American cuisine accounted for 38.28% of the market share, driven by established comfort-food brands and steakhouse concepts that dominate suburban areas. Meanwhile, Middle Eastern cuisine is experiencing growth at a 12.85% CAGR through 2031, as consumers increasingly prefer health-focused ingredients and unique flavor profiles that stand out from traditional American offerings. Cava's IPO in 2024 demonstrated the strong financial performance of Mediterranean fast-casual dining, with average unit volumes exceeding USD 2.5 million and four-wall margins nearing 25%, rivaling those of established full-service chains. European cuisine, including Italian, French, and Spanish formats, continues to hold steady market share through experiential dining and wine-pairing programs that drive higher per-guest spending. Latin American cuisine is expanding beyond Tex-Mex staples, with operators introducing authentic regional dishes such as Peruvian ceviche, Argentine asado, and Brazilian churrasco, appealing to diners seeking genuine culinary experiences.
Asian cuisine, encompassing Chinese, Japanese, Thai, and Vietnamese formats, remains fragmented due to distinct supply-chain needs and specialized labor requirements, which complicate multi-unit scaling. In 2024, P.F. Chang's, a pan-Asian full-service chain, focused on simplifying its menu and partnering with ghost kitchens to streamline operations and increase delivery sales. Other cuisines, such as African, Caribbean, and fusion formats, occupy niche positions but are expanding as demographic changes and cultural curiosity drive interest in underrepresented culinary traditions. This segmentation of cuisines reflects a broader trend: operators delivering authentic, health-conscious, and visually appealing dining experiences are gaining market share from traditional American concepts that rely on portion size and value-driven positioning.
Note: Segment shares of all individual segments available upon report purchase
By Outlet: Chained Operators Leverage Scale Against Independent Flexibility
In 2025, independent outlets accounted for 78.62% of the market share, highlighting the fragmented nature of full-service dining. Local nuances, chef-driven menus, and strong community connections create competitive barriers that national brands find difficult to overcome. However, chained operators are experiencing growth, expanding at a 12.25% CAGR through 2031. They achieve this by utilizing centralized procurement, standardized operations, and technology investments—resources often inaccessible to independents. Darden Restaurants, operating over 1,900 locations across multiple brands, leverages its scale to secure volume discounts from suppliers. This scale also enables them to distribute technology costs across a larger base and reallocate capital from underperforming units to high-growth markets. In 2024, Bloomin' Brands, which owns Outback Steakhouse and Carrabba's Italian Grill, introduced virtual brands using their existing kitchen infrastructure, capturing additional delivery sales without incurring extra real estate costs.
Chained operators benefit from brand recognition and the extensive reach of loyalty programs. These advantages reduce customer acquisition costs and encourage repeat visits through targeted promotions. Conversely, independents differentiate themselves by offering unique experiences, sourcing ingredients locally, and innovating menus that reflect individual chef creativity rather than corporate mandates. The current outlet segmentation indicates a bifurcated future: chains are likely to dominate suburban areas and highway corridors, where real estate dynamics favor multi-unit formats. Meanwhile, independents are expected to thrive in urban centers and affluent neighborhoods, where diners prioritize uniqueness over uniformity. Franchise models provide a hybrid approach, allowing independent operators to leverage brand equity and operational support while maintaining local ownership. However, franchise fees and royalty structures can reduce unit-level profitability.
By Location: Lodging Partnerships Unlock High-Margin Captive Demand
Standalone locations accounted for 72.39% of 2025 revenue, encompassing freestanding buildings and strip-center tenants that rely on drive-by traffic and destination appeal, yet lodging-based restaurants are projected to grow at 12.21% CAGR as hotel operators seek to monetize food and beverage as a profit center rather than a guest amenity. Marriott International expanded its in-house dining concepts in 2024, partnering with celebrity chefs and local restaurateurs to create destination restaurants that attract non-guest traffic and lift per-key revenue. Leisure locations, including theme parks, entertainment districts, and resort complexes, capture incremental spending from captive audiences willing to pay premium prices for convenience and experience. Retail-based restaurants, situated in shopping malls and lifestyle centers, face headwinds as foot traffic declines and landlords prioritize experiential tenants over traditional dining formats.
Travel locations, encompassing airports, train stations, and highway rest stops, benefit from captive demand but contend with high occupancy costs, restrictive operating hours, and labor challenges in transit hubs. Delaware North and SSP Group, which dominate travel dining concessions, are introducing fast-casual and full-service hybrid formats that compress service times while maintaining higher check averages than quick-service alternatives. The location segmentation highlights the importance of site selection and format alignment: operators who match concept positioning with traffic patterns and consumer expectations capture disproportionate returns, while mismatches result in underperforming units that drain capital and management attention.
Note: Segment shares of all individual segments available upon report purchase
By Service Type: Delivery Gains Share as Dine-In Recovers Unevenly
Dine-in service represented 58.22% of 2025 sales, reflecting the experiential core of full-service dining where ambiance, service quality, and social interaction justify premium pricing, yet delivery is expanding at 12.38% CAGR through 2031 as third-party platforms and proprietary logistics networks convert incremental occasions. Takeaway occupies a middle ground, appealing to consumers who prioritize speed and value over experience but prefer to avoid delivery fees and wait times. Darden Restaurants reported that off-premises sales, encompassing delivery and takeaway, accounted for 20% of total revenue in fiscal 2024, up from 12% pre-pandemic, indicating a structural shift in consumer behavior that persists beyond the lockdown-era necessity.
Delivery economics remain challenging: third-party commissions average 20-30%, packaging costs add USD 1-2 per order, and food quality degradation during transit risks brand dilution. Operators are responding by investing in proprietary delivery fleets, negotiating lower commission rates in exchange for exclusivity, and engineering menus specifically for delivery with items that travel well and maintain temperature. Chili's introduced a delivery-optimized menu in 2024, featuring items with shorter cook times and packaging designed to preserve presentation, resulting in higher customer satisfaction scores and repeat order rates.
Geography Analysis
The United States full service restaurant market exhibits regional heterogeneity driven by demographic composition, income levels, tourism flows, and real estate dynamics. Coastal metropolitan areas, including New York, Los Angeles, San Francisco, and Miami, command a disproportionate share due to high population density, affluent households, and cultural diversity that supports premium pricing and ethnic cuisine proliferation. These markets also serve as testing grounds for new concepts and technologies, with operators leveraging early adopter feedback to refine offerings before national rollouts. Sunbelt states, encompassing Texas, Florida, Arizona, and the Carolinas, are experiencing accelerated growth fueled by population migration, favorable business climates, and lower real estate costs that enable new unit development. Texas Roadhouse opened 21 new company-owned locations in fiscal 2024, with a concentration in Sunbelt markets where household formation and discretionary income growth support full-service dining demand.
Midwest and Rust Belt regions face structural headwinds from population stagnation, income pressures, and competition from value-oriented quick-service and fast-casual alternatives. Operators in these markets emphasize portion size, value pricing, and comfort-food positioning to retain share, yet they struggle to command the check averages and table turnover rates achieved in coastal metros. Rural and exurban markets offer lower real estate costs and less competitive intensity, yet they lack the population density to support high unit volumes, forcing operators to accept lower sales productivity in exchange for manageable occupancy expenses. Tourist-dependent markets, including Las Vegas, Orlando, and gateway cities with international visitor flows, benefit from incremental demand that supplements local traffic, yet they remain vulnerable to economic downturns and geopolitical events that disrupt travel patterns.
The geographic segmentation highlights the importance of market selection and format adaptation: operators who tailor menu offerings, pricing strategies, and service models to local preferences and economic conditions capture disproportionate returns, while standardized national rollouts risk underperformance in markets that deviate from corporate assumptions. Regulatory environments also vary by state and municipality, with labor laws, minimum wage requirements, and alcohol licensing creating compliance complexity that favors larger chains with dedicated legal and human resources functions. Food safety standards, overseen by the FDA and state health departments, impose baseline requirements that all operators must meet, yet enforcement intensity and inspection frequency vary by jurisdiction, creating operational risk for multi-state chains.
Competitive Landscape
The United States full-service restaurant market registers moderate concentration, indicating a competitive environment where top-tier chains command pricing power, real estate access, and technology scale, yet fragmented independents retain differentiation advantages through chef-driven menus, hyper-local sourcing, and experiential positioning. Darden Restaurants, the largest full-service operator with over 1,900 locations, leverages its multi-brand portfolio to capture diverse occasions and demographics, from casual family dining at Olive Garden to upscale steakhouse experiences at The Capital Grille. Brinker International's Chili's brand has reversed years of guest-count declines through value-oriented promotions and social-media-driven marketing that resonates with younger diners, illustrating how legacy chains can regain relevance through strategic repositioning.
Emerging disruptors include fast-casual Mediterranean concepts like Cava, which blend full-service quality with quick-service speed and convenience, capturing share from traditional sit-down formats. White-space opportunities exist in underserved ethnic cuisines, experiential formats that blend dining with entertainment, and technology-enabled models that reduce labor intensity without sacrificing service quality. Operators are deploying AI-powered scheduling tools, kitchen automation, and self-service kiosks to compress labor costs while maintaining throughput during peak periods. Cooper's Hawk Winery and Restaurants, which integrates wine production and retail with full-service dining, exemplifies the experiential differentiation that commands premium pricing and drives repeat visits.
Competitive intensity is highest in suburban markets where multiple chains compete for family dining occasions, while urban cores and affluent neighborhoods favor independents with unique positioning. Regulatory compliance, particularly around food safety and labor standards enforced by the FDA and Department of Labor, creates baseline operational requirements that all operators must meet, yet larger chains benefit from dedicated compliance functions that reduce risk exposure. Average hourly earnings for food service workers rose 4.4% year-over-year in 2024, outpacing headline inflation and pressuring labor-intensive full-service models that cannot automate front-of-house roles as quickly as quick-service rivals, according to the Bureau of Labor Statistics[3]Source: Bureau of Labor Statistics, "Food Service Worker Earnings." bls.gov.
United States Full Service Restaurants Industry Leaders
-
Bloomin' Brands Inc.
-
Brinker International Inc.
-
Darden Restaurants Inc.
-
Texas Roadhouse Inc.
-
The Cheesecake Factory Inc.
- *Disclaimer: Major Players sorted in no particular order
Recent Industry Developments
- January 2026: Tim Hortons, the popular Canadian coffee and bake shop chain, opened a New Jersey outlet in a 2,000-square-foot former White Castle building featuring a drive-thru, located in Ocean County.
- January 2026: Starbucks plans to open 600-650 net new cafés globally in 2026, including 150-175 company-operated stores in the U.S. The stores have a 10-seat small-format version, alongside innovations such as artisanal bakery items and expanded matcha offerings.
- May 2025: The Texas Roadhouse brand launched Texas Roadhouse Dairy Dips. The new line, in partnership with West Madison Foods. The products include cactus blossom dip, rattlesnake bites dip, and fried pickle dip.
United States Full Service Restaurants Market Report Scope
Asian, European, Latin American, Middle Eastern, North American are covered as segments by Cuisine. Chained Outlets, Independent Outlets are covered as segments by Outlet. Leisure, Lodging, Retail, Standalone, Travel are covered as segments by Location.| Asian |
| European |
| Latin American |
| Middle Eastern |
| North American |
| Other FSR Cuisines |
| Chaines Outlets |
| Independent Outlets |
| Leisure |
| Lodging |
| Retail |
| Standalone |
| Travel |
| Dine-in |
| Takeaway |
| Delivery |
| Cuisine | Asian |
| European | |
| Latin American | |
| Middle Eastern | |
| North American | |
| Other FSR Cuisines | |
| Outlet | Chaines Outlets |
| Independent Outlets | |
| Location | Leisure |
| Lodging | |
| Retail | |
| Standalone | |
| Travel | |
| Service Type | Dine-in |
| Takeaway | |
| Delivery |
Market Definition
- FULL-SERVICE RESTAURANTS - A foodservice establishment where customers are seated at a table, give their order to a server and are served food at a table.
- QUICK SERVICE RESTAURANTS - A foodservice establishment that provides customers convenience, speed, and food offerings at lower prices. Customers usually help themselves and carry their own food to their tables.
- CAFES & BARS - A type of foodservice business that include bars and pubs that are licensed to serve alcoholic drinks for consumption, cafes that serve refreshments and light food items, as well as specialty tea and coffee shops, dessert bars, smoothie bars, and juice bars.
- CLOUD KITCHEN - A foodservice business that utilizes a commercial kitchen for the purpose of preparing food for delivery or takeout only, with no dine-in customers.
| Keyword | Definition |
|---|---|
| Albacore Tuna | It is one of the smallest species of tuna found in the six distinct stocks known globally in the Atlantic, Pacific, and Indian oceans, as well as the Mediterranean Sea. |
| Angus beef | It is beef derived from a specific breed of cattle indigenous to Scotland. It requires certification from the American Angus Association to receive the "Certified Angus Beef" quality mark. |
| Asian cuisine | It includes full-service offerings in restaurants that serve cuisines from cultures such as Chinese, Indian, Korean, Japanese, Bengali, Southeast Asian, etc. |
| Average Order Value | It is the average value of all orders made by the customers at a foodservice establishment. |
| Bacon | It is salted or smoked meat that comes from the back or sides of a pig. |
| Bars & Pubs | It is a drinking establishment that is licensed to serve alcoholic drinks for consumption on the premises. |
| Black Angus | It is beef derived from a black-hided breed of cows that don't have horns. |
| BRC | British Retail Consortium |
| Burger | It is a sandwich consisting of one or more cooked beef patties, placed inside a sliced bread roll or bun roll. |
| �䲹��é | It is a foodservice establishment serving various refreshments (mainly coffee) and light meals. |
| Cafes & Bars | It is a type of foodservice business that include bars and pubs that are licensed to serve alcoholic drinks for consumption, cafes that serve refreshments and light food items, as well as specialty tea and coffee shops, dessert bars, smoothie bars, and juice bars. |
| Cappuccino | It is an Italian coffee drink that is traditionally prepared with equal parts double espresso, steamed milk, and steamed milk foam. |
| CFIA | Canadian Food Inspection Agency |
| Chained Outlet | It refers to a foodservice establishment that shares brands, operates in several locations, has central management, and standardized business practices. |
| Chicken Tender | It refers to chicken meat prepared from the pectoralis minor muscles of a chicken bird. |
| Cloud Kitchen | It is a foodservice business that utilizes a commercial kitchen for the purpose of preparing food for delivery or takeout only, with no dine-in customers. |
| Cocktail | It is an alcoholic mixed drink made with either a single spirit or a combination of spirits, mixed with other ingredients such as juices, flavored syrups, tonic water, shrubs, and bitters. |
| Edamame | It is a Japanese dish prepared with soybeans (harvested before they ripen or harden) and cooked in its pod. |
| EFSA | European Food Safety Authority |
| ERS | Economic Research Service of the USDA |
| Espresso | It is a concentrated form of coffee, served in shots. |
| European cuisine | It includes full-service offerings in restaurants that serve cuisines from cultures such as Italian, French, German, English, Dutch, Danish, etc. |
| FDA | Food and Drug Administration |
| Fillet Mignon | It is a cut of meat taken from the smaller end of the tenderloin. |
| Flank Steak | It is a cut of beef steak taken from the flank, which lies forward of the rear quarter of a cow. |
| Foodservice | It refers to the part of the food industry which includes businesses, institutions, and companies which prepare meals outside the home. It includes restaurants, school and hospital cafeterias, catering operations, and many other formats. |
| Franks | Also known as frankfurter or Würstchen, it is a type of highly seasoned smoked sausage popular in Austria and Germany. |
| FSANZ | Food Standards Australia New Zealand |
| FSIS | Food Safety and Inspection Service |
| FSSAI | Food Safety and Standards Authority of India |
| Full service restaurant | It refers to a foodservice establishment where customers are seated at a table, give their order to a server, and are served food at a table. |
| Ghost Kitchen | It refers to a cloud kitchen. |
| GLA | Gross Leasable Area |
| Gluten | It is a family of proteins found in grains, including wheat, rye, spelt, and barley. |
| Grain-fed beef | It is beef derived from cattle that have been fed a diet supplemented with soy and corn and other additives. Grain-fed cows can also be given antibiotics and growth hormones to fatten them up more quickly. |
| Grass-fed beef | It is beef derived from cattle that have only been fed grass as feed. |
| Ham | It refers to the pork meat taken from the leg of a pig. |
| HoReCa | Hotels, Restaurants and Cafes |
| Independent Outlet | It refers to a foodservice establishment that operates with a single outlet or is structured as a small chain with no more than three locations. |
| Juice | It is a drink made from the extraction or pressing of the natural liquid contained in fruit and vegetables. |
| Latin American | It includes full-service offerings in restaurants that serve cuisines from cultures such as Mexican, Brazilian, Argentinian, Colombian, etc. |
| Latte | It is a milk-based coffee that is made up of one or two shots of espresso, steamed milk, and a thin layer of frothed milk. |
| Leisure | It refers to foodservice offered as a part of a recreation business, such as sports arenas, zoos, movie theaters, and museums. |
| Lodging | It refers to foodservice offerings at hotels, motels, guesthouses, holiday homes, etc. |
| Macchiato | It is an espresso coffee drink with a small amount of milk, usually foamed. |
| Meat-based cuisines | This inlcudes food items like fried chicken, steak, ribs, etc. where meat is the primary ingredient for the dish. |
| Middle Eastern cuisine | It includes full-service offerings in restaurants that serve cuisines from cultures such as Arabic, Lebanese, Iranian, Israeli, etc. |
| Mocktail | It is an non-alcoholic mixed drink. |
| Mortadella | It is a large Italian sausage or luncheon meat made of finely hashed or ground heat-cured pork, which incorporates at least 15% small cubes of pork fat. |
| North American | It includes full-service offerings in restaurants that serve cuisines from cultures such as American, Canadian, Caribbean, etc. |
| Pastrami | It refers to a highly seasoned smoked beef, typically served in thin slices. |
| PDO | Protected Designation of Origin: It is the name of a geographical region or specific area that is recognized by official rules to produce certain foods with special characteristics related to location. |
| Pepperoni | It is an American variety of spicy salami made from cured meat. |
| Pizza | It is a dish made typically of flattened bread dough spread with a savory mixture usually including tomatoes and cheese and often other toppings and baked. |
| Primal cuts | It refers to the major sections of the carcass. |
| Quick service restaurant | It refers to a foodservice establishment that provides customers convenience, speed, and food offerings at lower prices. Customers usually help themselves and carry their own food to their tables. |
| Retail | It refers to a foodservice outlet inside a mall. shopping complex or a commercial real estate building, where there are other businesses operating as well. |
| Salami | It is a cured sausage consisting of fermented and air-dried meat. |
| Saturated fat | It is a type of fat in which the fatty acid chains have all single bonds. It is generally considered unhealthy. |
| Sausage | It is a meat product made of finely chopped and seasoned meat, which may be fresh, smoked, or pickled and which is then usually stuffed into a casing. |
| Scallop | It is an edible shellfish that is a mollusk with a ribbed shell in two parts. |
| Seitan | It is a plant-based meat substitute made out of wheat gluten. |
| Self-service kiosk | It refers to a self-order point-of-sale (POS) system through which customers place and pay for their own orders at kiosks, enabling totally contactless and frictionless service. |
| Smoothie | It is a beverage made by placing all the ingredients in a container and processing them together, without removing the pulp. |
| Specialty coffee & tea shops | It refers to a foodservice establishment that serves only various types of tea or coffee. |
| Standalone | It refers to a restaurants that have an independent infrastructure setup and not connected to any other business. |
| Sushi | It is a Japanese dish of prepared vinegared rice, usually with some sugar and salt, accompanied by a variety of ingredients, such as seafood—often raw—and vegetables. |
| Travel | It refers to foodservice offerings such as airplane food, dining on long-distance trains, and foodservice on cruise ships. |
| Virtual Kitchen | It refers to a cloud kitchen. |
| Wagyu Beef | It is beef derived from any of four strains of a breed of black or red Japanese cattle that are valued for their highly marbled meat. |
Research Methodology
���ϲ����� follows a four-step methodology in all our reports.
- Step-1: Identify Key Variables: In order to build a robust forecasting methodology, the variables and factors identified in Step 1 are tested against available historical market numbers. Through an iterative process, the variables required for the market forecast are set, and the model is built on the basis of these variables.
- Step-2: Build a Market Model: Market size estimations for the forecast years are in nominal terms. Inflation is considered for average order value, and it is forecasted as per predicted inflation rates in the countries.
- Step-3: Validate and Finalize: In this important step, all market numbers, variables, and analyst calls are validated through an extensive network of primary research experts from the market studied. The respondents are selected across levels and functions to generate a holistic picture of the market studied.
- Step-4: Research Outputs: Syndicated Reports, Custom Consulting Assignments, Databases & Subscription Platforms


