Tuberculosis Diagnostics Market Size and Share
Market Overview
| Study Period | 2020 - 2031 |
|---|---|
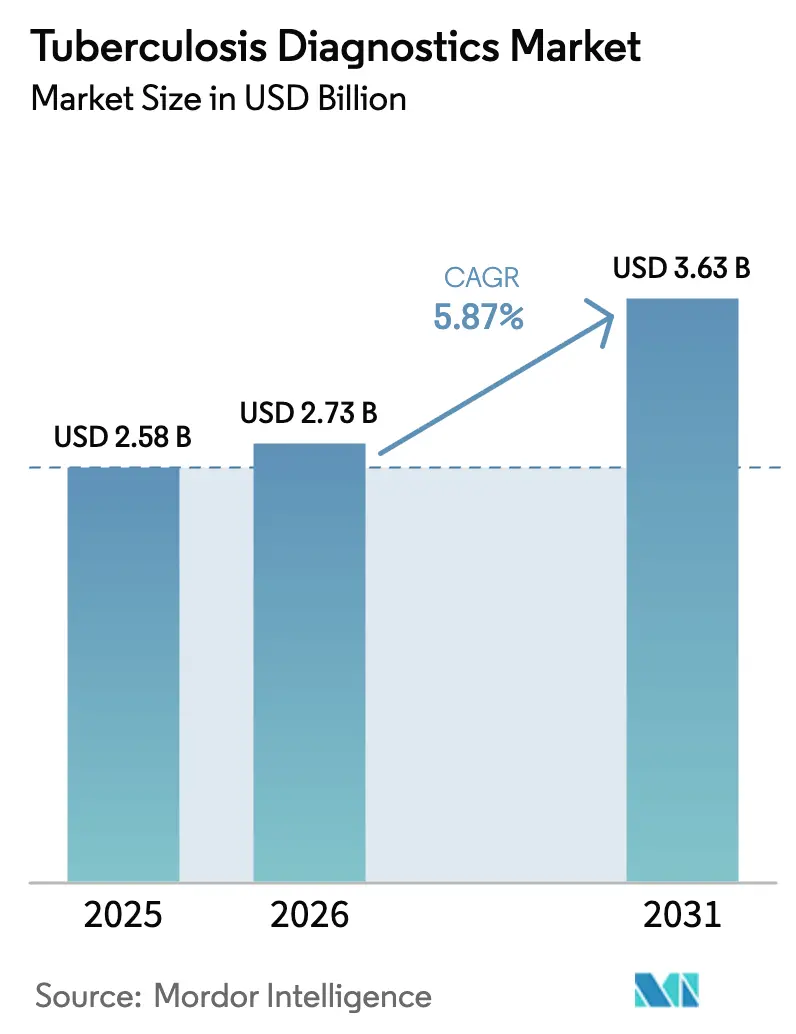
| Market Size (2026) | USD 2.73 Billion |
| Market Size (2031) | USD 3.63 Billion |
| Growth Rate (2026 - 2031) | 5.87% CAGR |
| Fastest Growing Market | Asia Pacific |
| Largest Market | North America |
| Market Concentration | Medium |
Major Players*Disclaimer: Major Players sorted in no particular order Image © ���ϲ�����. Reuse requires attribution under CC BY 4.0. | |
Tuberculosis Diagnostics Market Analysis by ���ϲ�����
The Tuberculosis Diagnostics Market size is expected to increase from USD 2.58 billion in 2025 to USD 2.73 billion in 2026 and reach USD 3.63 billion by 2031, growing at a CAGR of 5.87% over 2026-2031.
Accelerated demand stems from the roughly 4 million tuberculosis cases that go undetected every year and from the December 2024 WHO approval of Xpert MTB/RIF Ultra. This rapid molecular test can confirm infection and drug resistance in a single visit.[1]Source: World Health Organization, “WHO announces first prequalification of a tuberculosis diagnostic test,” who.int Laboratories are abandoning weeks-long culture protocols in favor of nucleic-acid amplification platforms, which have become the centerpiece of most national testing algorithms.[2]Source: World Health Organization, “Consolidated guidelines on tuberculosis diagnosis,” who.int AI-guided digital microscopy and portable point-of-care assays, such as Tulane University’s lab-in-tube device that returns results in under an hour at a cost below USD 3, are widening access in community clinics and mobile units. Asia-Pacific is on track for the quickest expansion as high-burden countries shift from smear microscopy to molecular testing. At the same time, North America maintains the largest revenue base due to its entrenched laboratory infrastructure. Competitive intensity stays moderate: Cepheid alone has installed more than 20,000 GeneXpert systems in high-burden nations, yet cartridge supply constraints and a multibillion-dollar funding gap flagged by U.S. public-health agencies threaten to slow broader scale-up of Cepheid.
Key Report Takeaways
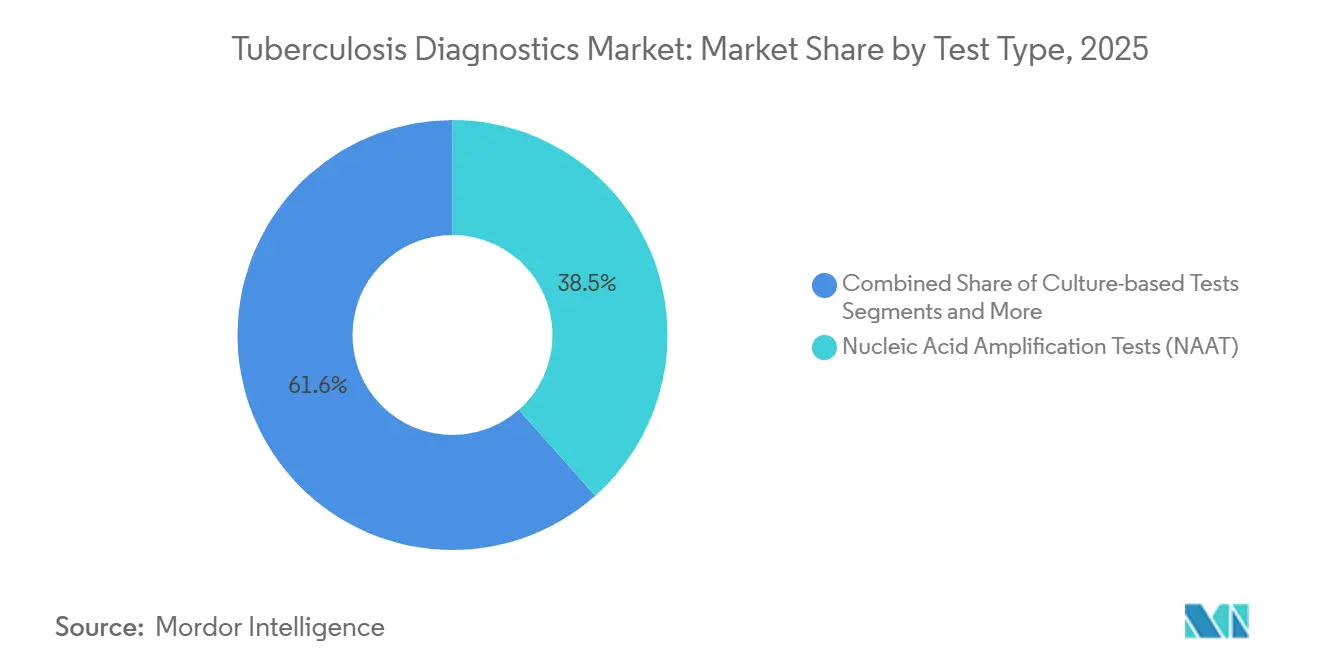
- By test type, nucleic acid amplification tests captured 38.45% of the tuberculosis diagnostics market share in 2025, while culture methods are predicted to lead growth at a 6.54% CAGR to 2031.
- By technology, molecular diagnostics commanded 45.23% share of the tuberculosis diagnostics market size in 2025, while AI-enhanced digital microscopy is projected to expand at a 7.15% CAGR through 2031.
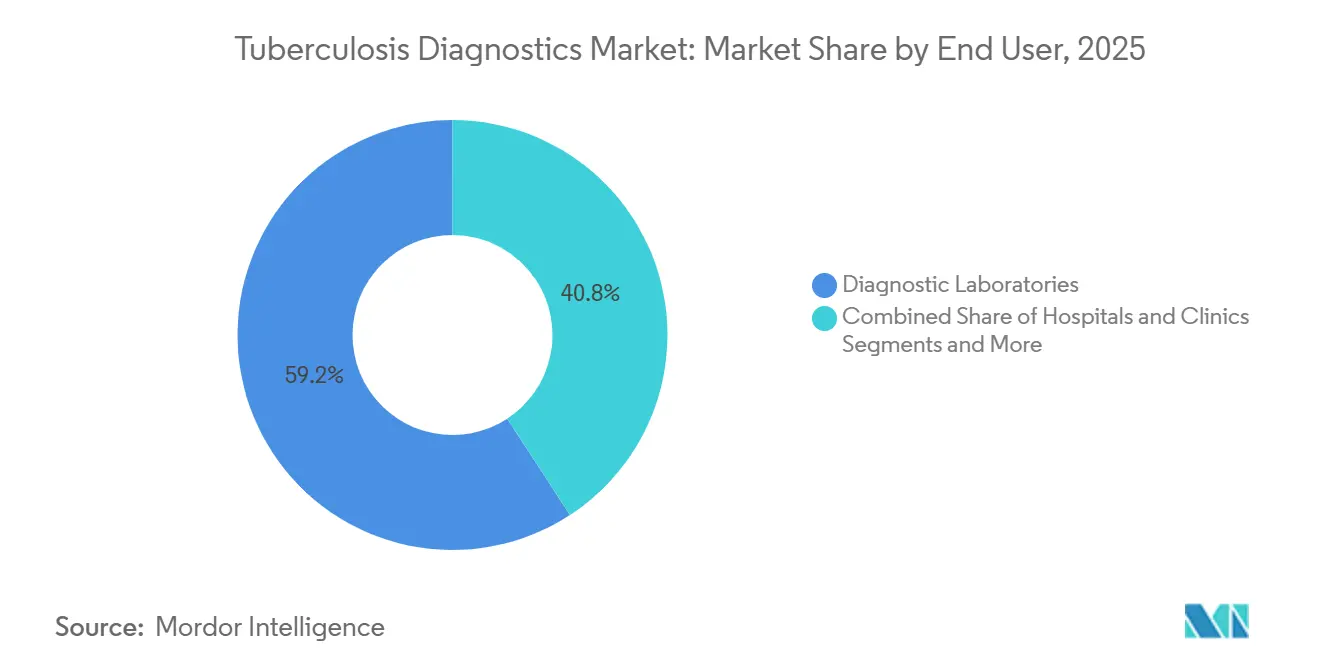
- By end user, diagnostic laboratories accounted for 59.20% of the tuberculosis diagnostics market in 2025, whereas hospitals and clinics are advancing at a 6.67% CAGR through 2031.
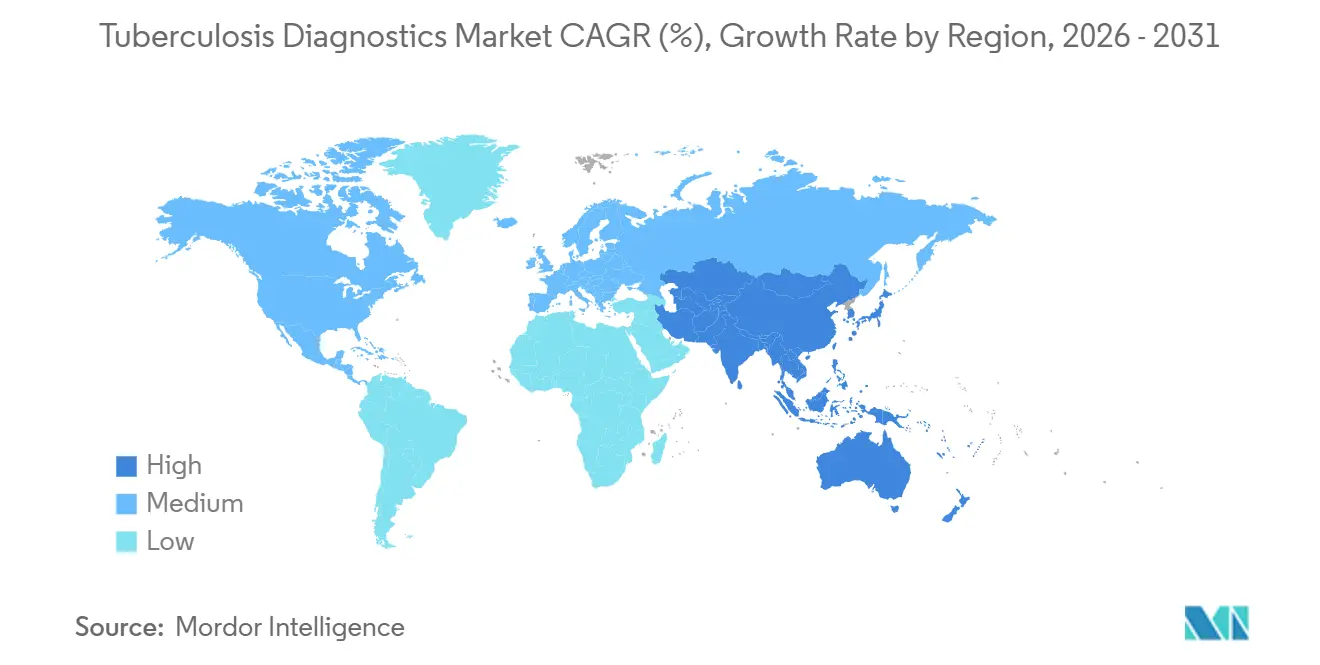
- By geography, North America accounted for 39.10% of the tuberculosis diagnostics market in 2025, whereas Asia-Pacific is expected to register the fastest CAGR of 6.75% over the same horizon.
Note: Market size and forecast figures in this report are generated using ���ϲ�����’s proprietary estimation framework, updated with the latest available data and insights as of January 2026.
Global Tuberculosis Diagnostics Market Trends and Insights
Drivers Impact Analysis
| DRIVER | (~) % IMPACT ON CAGR FORECAST | GEOGRAPHIC RELEVANCE | IMPACT TIMELINE |
|---|---|---|---|
| Rising prevalence of drug-resistant TB strains | +1.2% | Global, concentrated in India, China, South Africa, Philippines | Medium term (2-4 years) |
| Who endorsement & national roll-outs of NAAT platforms | +1.5% | High-burden countries in Asia-Pacific, Sub-Saharan Africa, Eastern Europe | Short term (≤ 2 years) |
| Government funding & global health initiatives | +0.9% | Asia-Pacific, Middle East and Africa, select South America markets | Medium term (2-4 years) |
| Emergence of AI-powered microscopy & digital radiology triage | +0.8% | Asia-Pacific, Sub-Saharan Africa, with pilot adoption in North America | Long term (≥ 4 years) |
| Decentralised near-POC molecular platforms | +1.1% | Rural and peri-urban areas in India, Indonesia, Nigeria, Kenya | Medium term (2-4 years) |
| Subscription-based diagnostics-as-a-service models | +0.4% | North America, Europe, urban centers in Asia-Pacific | Short term (≤ 2 years) |
| Source: ���ϲ����� | |||
Rising Prevalence of Drug-Resistant TB Strains
Multidrug-resistant tuberculosis cases climbed to an estimated 410,000 globally in 2025, with rifampicin-resistant strains accounting for 3.6% of new cases and 18% of previously treated cases, according to WHO surveillance data. This epidemiological shift is forcing national programs to pivot from empirical treatment to genotypic drug-susceptibility testing, which requires molecular assays capable of detecting mutations in rpoB, katG, and inhA genes within 2 hours. This technical bar only cartridge-based NAAT platforms currently meet at scale. Germany’s 5.7% multidrug-resistant incidence and Côte d’Ivoire’s 22% rifampicin resistance among retreatment cases show how resistance patterns differ by geography. Xpert MTB/XDR delivers actionable drug profiles in 90 minutes, while Abbott’s RealTime MTB RIF/INH assay achieves 94.8% sensitivity for rifampicin and 88.3% for isoniazid, letting clinicians tailor therapy promptly. Nations are also piloting targeted next-generation sequencing to comprehensively map resistance, moving diagnostic workflows from culture-dependent to molecular-first approaches.
WHO Endorsement & National Roll-Outs of NAAT Platforms
WHO’s March 2024 guideline update placed molecular rapid tests at the front of all diagnostic algorithms and introduced targeted sequencing advice for drug-resistant surveillance WHO.[3]World Health Organization, “Global Tuberculosis Report 2025,” WHO.INT India’s Initiative for Promoting Affordable and Quality TB Tests boosted Xpert uptake tenfold and cut prices by up to 50%, scaling from 56 to 211 labs in five years. Uganda: by decentralizing NAATs to district hospitals, shortened the median time to treatment initiation and increased same-day confirmations, NEJM. WHO prequalification is the de facto gatekeeper for Global Fund, USAID, and UNITAID financing; Cepheid’s Ultra assay and Eiken’s TB-LAMP together triggered USD 340 million of commitments in 1Q 2025. India’s NTEP scaled molecular capacity nationwide, while the Philippines achieved a 1,008% surge in case detection during a Truenat pilot on the Bantayan Islands, where battery-powered devices bypass erratic grid supply. The policy cascade shortens technology diffusion cycles to fewer than 24 months across Asia-Pacific, a timeline once witnessed only in high-income markets.
Emergence of AI-Powered Microscopy & Digital Radiology
A 12-country study revealed that computer-vision algorithms achieved 89% sensitivity and 97% specificity on Ziehl-Neelsen smears for USD 0.30 per test, compared to USD 10 for NAAT cartridges.[4]Nature Medicine, “AI-Enhanced Microscopy for Tuberculosis Detection: A 12-Country Validation Study,” NATURE.COM Ministries are now implementing AI microscopy as a triage layer, with flagged positive cases proceeding to confirmatory NAAT testing and negative cases exiting the process. This strategy has reduced overall molecular testing volume by 40% without compromising diagnostic yield. In 2025, Delft Imaging processed 2.3 million chest X-rays, identifying 87,000 presumptive cases that would have been missed through symptom-based screening. However, the algorithm's sensitivity drops to 72% among HIV-coinfected patients, leading to delays in regulatory approvals in South Africa and Kenya.
Decentralized Near-POC Molecular Platforms
In 2025, Molbio's Truenat, a battery-operated PCR system, secured 3,400 orders across Nigeria, Kenya, and Papua New Guinea, effectively eliminating the USD 1.20 cold-chain surcharge in rural clinics. Cepheid's Omni prototype optimized the user process by reducing steps from seven to two, resulting in a 60% decrease in error rates during trials conducted in Indonesia and Mozambique. A study published in PLOS Medicine reported an incremental cost-effectiveness of USD 280 per DALY averted when devices are located within 10 kilometers of communities, a figure well below WHO's established thresholds.
Restraints Impact Analysis
| RESTRAINT | (~) % IMPACT ON CAGR FORECAST | GEOGRAPHIC RELEVANCE | IMPACT TIMELINE |
|---|---|---|---|
| High cost of molecular tests & cartridges | -0.9% | Low-income countries in Sub-Saharan Africa, South Asia, parts of South America | Short term (≤ 2 years) |
| Shortage of skilled laboratory infrastructure | -0.7% | Rural areas in Asia-Pacific, Sub-Saharan Africa, remote regions in South America | Medium term (2-4 years) |
| Supply-chain fragility for single-source cartridges | -0.5% | Global, acute in markets dependent on single-supplier procurement | Short term (≤ 2 years) |
| Competition from emerging non-sputum biomarkers | -0.3% | Research-intensive markets in North America, Europe, select Asia-Pacific hubs | Long term (≥ 4 years) |
| Source: ���ϲ����� | |||
High Cost of Molecular Tests & Cartridges
Traditional desktop platforms can exceed USD 19,000, whereas Tulane’s lab-in-tube device costs under USD 800 and keeps per-test pricing below USD 3. Economic analyses in Brazil and India showed Diaskintest at USD 22.6 and USD 41.0 per correct case, while TSPOT.TB delivered greater effectiveness at incremental costs of USD 55-74. Cepheid’s cost-price cartridge offer narrows the gap, yet a sustainable reimbursement model remains critical for widespread adoption.
Shortage of Skilled Laboratory Infrastructure
A proficiency survey in Ethiopia revealed only 81.92% competency in smear microscopy, with performance tied to refresher training and years of experience. Sub-Saharan facilities reported 66% Xpert coverage but just 4% Line Probe Assay uptake owing to funding and workforce limitations, BMJ Global Health. WHO’s laboratory manual emphasizes quality-assured capacity building, while the CDC’s Tuberculosis Education and Training Network and the Curry International Tuberculosis Center provide ongoing webinars and hands-on coaching. Nigeria’s public-private model showed that training, along with instrument redistribution, produced a 28-fold increase in suspected referrals.
Segment Analysis
By Test Type: Culture Methods Regain Momentum
In 2025, culture-based assays accounted for 38.45% of the revenue, with projections indicating a 6.54% annual growth rate. This increase is driven by WHO guidelines requiring phenotypic confirmation for all rifampicin-resistant cases. While NAAT remains the leading method for primary screening, laboratories are increasingly integrating rapid genotyping with subsequent culture testing. This dual-track workflow enables quick therapy initiation through molecular methods, while culture testing provides detailed insights to optimize treatment regimens.
Continued donor funding sustains the cost-effectiveness of smear microscopy at USD 2 per slide, particularly in regions conducting high volumes of Ziehl-Neelsen tests, such as India. However, as digital microscopy and AI algorithms achieve sensitivity levels comparable to NAAT at significantly lower reagent costs, traditional smear microscopy is gradually being relegated to peripheral triage applications.


By Technology: AI Microscopy Emerges as Fastest-Growing Modality
In 2025, molecular diagnostics accounted for 45.23% of revenue. However, AI-enhanced microscopy is witnessing the fastest growth rate among modalities, increasing at 7.15% annually. This growth is driven by the adoption of computer-vision software that repurposes existing optical systems. Additionally, immunoassays, particularly interferon-gamma release assays (IGRAs), play a critical role in screening latent infections within immigration and transplant groups across Europe and North America. This niche market is expected to grow at an annual rate of 4.2%, supported by stricter occupational mandates.
Culture technology remains indispensable for resistance phenotyping. When integrated with automated MGIT systems, automation has reduced turnaround times from 42 days to as few as 14 days. Consequently, the tuberculosis diagnostics industry is transitioning toward integrated algorithms that utilize AI microscopy for triage, confirm diagnoses with NAAT, and finalize therapy plans using culture profiles.
By End User: Hospital Uptake Narrows Lab Dominance
In 2025, diagnostic laboratories accounted for 59.20% of the revenue. However, hospitals and clinics are projected to grow at a CAGR of 6.67% through 2031. This growth is driven by benchtop NAAT modules that reduce turnaround times to under two hours. Additionally, subscription models that bundle instruments, maintenance, and software into per-test fees are lowering upfront spending barriers. This approach is enabling smaller secondary hospitals to enter the tuberculosis diagnostics market.
Although academic centers and research institutes contribute less than 5% of sales, they are at the forefront of developing host-response transcriptomic tests that could advance diagnosis beyond traditional sputum methods. In 2025, a study demonstrated 83% sensitivity for a whole-blood gene-signature assay tested on 2,400 patients. This development highlights a pathway for non-sputum detection at the community level.
Geography Analysis
North America accounted for 39.10% of the tuberculosis diagnostics market in 2025, aided by comprehensive insurance coverage and consistent CDC laboratory upgrades. Asia-Pacific is forecast to expand at a 6.75% CAGR, driven by India’s one-third share of the global burden and policy shifts from smear microscopy to NAAT. Europe posted 38,993 cases across 29 EU/EEA nations in 2024; Ukrainian refugee screening recorded 12.8 per 100,000 incidence with 26% multidrug resistance, prompting intensified entry screening. South America benefits from national Xpert scale-up; Brazil’s rollout increased notifications by 9.7% and catalyzed multisector coordination. The Middle East and Africa see uneven progress: while Nigeria’s AI-linked vans record 1.75 times higher positivity in hotspots, only 4% of labs can run Line Probe Assays. Diaskintest is cheaper than tuberculin in Brazil and India, but TSPOT.TB delivers higher accuracy at added expense, underscoring divergent procurement choices

Competitive Landscape
The tuberculosis diagnostics market remains moderately concentrated. Cepheid sustains leadership by placing more than 20,000 GeneXpert units and selling cartridges at cost in 145 eligible nations. Roche stepped up through its 2024 acquisition of LumiraDx point-of-care technology and a Gates Foundation partnership to co-develop rapid TB tests. Siemens Healthineers is using AI to differentiate, exemplified by its Global Fund collaboration that embeds algorithmic chest X-ray triage in Indonesian clinics. Abbott competes with RealTime MTB-RIF/INH and has filed for expanded WHO endorsements.
Smaller entrants address affordability gaps: Tulane’s USD 3 assay targets rural outreach. Oxford Nanopore is field-testing a sequencing-based resistance panel designed for 30-minute readouts. Start-ups are piloting subscription bundles that wrap reagent costs into per-test fees, easing up-front capital barriers for small clinics. Public-private projects such as Nigeria’s 28-fold surge in referrals illustrate how distribution partnerships and training packages can quickly expand market access. Yet regulatory complexity and stringent clinical evidence expectations still favor large incumbents with global QA systems.
Tuberculosis Diagnostics Industry Leaders
Abbott Laboratories
Becton, Dickinson and Company
BioMérieux SA
Thermo Fisher Scientific Inc.
F. Hoffmann-La Roche Ltd.
- *Disclaimer: Major Players sorted in no particular order

Recent Industry Developments
- February 2026: CoSara Diagnostics obtained CDSCO approval to manufacture and market the CoSara PCR Pro point-of-care platform within India.
- February 2026: Lupin, in partnership with Mumbai's municipal corporation, launched a door-to-door active case-finding campaign covering all 24 wards of the city.
- February 2026: OptraSCAN introduced BactoSiA, an AI-powered smear microscopy tool designed for monitoring treatment follow-ups.
- November 2025: Molbio Diagnostics was awarded the 2024 Kochon Prize by the Stop TB Partnership and Kochon Foundation, recognizing its Truenat technology for its contribution to scaling rapid molecular testing.
- November 2025: Co-Diagnostics executives presented strategies for the adoption of their tuberculosis NAAT test at The Union World Conference on Lung Health.
- April 2025: Revvity received FDA clearance for the Auto-Pure 2400 liquid handler integrated with the T-SPOT.TB IGRA, enhancing latent tuberculosis screening throughput in United States laboratories.


Research Methodology Framework and Report Scope
Market Definitions and Key Coverage
���ϲ����� defines the tuberculosis diagnostics market as all in-vitro procedures, culture based, smear microscopy, nucleic-acid amplification, interferon-gamma release, radiographic and emerging AI-enhanced image readers used to detect latent or active human Mycobacterium tuberculosis infection across laboratory and point-of-care settings worldwide. The valuation reflects test consumables and instrument revenues booked at manufacturer level before channel mark-ups.
Scope exclusion: veterinary (bovine) tuberculosis tests and anti-TB therapeutics are outside this study.
Segmentation Overview
- By Test Type
- Culture-based Tests
- Smear Microscopy
- Nucleic Acid Amplification Tests (NAAT)
- Interferon-Gamma Release Assays (IGRA)
- Tuberculin Skin Test (Mantoux)
- Radiographic & Imaging Tests
- Other Tests
- By Technology
- Culture-based
- Molecular Diagnostics
- Immunoassays
- Radiology / X-ray
- AI-enhanced Digital Microscopy
- Others
- By End-User
- Hospitals & Clinics
- Diagnostic Laboratories
- Academic & Research Institutes
- Others
- By Geography
- North America
- United States
- Canada
- Mexico
- Europe
- Germany
- United Kingdom
- France
- Italy
- Spain
- Rest of Europe
- Asia-Pacific
- China
- India
- Japan
- Australia
- South Korea
- Rest of Asia-Pacific
- Middle East and Africa
- GCC
- South Africa
- Rest of Middle East and Africa
- South America
- Brazil
- Argentina
- Rest of South America
- North America
Detailed Research Methodology and Data Validation
Primary Research
We interviewed hospital microbiologists, national program managers, procurement officers and diagnostics distributors across Africa, South-East Asia, North America and Europe. Conversations and structured surveys confirmed lab capacity utilization, IGRA reimbursement shifts, GeneXpert installed base growth and median test pricing, enabling us to verify desk-based assumptions and surface regional nuance before final triangulation.
Desk Research
Our analysts first assembled a fact base from open, high-credibility sources such as the WHO Global TB Report, the CDC's TB surveillance tables, the Global Health Observatory, World Bank health-expenditure series and regional bodies like the ECDC. Trade data from UN Comtrade and Volza helped validate reagent shipment trends, while Questel patent analytics and D&B Hoovers company filings clarified pipeline intensity and pricing windows. Press releases, peer-reviewed journals and investor presentations filled technology and cost benchmarks.
These materials created historical volume, price and incidence series against which later primary insights were cross-checked. The list above is illustrative; many additional public and subscription assets were tapped to complete the desk review.
Market-Sizing & Forecasting
A top-down construct starts with notified TB incidence, under-diagnosis factors and screening coverage to derive total tests performed, which are then multiplied by blended average selling prices. Parallel bottom-up cross-checks, selected supplier roll-ups and sample ASP × volume audits helped align totals. Key model variables include annual TB incidence, multidrug-resistant share, IGRA penetration, NAAT instrument fleet, public health screening budgets and currency movements. Five-year projections were generated through a multivariate regression that relates test adoption to incidence, laboratory expansion and funding outlook, with scenario spreads vetted by interviewed experts. Data gaps, such as private-clinic test leakage, were bridged through ratio estimates sourced from urban pilot surveys.
Data Validation & Update Cycle
Outputs pass variance checks against independent incidence curves and reagent import trends, followed by multi-analyst peer review. Models refresh every twelve months, with interim revisions triggered by guideline changes, major funding shifts or significant product approvals. A final sanity pass is completed just before report release.
Why Mordor's Tuberculosis Diagnostics Baseline Is Trusted
Published estimates vary because firms choose unlike test menus, incidence multipliers and refresh cadences. Understanding these levers helps users judge which number best fits a decision need.
Key gap drivers include divergent inclusion of smear microscopy, differing stances on latent screening volumes, alternative ASP escalation paths and the frequency with which models are rebuilt when WHO or CDC data are revised.
Benchmark comparison
| Market Size | Anonymized source | Primary gap driver |
|---|---|---|
| USD 2.58 B (2024) | ���ϲ����� | - |
| USD 2.28 B (2024) | Global Consultancy A | Limited test menu, excludes smear microscopy volumes |
| USD 2.28 B (2024) | Regional Consultancy B | Combines human and veterinary revenues, inflating base |
| USD 2.61 B (2024) | Industry Journal C | Omits informal private-lab testing, biennial refresh |
The comparison shows that when scope, variables and yearly update discipline are harmonized, Mordor's figure sits mid-range yet is fully traceable, offering decision-makers a balanced, dependable baseline.


Key Questions Answered in the Report
What is the projected global value of the tuberculosis diagnostics market in 2031?
The market is forecast to reach USD 3.63 billion by 2031.
Which region is growing fastest for tuberculosis testing solutions?
Asia-Pacific leads with a 6.75% CAGR through 2031 owing to large-scale molecular rollouts in India, Indonesia and the Philippines.
Why are culture methods still expanding when molecular tests are popular?
Phenotypic culture remains the gold standard for confirming resistance to new drugs, and WHO guidelines now mandate culture checks for all rifampicin-resistant cases, boosting demand.
How are subscription models changing hospital purchasing behavior?
Diagnostics-as-a-service shifts costs from capital expenditure to per-test fees, enabling smaller hospitals to install onsite NAAT modules without USD 68,000 up-front payments.
What role does AI play in lowering diagnostic costs?
AI-enhanced digital microscopy achieves near-NAAT sensitivity at USD 0.30 per test and reduces overall molecular volume by triaging smear-positive samples.
Which companies dominate the molecular cartridge segment today?
Cepheid and Roche collectively account for about 60% of the installed molecular cartridge base worldwide.
Page last updated on:


