Specialty Medical Chairs Market Size and Share
Market Overview
| Study Period | 2020 - 2031 |
|---|---|
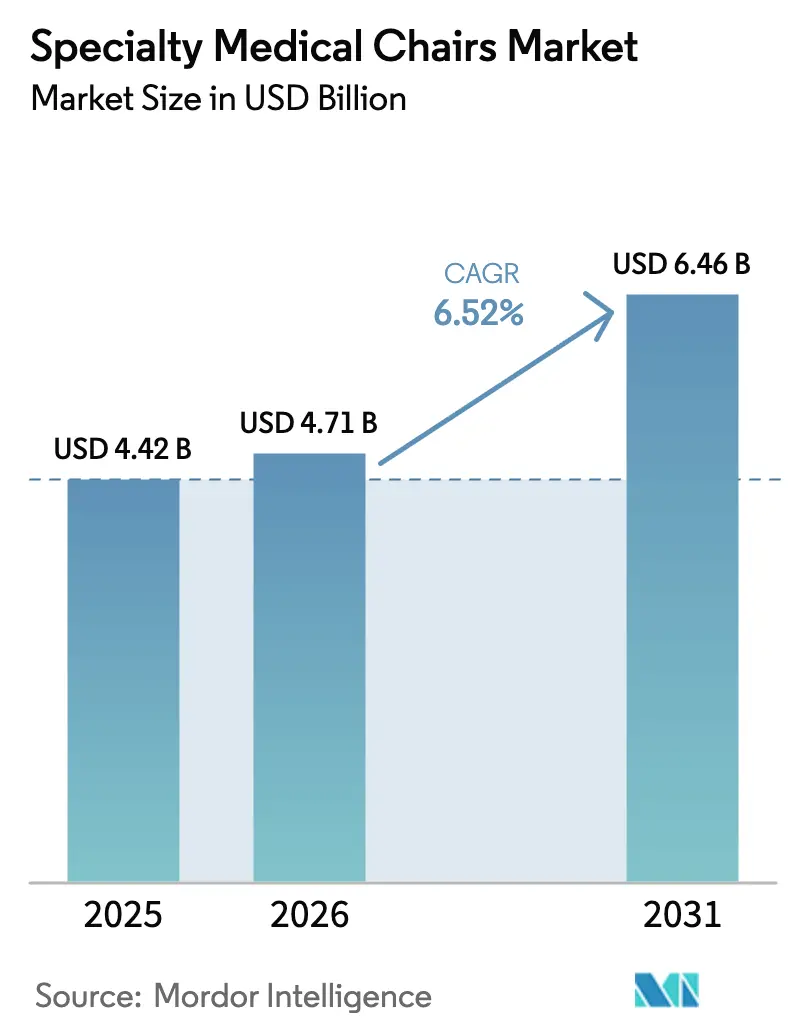
| Market Size (2026) | USD 4.71 Billion |
| Market Size (2031) | USD 6.46 Billion |
| Growth Rate (2026 - 2031) | 6.52% CAGR |
| Fastest Growing Market | Asia Pacific |
| Largest Market | North America |
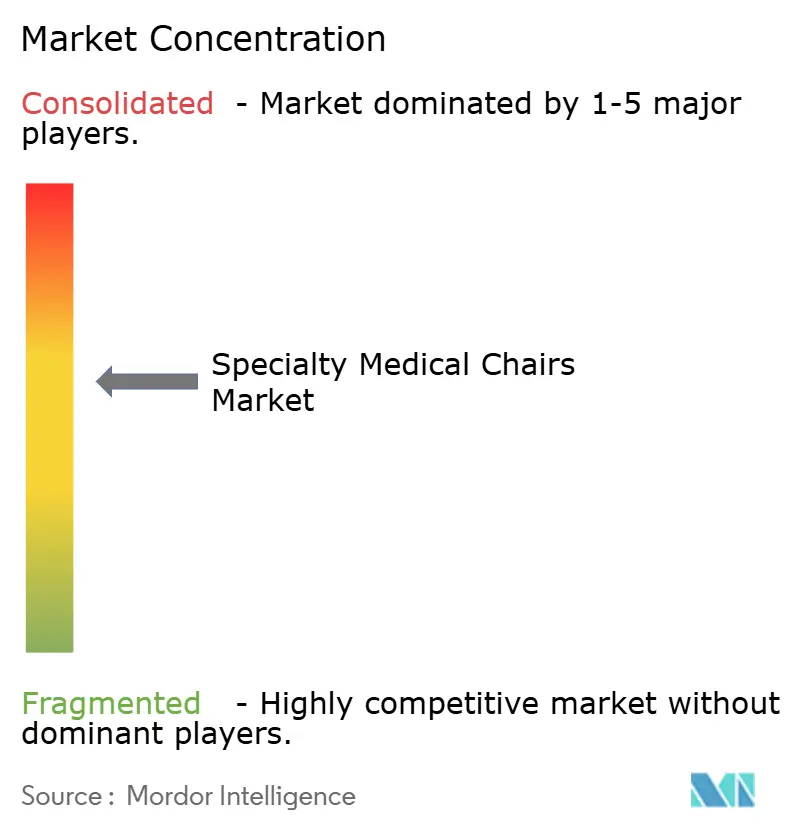
| Market Concentration | Medium |
Major Players *Disclaimer: Major Players sorted in no particular order Image © ���ϲ�����. Reuse requires attribution under CC BY 4.0. | |
Specialty Medical Chairs Market Analysis by ���ϲ�����
The Specialty Medical Chairs Market size is projected to expand from USD 4.42 billion in 2025 and USD 4.71 billion in 2026 to USD 6.46 billion by 2031, registering a CAGR of 6.52% between 2026 to 2031.
The demand for electric chairs in healthcare settings is being driven by key factors, including an aging population with multiple chronic conditions, payer strategies favoring cost-effective outpatient care, and procurement policies prioritizing electric chairs with embedded sensors for patient positioning documentation. Programmable designs that automate height, tilt, and Trendelenburg positioning are enhancing operational efficiency by reducing room turnover times and minimizing caregiver back injuries, which account for one-third of nursing-related lost-time incidents. While hospitals are replacing chairs to comply with Joint Commission pressure-injury standards, the fastest growth in unit sales is occurring in ambulatory surgery and day-care centers due to reimbursement shifts away from inpatient care. Manufacturers that certify cybersecurity compliance and offer modular upgrade pathways are expanding their market presence, as healthcare facilities increasingly consider software support and over-the-air updates as critical selection criteria.
Key Report Takeaways
- By product type, examination chairs contributed 38.03% of 2025 revenue, while treatment chairs are expanding at an 8.43% CAGR to 2031.
- By end user, hospitals accounted for 42.32% of 2025 spending; ambulatory surgery and day-care centers are growing at a 9.21% CAGR through 2031.
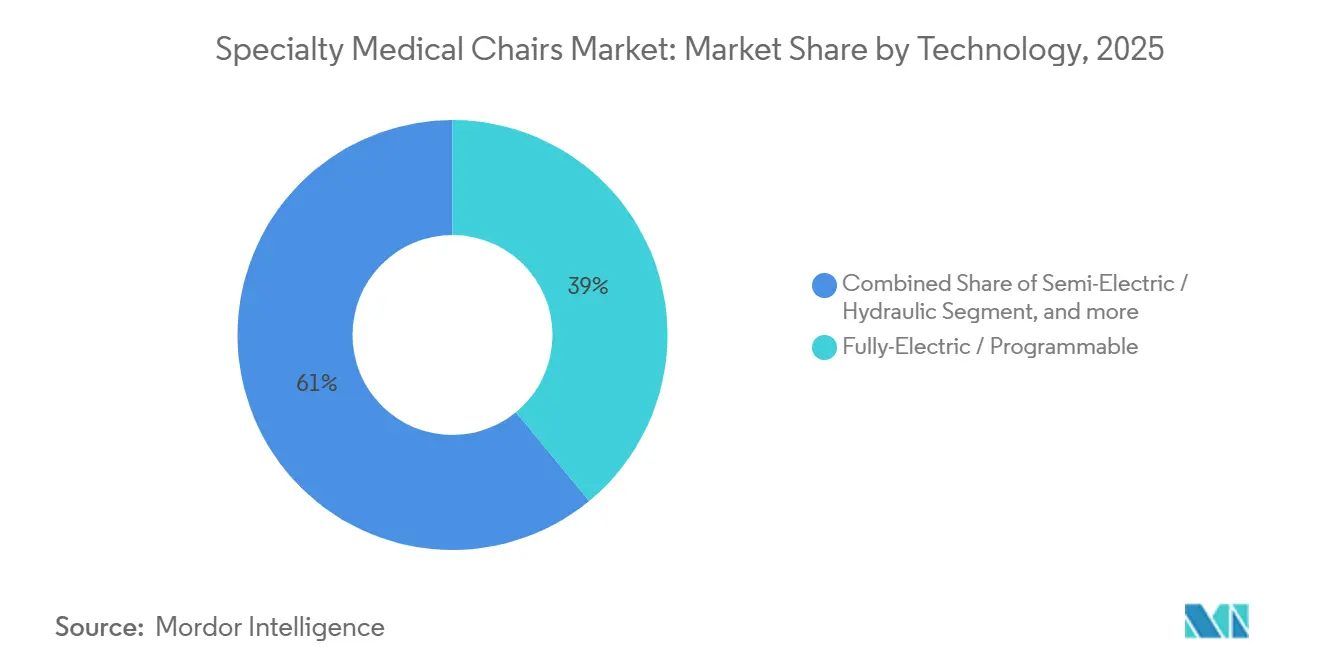
- By technology, fully electric programmable models commanded 39.03% of 2025 technology outlays and are advancing at an 8.65% CAGR.
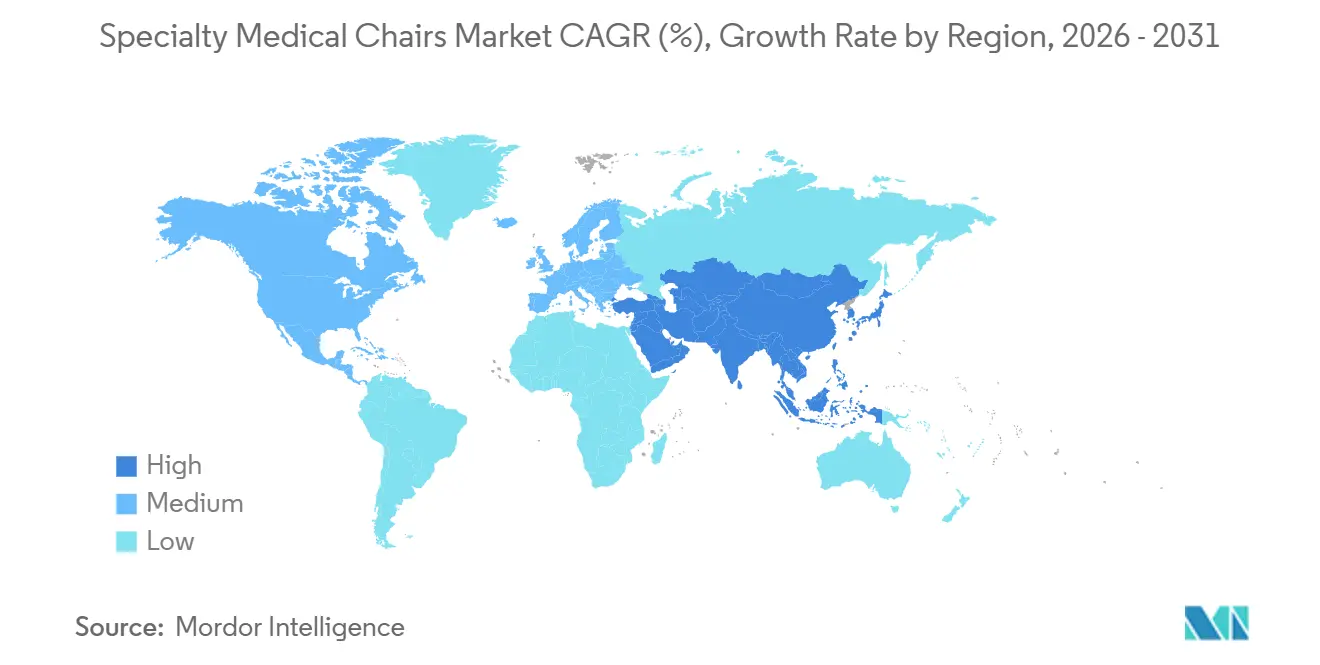
- By geography, North America accounted for 42.12% of 2025 sales; Asia-Pacific is growing fastest at a 7.54% CAGR through 2031.
Note: Market size and forecast figures in this report are generated using ���ϲ�����’s proprietary estimation framework, updated with the latest available data and insights as of January 2026.
Global Specialty Medical Chairs Market Trends and Insights
Drivers Impact Analysis
| Driver | (~) % Impact on CAGR Forecast | Geographic Relevance | Impact Timeline |
|---|---|---|---|
| Growing geriatric and multimorbidity patient population | +1.8% | North America, Europe, East Asia | Long term (≥ 4 years) |
| Shift toward fully electric and IoT-enabled chairs enhancing clinical efficiency | +1.5% | North America, European Union, APAC urban centers | Medium term (2-4 years) |
| Rising outpatient surgery and day-care centers in emerging economies | +1.3% | China, India, Southeast Asia, Latin America | Medium term (2-4 years) |
| Mandatory pressure injury prevention guidelines in acute care facilities | +1.2% | North America, European Union, Australia, Middle East | Short term (≤ 2 years) |
| Procurement policies favoring low-VOC and recyclable upholstery materials | +0.6% | Europe, United Kingdom, California | Medium term (2-4 years) |
| Imaging-suite demand for MRI-compatible and anti-static chair designs | +0.4% | United States, Germany, Japan | Short term (≤ 2 years) |
| Source: ���ϲ����� | |||
Growing Geriatric and Multimorbidity Patient Population
Adults aged 65 and older will represent 16% of the global population by 2030, up from 9.3% in 2020, and they show an average of 2.9 chronic illnesses that require frequent clinical encounters. Bariatric-rated chairs that lift up to 272 kg and feature powered leg-rest extensions help clinicians examine frail patients without manual handling, cutting the 35% incidence of caregiver back injuries recorded by the National Institute for Occupational Safety and Health. Japan reported that citizens aged 75 plus accounted for 38% of outpatient visits in 2025, accelerating demand for height-adjustable examination chairs that align with wheelchairs and reduce fall risk[1]Ministry of Health, Labour and Welfare, “Patient Survey 2025,” mhlw.go.jp. Longer appointment times for multimorbid patients drive clinics to adopt memory presets that restore optimal positions between visits. In the United States, 68% of seniors manage at least two chronic diseases, ensuring a steady replacement cycle as manual chairs reach ergonomic limits.
Shift Toward Fully Electric and IoT-Enabled Chairs Enhancing Clinical Efficiency
IoT-ready chairs integrate weight sensors and tilt encoders that stream data to electronic health records, satisfying Joint Commission documentation requirements. A 2024 Journal of Medical Internet Research study showed that connected chairs trimmed room turnover time by 22% in ambulatory clinics, freeing nursing staff for direct care[2]Journal of Medical Internet Research, “Smart Examination Chairs Reduce Turnover Time,” jmir.org. The FDA’s October 2023 cybersecurity guidance obliges manufacturers to submit a software bill of materials and prove encryption, driving investment in embedded Linux and secure update paths. Stryker’s ProCuity platform demonstrates the value of predictive analytics that alert caregivers when a patient exceeds pressure thresholds, positioning sensor-rich chairs as part of a wider surface ecosystem. European buyers now require IEC 62304-compliant software life-cycle evidence, embedding cybersecurity as a decisive tender criterion.
Rising Outpatient Surgery and Day-Care Centers in Emerging Economies
Outpatient visits in China reached 8.5 billion in 2024, up 6.3% year on year, backed by USD 140 billion in Healthy China 2030 primary-care funding. India’s Ayushman Bharat scheme covers 550 million citizens and reimburses day-surgery performed in accredited centers, which fuels demand for treatment chairs with integrated IV poles and antimicrobial upholstery. Brazil’s Previne Brasil ties federal transfers to municipalities that meet outpatient surgery targets, nudging facilities toward semi-electric and fully electric models that speed patient turnover. Fresenius Medical Care reports that dialysis chairs paired with its 5008 CorDiax system cut patient setup time by 15%, allowing clinics to schedule one extra session per day. Overall, surgery migration to ambulatory sites is cementing treatment chairs as the fastest-growing product category.
Mandatory Pressure Injury Prevention Guidelines in Acute Care Facilities
The National Pressure Injury Advisory Panel’s 2025 update urges repositioning immobile patients every 2 hours and documenting surface suitability, elevating demand for chairs with pressure-mapping sensors. The Joint Commission added pressure-injury risk assessment to its 2024 safety goals, compelling hospitals to adopt powered-tilt chairs in emergency, infusion, and dialysis units. Canada’s nursing guidelines recommend tilt-in-space seating during long procedures to keep sacral pressure below the 32 mm Hg capillary threshold. The US Department of Veterans Affairs earmarked USD 87 million in 2024 to replace chairs older than 10 years with bariatric-compliant powered models across all VA centers. These rules shorten refresh cycles despite wider budget pressure and shift demand toward premium programmable designs.
Restraints Impact Analysis
| Restraint | (~) % Impact on CAGR Forecast | Geographic Relevance | Impact Timeline |
|---|---|---|---|
| Post-pandemic capital budget constraints in hospitals and clinics | –0.9% | North America, Western Europe | Short term (≤ 2 years) |
| Limited reimbursement coverage for specialty chairs in non-hospital settings | –0.7% | North America, selected EU markets, emerging APAC | Medium term (2-4 years) |
| Supply-chain bottlenecks for UL-94 fire-safe actuator components | –0.6% | Global, concentrated in East Asia sourcing hubs | Short term (≤ 2 years) |
| Lengthy cybersecurity certification cycles for connected chair software | –0.5% | North America, European Union | Medium term (2-4 years) |
| Source: ���ϲ����� | |||
Post-Pandemic Capital Budget Constraints in Hospitals and Clinics
Hospital equipment budgets fell 12% in 2024 as facilities diverted funds to wage inflation, EHR upgrades, and debt service, according to the Healthcare Financial Management Association[3]Healthcare Financial Management Association, “2024 Capital Survey,” hfma.org. US data show that 36% of hospitals ran at negative margins in 2024, extending chair replacement cycles from 7 to almost 10 years. German hospitals reported operating margins of 1.2% in 2025, the lowest in a decade, limiting orders for furniture and patient-handling equipment. Manufacturers are piloting lease-to-own programs, yet finance teams remain wary of off-balance-sheet arrangements for assets lacking a discrete billing code. As a result, capital deferment will dampen order flow until labor and energy costs stabilize.
Limited Reimbursement Coverage for Specialty Chairs in Non-Hospital Settings
Medicare Part B and most Medicaid plans classify specialty chairs as facility equipment rather than durable medical equipment, leaving home-care patients to self-fund USD 3,200 to USD 8,500 per unit. Only 18% of assisted-living operators had upgraded to programmable models by 2025 because state per-diem rates exclude powered seating. Home-health agencies that serve 3.4 million Medicare beneficiaries annually use improvised seating because the prospective payment system lacks a line item for treatment chairs, constraining the acuity of home care. This reimbursement void curtails near-term expansion into residential and long-term care channels.
Segment Analysis
By Product Type: Treatment Chairs Lead Growth Trajectory
Treatment chairs are expanding at an 8.43% CAGR to 2031 as oncology, dialysis, and day-surgery sites replace manual recliners with chairs offering integrated scales and antimicrobial upholstery. Examination chairs retained 38.03% of 2025 revenue, a testament to their ubiquity in primary-care and specialist offices. Rehabilitation chairs remain niche but are benefitting from bundled payment programs that incentivize faster discharge and outpatient physical therapy.
This growth spread underscores the structural pivot toward outpatient infusion and hemodialysis sessions, where the specialty medical chairs market size for treatment settings is projected to widen its lead through 2031. Fresenius Medical Care reports its CorDiax chair platform trims session preparation by 15%, strengthening provider economics. Competitive pressure is intensifying as Asian manufacturers supply look-alike models at prices 30% lower than Western brands, compelling incumbents to differentiate via IoT connectivity and extended warranties.

Note: Segment shares of all individual segments available upon report purchase


By Technology: Programmable Electric Models Dominate Upgrades
Fully electric programmable chairs represented 39.03% of 2025 purchases and are rising at an 8.65% CAGR through 2031 because automated height, tilt, and memory presets cut caregiver injury risk and lift clinic throughput. Manual and hydraulic chairs are losing ground as safety regulators tie staff injury reduction to powered equipment adoption.
The specialty medical chairs market share for connected models is set to climb steadily as the FDA now requires a software bill of materials for every network-enabled chair. European tenders increasingly score cybersecurity readiness alongside ergonomic criteria, prompting suppliers to bundle encrypted firmware updates inside multiyear service contracts. Manual variants retain a role in rural health posts that face intermittent electricity or limited technical support.
Note: Segment shares of all individual segments available upon report purchase
By End User: Ambulatory Centers Accelerate Adoption
Hospitals provided 42.32% of 2025 spending, reflecting installed bases and regulatory urgency, yet ambulatory surgery and day-care centers are advancing at a 9.21% CAGR as payers reward lower-cost outpatient episodes. Clinics and dental offices contribute a steady mid-tier share aligned with practice expansions and lease expirations.
Reimbursement differentials explain the surge: the US Hospital Outpatient Prospective Payment System reimburses ASCs at 58% of the hospital rate, so centers maximize chair throughput to sustain margins. Conversely, the specialty medical chairs industry still sees limited penetration into home-care settings because reimbursement voids deter investment in powered equipment.
Geography Analysis
North America accounted for 42.12% of 2025 revenue owing to Joint Commission pressure-injury standards that push facilities toward chairs with pressure-mapping sensors. The US Department of Veterans Affairs earmarked USD 87 million in 2024 for fleet renewal, illustrating public-sector influence on procurement. Margin erosion has stretched replacement cycles, yet liability risk keeps baseline demand resilient.
Asia-Pacific is advancing at a 7.54% CAGR to 2031, the fastest regional pace. China’s Healthy China 2030 allocates USD 140 billion to community health stations that must install Bureau of Indian Standards-compliant seating, while India’s Ayushman Bharat extends coverage to 550 million citizens, rewarding accredited day-care centers that invest in programmable chairs. Japan’s super-aging cohort pushes clinics to adopt height-adjustable models that facilitate wheelchair transfers.
Europe shows moderate growth as fiscal constraints limit capital budgets. German hospitals report record-low margins, and the United Kingdom’s net-zero supply chain rules now favor modular chairs with replaceable actuators over single-use designs. Middle East, Africa, and South America remain project-driven markets tied to new hospital construction in urban medical hubs.

Competitive Landscape
The top five players—Stryker, Midmark, Hill-Rom (Baxter), Dentsply Sirona, and Fresenius Medical Care—account for about 38% of global revenue by bundling chairs, service contracts, and predictive-maintenance software through group purchasing organizations. Modular accessory platforms and recurring software subscriptions help these firms offset slower capital cycles.
Market challengers are carving out niches such as MRI-compatible chairs that use non-ferromagnetic actuators to comply with imaging-suite protocols. Sensor-embedded models that auto-populate electronic health records address CMS quality-reporting metrics and open cross-sell pathways into broader patient-surface ecosystems.
Barriers to entry are rising as the FDA enforces cybersecurity submissions and vulnerability disclosure, raising compliance costs for mid-tier manufacturers. Invacare’s 2024 exit from Chapter 11 underlines the funding strain faced by firms that lack scale to absorb component inflation and testing overhead. Emerging Asian manufacturers gain market share in price-sensitive markets but struggle with after-sales support in mature regions.
Specialty Medical Chairs Industry Leaders
Dentsply Sirona
A-dec Inc.
PLANMECA OY
Midmark Corporation
Fresenius Medical Care AG & Co. KGaA
- *Disclaimer: Major Players sorted in no particular order

Recent Industry Developments
- February 2025: Vivid.Care launched the HiBack Bedside Chair, its largest product release, designed to improve patient comfort based on NHS clinician feedback. The chair aims to address issues with traditional hospital bedside seating to enhance patient recovery.
- March 2025: Infinium Medical partnered with Italian manufacturer Lemi MD to bring their high-quality procedure and surgical chairs, including the Lemi MD-Series, to U.S. healthcare facilities. This collaboration introduces innovative Italian-designed equipment, including the Dreamed Stationary Chair, Monza Mobile Chair, and Lemi 4 Table.


Research Methodology Framework and Report Scope
Market Definitions and Key Coverage
Our study defines the specialty medical chairs market as purpose-built examination, treatment, and rehabilitation chairs, manual, semi-electric, and fully electric, that enable safe patient positioning during clinical procedures across hospitals, clinics, ambulatory surgery centers, and qualified home-care settings.
Scope exclusion: General hospital beds, standard office stools, and over-bed tables fall outside this assessment.
Segmentation Overview
- By Product Type
- Examination Chairs
- Cardiac Chairs
- Birthing Chairs
- Blood-Drawing Chairs
- Dialysis Chairs
- Mammography Chairs
- Other Examination Chairs
- Treatment Chairs
- ENT Chairs
- Ophthalmic Chairs
- Dental Chairs
- Infusion / Oncology Chairs
- Other Treatment Chairs
- Rehabilitation Chairs
- Geriatric Chairs
- Pediatric Chairs
- Bariatric Chairs
- Other Rehabilitation Chairs
- Examination Chairs
- By Technology
- Manual
- Semi-Electric / Hydraulic
- Fully-Electric / Programmable
- IoT / Connected & Sensor-Enabled
- By End User
- Hospitals
- Clinics & Dental Practices
- Ambulatory Surgery & Day-Care Centers
- Home-Care & Long-Term Care Settings
- Geography
- North America
- United States
- Canada
- Mexico
- Europe
- Germany
- United Kingdom
- France
- Italy
- Spain
- Rest of Europe
- Asia-Pacific
- China
- Japan
- India
- Australia
- South Korea
- Rest of Asia-Pacific
- Middle East & Africa
- GCC
- South Africa
- Rest of Middle East & Africa
- South America
- Brazil
- Argentina
- Rest of South America
- North America
Detailed Research Methodology and Data Validation
Primary Research
Interviews with biomedical engineers, procurement leads, outpatient administrators, and regional distributors across North America, Europe, and Asia-Pacific helped validate replacement intervals, discount structures, and the pace at which fully electric models penetrate rehabilitation settings.
Desk Research
We began with open datasets from bodies such as the World Bank (demographics), OECD Health Statistics (procedure volumes), WHO Global Health Expenditure, and import-export ledgers accessed through Volza for HS codes 940210 and 940290. Additional context came from peer-reviewed journals on pressure-injury prevention and filings of publicly listed chair suppliers. Where granular revenue splits were unavailable, D&B Hoovers snapshots guided proportional estimates. These publicly traceable sources established baseline units, price corridors, and installed-base renewal cycles. The data list is illustrative, not exhaustive.
Market-Sizing & Forecasting
A calibrated top-down and bottom-up blend was applied. Global procedure counts and dialysis prevalence built the demand pool, which was then cross-checked against sampled supplier shipments and average selling prices gathered during primary calls. Key variables like geriatric population growth, hemodialysis patient base, ASC build-out rates, elective surgery rebound, and price erosion from new low-cost entrants drive the model. Multivariate regression with scenario overlays projects values to 2030; gaps in unit data for emerging markets were bridged with capacity-weighted import proxies.
Data Validation & Update Cycle
Outputs pass variance checks against independent shipment, trade, and install-base signals before senior analyst review. Models refresh annually, with interim revisions triggered by material events such as reimbursement changes or large tender wins, ensuring clients always receive the latest vetted view.
Why Mordor's Specialty Medical Chairs Baseline Commands Reliability
Published estimates often diverge because firms choose different product baskets, pricing assumptions, and refresh cadences.
External trackers place the 2024 market anywhere between USD 3.7 billion and USD 4.77 billion, while another public dataset slots it at USD 4.39 billion.
Benchmark comparison
Key gap drivers stem from whether dental operator seats are bundled, how unpublished contract discounts are handled, the treatment of home-care volumes, and the age of underlying price files. Mordor analysts refresh inputs yearly and adjust for real-world rebates, which curbs both over- and under-statement.
| Market Size | Anonymized source | Primary gap driver |
|---|---|---|
| USD 4.42 B (2025) | ���ϲ����� | - |
| USD 3.70 B (2024) | Global Consultancy A | Includes dental operator chairs and list prices without discount normalization |
| USD 4.77 B (2024) | Trade Journal B | Single-factor geriatric growth; omits home-care penetration and ASP erosion |
| USD 4.39 B (2024) | Industry Association C | Uses flat global ASP and excludes fully electric rehab variants |
Taken together, the comparison shows that Mordor's disciplined scope selection, annually refreshed price curves, and dual-source validation deliver a balanced baseline that decision-makers can replicate and trust.


Key Questions Answered in the Report
What is the current value of the specialty medical chairs market?
It was USD 4.71 billion in 2026 and is projected to reach USD 6.46 billion by 2031.
Which product category is growing fastest?
Treatment chairs show the highest growth, advancing at an 8.43% CAGR through 2031.
Why are fully electric chairs gaining traction?
They automate height and tilt adjustments, cut caregiver injury risk, meet pressure-injury standards, and integrate with electronic health records.
Which region will post the highest growth?
Asia-Pacific leads with a forecast 7.54% CAGR, driven by China's Healthy China 2030 and India's Ayushman Bharat investments.
How do reimbursement gaps affect adoption in home-care settings?
Medicare and most Medicaid plans exclude specialty chairs from durable equipment coverage, so patients often self-fund, limiting residential uptake.
Who are the key market leaders?
Stryker, Midmark, Hill-Rom (Baxter), Dentsply Sirona, and Fresenius Medical Care together control about 38% of global revenue.
Page last updated on:


