South America Cotton Market Analysis by ���ϲ�����
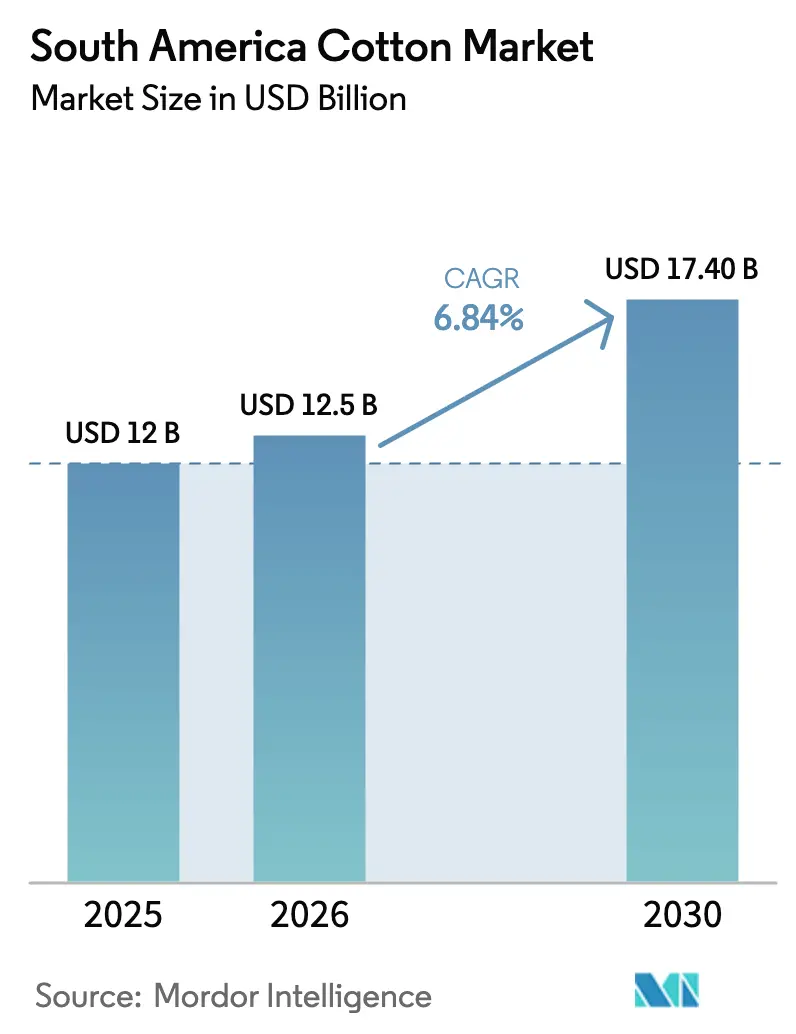
The South America cotton market size is anticipated to grow from USD 12 billion in 2025 to USD 12.5 billion in 2026 and is forecasted to reach USD 17.4 billion by 2031, at a CAGR of 6.84% (2026-2031). Cotton demand climbs as Brazil’s mechanized farms supply traceable fiber to Asian mills that must meet European Union deforestation rules. Government credit programs that cap interest at 4.5% spur acreage increases in the Maranhão, Tocantins, Piauí, and Bahia (MATOPIBA) frontier, while near-shoring of apparel production into Mercosur pulls lint into regional spinning mills. Yield gains to 1,982-2,066 kilograms per hectare in 2025, fueled by precision irrigation and satellite-guided planting, compressed harvest windows, and faster export cycles. Climate-linked water stress, pest resistance, and Northern Arc logistics bottlenecks pose near-term headwind. Yet, ongoing investment in irrigation, pest-resistant seed stacks, and rail upgrades partly offsets these risks. The South America cotton market continues to attract buyers who pay premiums of 8-12 cents per pound for Algodão Brasileiro Responsável-certified fiber, strengthening farm economics.
Key Report Takeaways
- By geography, Brazil led the South America cotton market with 64.8% market share in 2025, while Paraguay posted the highest projected CAGR of 9.6% through 2031.
Note: Market size and forecast figures in this report are generated using ���ϲ�����’s proprietary estimation framework, updated with the latest available data and insights as of January 2026.
South America Cotton Market Trends and Insights
Drivers Impact Analysis
| Driver | (~) % Impact on CAGR Forecast | Geographic Relevance | Impact Timeline |
|---|---|---|---|
| Expanding textile manufacturing and export demand | 1.8% | Brazil, Argentina, and Paraguay | Medium term (2-4 years) |
| Technological mechanization in ginning and harvesting | 1.2% | Brazil's core, spillover to Argentina and Paraguay | Short term (≤ 2 years) |
| Government credit lines for medium-scale cotton farms | 0.9% | Brazil (Maranhão, Tocantins, Piauí, and Bahia (MATOPIBA) region), and Argentina | Medium term (2-4 years) |
| Near-shoring of apparel supply chains into Mercosur | 1.4% | Regional, with early gains in Brazil and Paraguay | Long term (≥ 4 years) |
| Crop-insurance penetration among smallholders | 0.6% | Brazil (Cerrado states), and Paraguay | Medium term (2-4 years) |
| Carbon-credit premiums for regenerative cotton | 0.5% | Brazil (ABR certified farms), and Argentina | Long term (≥ 4 years) |
| Source: ���ϲ����� | |||
Expanding Textile Manufacturing and Export Demand
Brazil shipped 2.7 million metric tons of lint in 2024, surpassing the United States and positioning the South America cotton market as a leading source of traceable fiber [1]Source: USDA Foreign Agricultural Service, “Brazil Cotton and Products Annual Report 2025,” fas.usda.gov. Domestic spinning capacity in Brazil rose 12% between 2024 and 2025 to 1.2 million metric tons, absorbing more farm output and stabilizing local prices. Argentina’s yarn exports to Chile and Uruguay climbed 9% in 2025, even as Vicentin restructured operations, showing the pull of Mercosur preferences. Paraguay leverages the Paraguay-Paraná waterway to cut freight costs by up to 20%, securing new offtake contracts from Asian mills. Near-shoring by North American brands is forecast to add 180,000 metric tons of regional lint demand by 2028, reinforcing the growth path of the South America cotton market
Technological Mechanization in Ginning and Harvesting
Adoption of on-board module pickers lowered harvest labor needs by 60% in Mato Grosso and Bahia since 2024 [2]Source: Food and Agriculture Organization, “Cotton Mechanization 2024,” fao.org . Roller-gin complexes now process 120 bales per hour, up from 80 bales in 2022, enabling quicker shipment and fresher fiber quality for high-end contracts. Yield gains of 20% against 2020 levels stem from satellite-guided variable-rate fertilization and moisture sensors that optimize irrigation. Argentina and Paraguay lag Brazil by up to two seasons, but leasing models and multilateral loans accelerate technology diffusion. Mechanization increases traceability, keeping the South America cotton market attractive to sustainability-driven buyers.
Government Credit Lines for Medium-Scale Cotton Farms
Brazil’s National Program for Strengthening Family Farming (PRONAF) disbursed BRL 18 billion (USD 3.2 billion) in 2025, of which 22% flowed to cotton, funding precision irrigation and soil amendments that lift yields by about 200 kilograms per hectare [3]Source: World Bank, “Agricultural Finance and Insurance in Latin America 2025,” worldbank.org . Loans at 4.5% interest compare favorably with commercial rates above 12%, expanding planted area by 8% between 2024 and 2025. Argentina’s Banco de la Nación Argentina issued ARS 45 billion (USD 50 million), but peso volatility cut real purchasing power by 35%, slowing equipment purchases. Paraguay’s Crédito Agrícola de Habilitación program released USD 18 million, yet a 60-day disbursement lag has limited timely input acquisition. Accessible finance underpins acreage growth and modernization, reinforcing supply in the South America cotton market.
Near-Shoring of Apparel Supply Chains into Mercosur
A 34% of American Apparel and Footwear Association members intend to source at least 15% of cotton garments from South America by 2028, up from 8% in 2023. Duty-free fabric trade inside Mercosur shortens order-to-delivery cycles by 18 days when garments ship to United States ports. Brazil’s Cotton Brazil Project opened a Singapore hub in 2024 to coordinate lint flows and reverse logistics for finished goods, expanding global reach. Waterway freight from Paraguay to Buenos Aires undercuts Brazilian truck rates, luring contract manufacturers that supply fast-fashion retailers. Near-shoring provides a predictable lint off-take, strengthening price signals in the South America cotton market.
Restraints Impact Analysis
| Restraint | (~) % Impact on CAGR Forecast | Geographic Relevance | Impact Timeline |
|---|---|---|---|
| Climate-linked water stress in the Cerrado | -1.1% | Brazil (Mato Grosso, Goiás, Bahia) | Short term (≤ 2 years) |
| Rising resistance to glyphosate-tolerant Bacillus thuringiensis (Bt) varieties | -0.8% | Brazil, Argentina | Medium term (2-4 years) |
| Logistics bottlenecks at Northern Arc ports | -0.6% | Brazil (Pará, Amazonas) | Short term (≤ 2 years) |
| Tight on-farm labor pool post-pandemic | -0.5% | Brazil, Paraguay | Medium term (2-4 years) |
| Source: ���ϲ����� | |||
Climate-Linked Water Stress in the Cerrado
La Niña conditions in 2024-2025 cut second-crop yields by up to 12% in western Bahia and southern Piauí, where rainfall deficits reached 200 millimeters. The Cerrado supplies 68% of Brazilian lint, so rising rainfall variability from 22% to 31% over the past decade complicates sowing decisions. Growers invested USD 420 million in center-pivot irrigation, yet diesel price gains of 24% erode margins by as much as USD 52 per hectare. Climate models project a 10-15% precipitation decline by 2035, potentially shifting cotton east into Tocantins and Maranhão.
Rising Resistance to Glyphosate-Tolerant Bacillus thuringiensis (Bt) Varieties
Field surveys by the Brazilian Agricultural Research Corporation during 2024-2025 found Helicoverpa armigera survival rates of 40-60% when exposed to Cry1Ac and Cry2Ab toxins in Mato Grosso and Goiás, a sharp rise from 8-12% in 2020. Growers countered by increasing pyrethroid sprays from 2.5 to 4.2 per season in 2025, pushing pest control costs up by USD 45-60 per hectare and raising alarms about higher non-target insect mortality. Similar resistance pockets emerged in Argentina’s Chaco province, where regulators doubled refuge planting requirements to 20% of the cropped area to slow adaptation. Seed developers are fast-tracking Cry1F and Vip3A trait stacks for commercial release in 2027, yet agronomists caution that rotating chemistries and enforcing refuges remain critical for durability. Lack of coordination in resistance management may reduce the projected CAGR of the South America cotton market by 0.8%, due to increased input costs and diminished trait effectiveness.
Geography Analysis
Brazil accounted for 64.8% of regional consumption in 2025, driven by 1.97 million hectares of mechanized farms that supply both domestic spinners and Northern Arc export terminals. Yields consistently above 1,980 kilograms per hectare and an 84% Algodão Brasileiro Responsável certification rate secure price premiums that reinforce its leadership within the South America cotton market. Paraguay, the fastest-growing producer, is forecast to advance at a 9.6% CAGR through 2031 as shared-ownership module pickers and low-cost river freight attract Asian and North American buyers. Together, these two countries anchor regional supply and shape investment priorities for ginning, logistics, and regenerative practices.
Argentina supplies lint from rain-fed fields in Chaco and Santiago del Estero, where producers face currency volatility and limited access to modern machinery, yet preferential Mercosur trade terms keep yarn exports moving into Chile and Uruguay. Chile relies on imports to serve Santiago knitwear mills specializing in value-added apparel, while Colombia’s Medellín cluster gradually shifts orders toward Brazilian fiber to shorten lead times. Peru maintains a niche demand for premium Pima and Tangüis cotton, supplementing local harvests with imports as required quality varies by season. These diverse market structures create multiple demand corridors that stabilize overall regional offtake even when individual countries face climate or policy shocks.
Across South America, expansion of precision irrigation, weather-index insurance, and carbon-credit-funded regenerative farming is lifting average yields and lowering risk, encouraging banks and multilateral lenders to extend longer-tenor credit lines. Ongoing rail and port upgrades in Brazil’s Northern Arc are set to raise export throughput by 1.6 million metric tons by 2028, easing congestion and cutting freight costs for neighboring landlocked producers. Near-shoring of apparel assembly into Mercosur amplifies domestic spinning needs, while sustainability premiums pull more hectares into certified production systems. Collectively, these factors position every major sub-region to scale output and reinforce the continent’s standing as a reliable, traceable cotton supplier through 2031.
Competitive Landscape
The South America cotton market shows moderate concentration, with the top five players together accounting for a significant share of consumption in 2025. Bom Futuro Group controls more than 650,000 hectares in Mato Grosso and integrates ginning and river logistics to minimize delivered cost while safeguarding fiber traceability. SLC Agrícola operates close to 200,000 hectares, using satellite–guided variable-rate inputs and on-board module pickers to keep yields above 1,980 kilograms per hectare and labor needs 60% below historical norms. Both companies monetize the premiums from Algodão Brasileiro Responsável certification and carbon credits, supporting reinvestment in precision irrigation and next-generation seed traits.
Other prominent participants include Adecoagro S.A., which expanded cotton acreage 6% in 2025 and piloted no-till systems that sequester 1.8 metric tons of carbon dioxide per hectare, and several vertically integrated cooperatives in Paraguay that pool capital to lease harvest machinery. Mid-tier ginners in Bahia and Piauí upgrade roller lines to 120 bales per hour, narrowing quality gaps with larger Brazilian rivals. Firms in Argentina extensively for regional yarn buyers through preferential Mercosur tariffs even as currency volatility complicates machinery imports. Smaller Colombian and Peruvian processors continue to rely on contract farming and import blending to secure premium Pima and Tangüis fiber for high-margin knitwear runs.
Across the region, leading companies are channeling fresh capital into rail spurs, warehouse automation, and regenerative agronomy to attract sustainability-oriented buyers and justify higher lint premiums. Shared-ownership machinery programs in Paraguay and frontier Brazilian states expand access to technology for growers with less than 500 hectares, broadening raw-material pipelines for established exporters. The pending commercial launch of stacked Cry1F and Vip3A seed traits in 2027 is anticipated to curb pest-related cost spikes, freeing cash for further mechanization upgrades. As these initiatives reach scale, competitive dynamics should shift toward greater efficiency, certified output, and traceable supply, reinforcing South America’s rising influence in the global cotton trade.
Recent Industry Developments
- December 2025: Better Cotton approved a permanent governance structure for Brazil’s Better Cotton Initiative program during the Cotton Multistakeholder Dialogue in Brasília, paving the way for new 2026 projects focused on traceability and climate-resilience.
- December 2025: India and Argentina signed a 2025-2027 Work Plan between the Indian Council of Agricultural Research and the National Institute of Agricultural Technology to expand joint research on zero-till agronomy, cotton-harvesting machinery, micro-irrigation, and germplasm exchange, with annual reviews to track progress.
- October 2025: The Brazilian Cotton Growers Association debuted a lot-based traceability system and the Knowledge Hub digital platform at the ITMA Asia + CITME textile machinery exhibition in Singapore, providing global mills with batch-level data and best-practice guidance for using Brazilian lint.


South America Cotton Market Report Scope
Cotton is a soft, fluffy staple fiber that grows in a protective case called a boll around the seeds of cotton plants belonging to the genus Gossypium in the Malvaceae family. The textile industry extensively uses cotton as a primary cash crop.
The South America Cotton Market Report is Segmented by Geography (Argentina, Brazil, Colombia, Peru, and More). The Report Includes Production Analysis (Volume), Consumption Analysis (Value and Volume), Import Analysis (Value and Volume), Export Analysis (Value and Volume), Wholesale Price Trend Analysis and Forecast, List of Key Players, Regulatory Framework, Logistics and Infrastructure, and Seasonality Analysis. The Market Forecasts are Provided in Terms of Value (USD) and Volume (Metric Tons).
By Geography
| Argentina | Production Analysis (Area Harvested, Yield, and Production Volume) |
| Consumption Analysis (Consumption Value and Volume) | |
| Import Market Analysis (Import Value, Volume, and Key Supplying Markets) | |
| Export Market Analysis (Export Value, Volume, and Key Destination Markets) | |
| Wholesale Price Trend Analysis and Forecast | |
| Regulatory Framework | |
| List of Key Players | |
| Logistics and Infrastructure | |
| Seasonality Analysis | |
| Brazil | Production Analysis (Area Harvested, Yield, and Production Volume) |
| Consumption Analysis (Consumption Value and Volume) | |
| Import Market Analysis (Import Value, Volume, and Key Supplying Markets) | |
| Export Market Analysis (Export Value, Volume, and Key Destination Markets) | |
| Wholesale Price Trend Analysis and Forecast | |
| Regulatory Framework | |
| List of Key Players | |
| Logistics and Infrastructure | |
| Seasonality Analysis | |
| Chile | Production Analysis (Area Harvested, Yield, and Production Volume) |
| Consumption Analysis (Consumption Value and Volume) | |
| Import Market Analysis (Import Value, Volume, and Key Supplying Markets) | |
| Export Market Analysis (Export Value, Volume, and Key Destination Markets) | |
| Wholesale Price Trend Analysis and Forecast | |
| Regulatory Framework | |
| List of Key Players | |
| Logistics and Infrastructure | |
| Seasonality Analysis | |
| Colombia | Production Analysis (Area Harvested, Yield, and Production Volume) |
| Consumption Analysis (Consumption Value and Volume) | |
| Import Market Analysis (Import Value, Volume, and Key Supplying Markets) | |
| Export Market Analysis (Export Value, Volume, and Key Destination Markets) | |
| Wholesale Price Trend Analysis and Forecast | |
| Regulatory Framework | |
| List of Key Players | |
| Logistics and Infrastructure | |
| Seasonality Analysis | |
| Peru | Production Analysis (Area Harvested, Yield, and Production Volume) |
| Consumption Analysis (Consumption Value and Volume) | |
| Import Market Analysis (Import Value, Volume, and Key Supplying Markets) | |
| Export Market Analysis (Export Value, Volume, and Key Destination Markets) | |
| Wholesale Price Trend Analysis and Forecast | |
| Regulatory Framework | |
| List of Key Players | |
| Logistics and Infrastructure | |
| Seasonality Analysis |
| By Geography | Argentina | Production Analysis (Area Harvested, Yield, and Production Volume) |
| Consumption Analysis (Consumption Value and Volume) | ||
| Import Market Analysis (Import Value, Volume, and Key Supplying Markets) | ||
| Export Market Analysis (Export Value, Volume, and Key Destination Markets) | ||
| Wholesale Price Trend Analysis and Forecast | ||
| Regulatory Framework | ||
| List of Key Players | ||
| Logistics and Infrastructure | ||
| Seasonality Analysis | ||
| Brazil | Production Analysis (Area Harvested, Yield, and Production Volume) | |
| Consumption Analysis (Consumption Value and Volume) | ||
| Import Market Analysis (Import Value, Volume, and Key Supplying Markets) | ||
| Export Market Analysis (Export Value, Volume, and Key Destination Markets) | ||
| Wholesale Price Trend Analysis and Forecast | ||
| Regulatory Framework | ||
| List of Key Players | ||
| Logistics and Infrastructure | ||
| Seasonality Analysis | ||
| Chile | Production Analysis (Area Harvested, Yield, and Production Volume) | |
| Consumption Analysis (Consumption Value and Volume) | ||
| Import Market Analysis (Import Value, Volume, and Key Supplying Markets) | ||
| Export Market Analysis (Export Value, Volume, and Key Destination Markets) | ||
| Wholesale Price Trend Analysis and Forecast | ||
| Regulatory Framework | ||
| List of Key Players | ||
| Logistics and Infrastructure | ||
| Seasonality Analysis | ||
| Colombia | Production Analysis (Area Harvested, Yield, and Production Volume) | |
| Consumption Analysis (Consumption Value and Volume) | ||
| Import Market Analysis (Import Value, Volume, and Key Supplying Markets) | ||
| Export Market Analysis (Export Value, Volume, and Key Destination Markets) | ||
| Wholesale Price Trend Analysis and Forecast | ||
| Regulatory Framework | ||
| List of Key Players | ||
| Logistics and Infrastructure | ||
| Seasonality Analysis | ||
| Peru | Production Analysis (Area Harvested, Yield, and Production Volume) | |
| Consumption Analysis (Consumption Value and Volume) | ||
| Import Market Analysis (Import Value, Volume, and Key Supplying Markets) | ||
| Export Market Analysis (Export Value, Volume, and Key Destination Markets) | ||
| Wholesale Price Trend Analysis and Forecast | ||
| Regulatory Framework | ||
| List of Key Players | ||
| Logistics and Infrastructure | ||
| Seasonality Analysis | ||


Key Questions Answered in the Report
What is the current value of the South America cotton market?
The South America cotton market size stood at USD 12.5 billion in 2026 and is projected to reach USD 17.4 billion by 2031.
How fast is cotton consumption growing in South America?
Consumption is forecast to rise at a 6.84% CAGR between 2026 and 2031, propelled by near-shoring, mechanization, and sustainable farming incentives.
Which country leads regional cotton demand?
Brazil held 64.8% of consumption in 2025 due to large mechanized farms and integrated ginning facilities.
Why is Paraguay viewed as a high-growth cotton producer?
Paraguay's 9.6% forecast CAGR stems from shared machinery schemes and waterway freight that lower costs and improve export access.
How are South American growers addressing climate risk?
Farmers invest in center-pivot irrigation, weather-index crop insurance, and regenerative practices that earn carbon credit revenue, thereby stabilizing income despite rainfall variability.
What factors limit further cotton expansion in the region?
Key restraints include Cerrado water stress, pest resistance to Bacillus thuringiensis (Bt) traits, logistics bottlenecks at Northern Arc ports, and a tight labor pool for precision machinery.
Page last updated on:


