Market Overview
| Study Period | 2021 - 2031 |
|---|---|
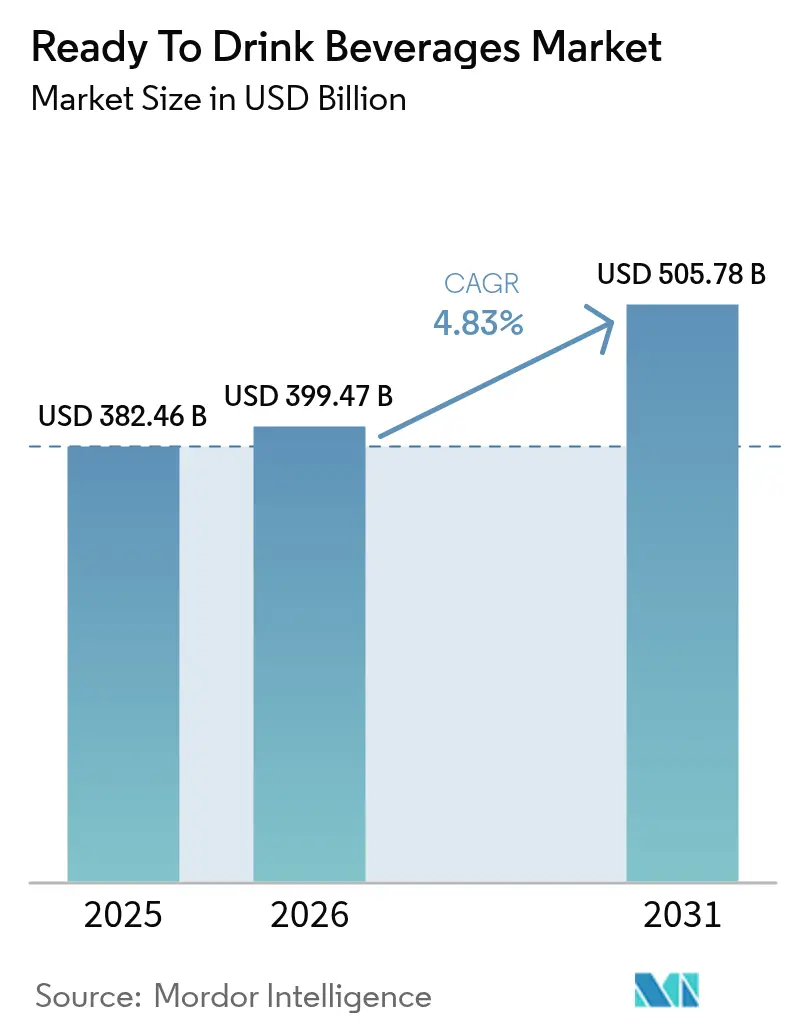
| Market Size (2026) | USD 399.47 Billion |
| Market Size (2031) | USD 505.78 Billion |
| Growth Rate (2026 - 2031) | 4.83% CAGR |
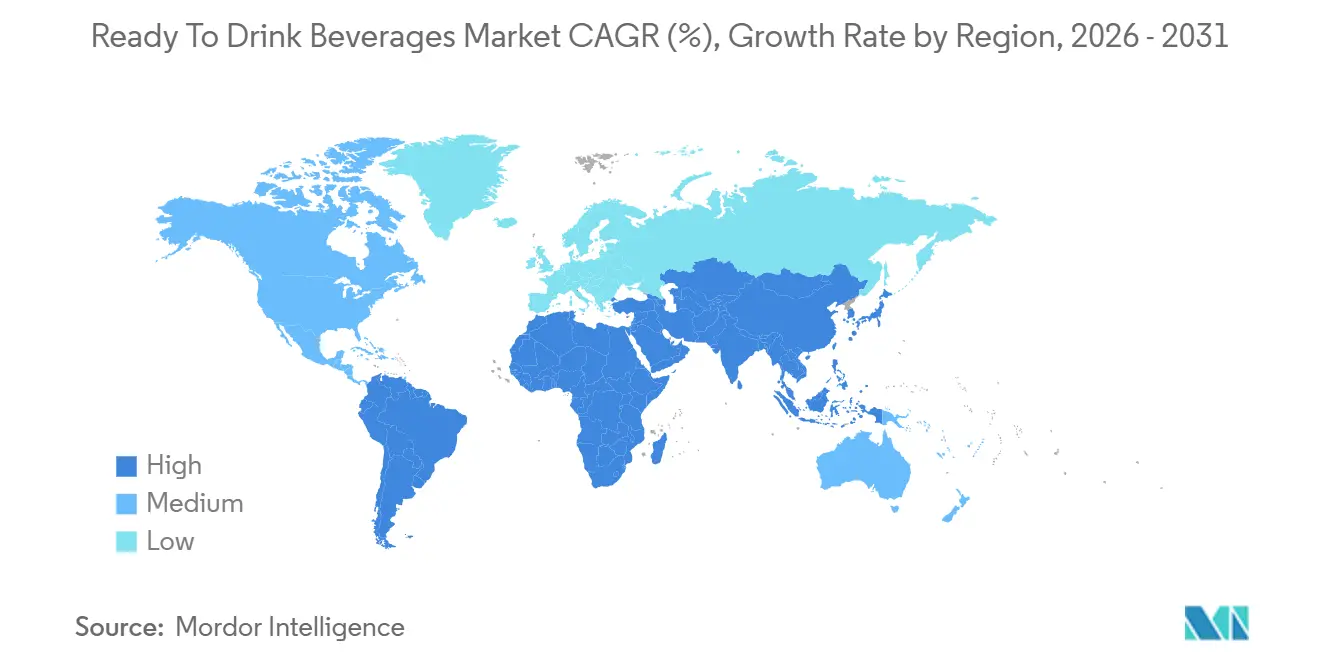
| Fastest Growing Market | South America |
| Largest Market | Asia Pacific |
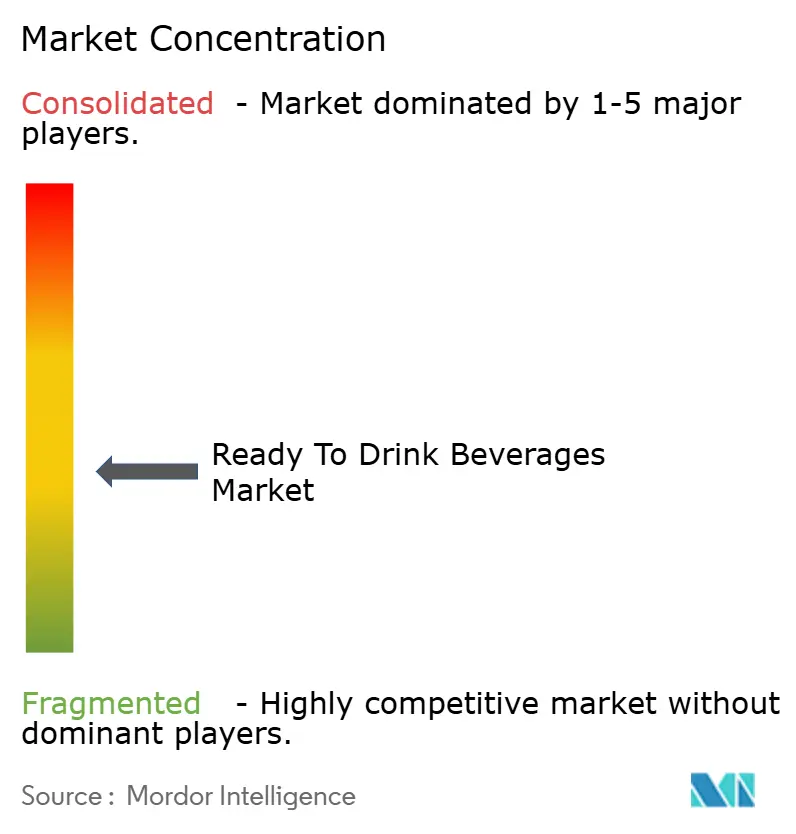
| Market Concentration | Medium |
Major Players
*Disclaimer: Major Players sorted in no particular order Image © ���ϲ�����. Reuse requires attribution under CC BY 4.0. |
|
Ready To Drink Beverages Market Analysis by ���ϲ�����
The Ready To Drink Beverages Market size is expected to grow from USD 382.46 billion in 2025 to USD 399.47 billion in 2026 and is forecast to reach USD 505.78 billion by 2031 at 4.83% CAGR over 2026-2031. Factors such as increasing urbanization, longer daily commutes, and reduced time for household meal preparation are driving the demand for single-serve formats. Additionally, the growing focus on wellness is shifting consumer preferences toward functional nutrition. Regulatory actions limiting added sugars and banning certain synthetic colorants are prompting a shift toward clean-label recipes, authentic ingredient sourcing, and lower-calorie options. Distribution innovations, particularly the integration of convenience stores with data-driven direct-to-consumer (DTC) models, are enhancing the availability of niche SKUs, even in regions with underdeveloped cold-chain infrastructure. The adoption of aluminum cans, supported by deposit-return systems and rising consumer awareness of packaging sustainability, is surpassing traditional PET in growth. Furthermore, increasing input costs, especially for coffee, cocoa, and cane sugar, are encouraging both multinational corporations and emerging brands to optimize hedging strategies, accelerate reformulation efforts, and adjust packaging sizes to maintain profit margins.
Key Report Takeaways
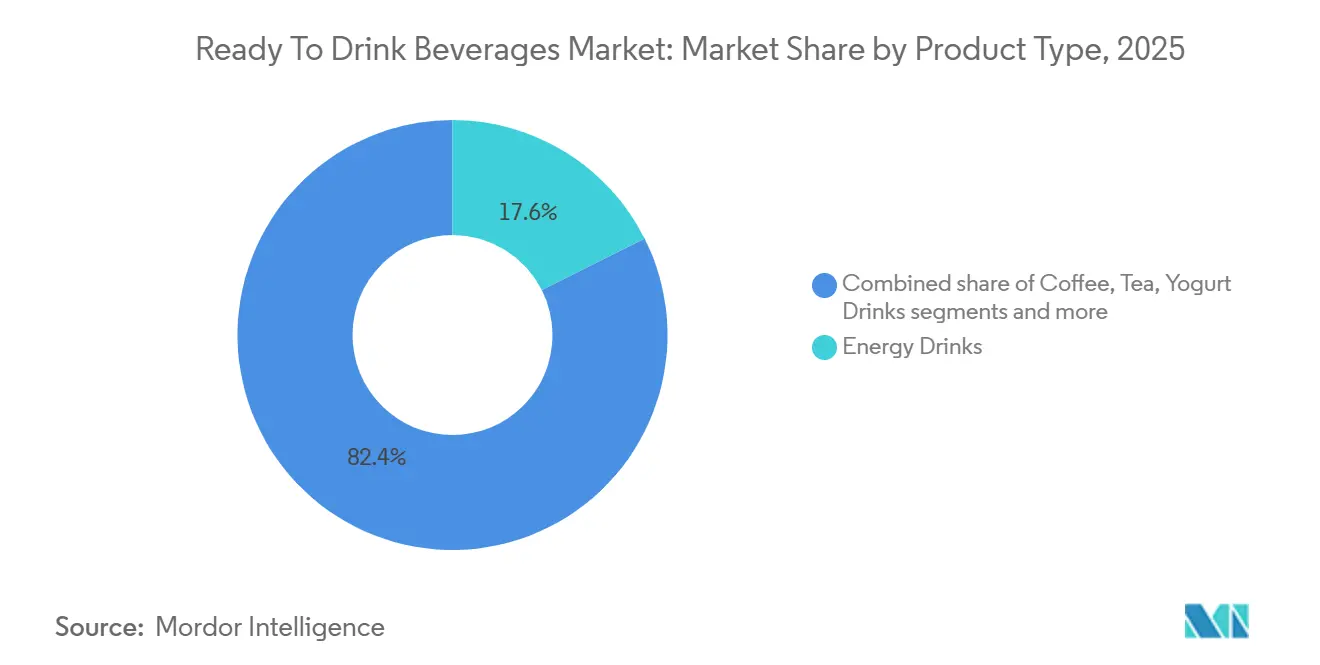
- By product type, energy drinks led with 17.59% of the ready-to-drink beverages market share in 2025, while dairy and dairy alternatives are forecast to grow at a 5.28% CAGR through 2031.
- By ingredient, conventional formulations captured 68.15% of the ready-to-drink beverages market size in 2025, while natural and organic variants are advancing at a 5.97% CAGR from 2026 to 2031.
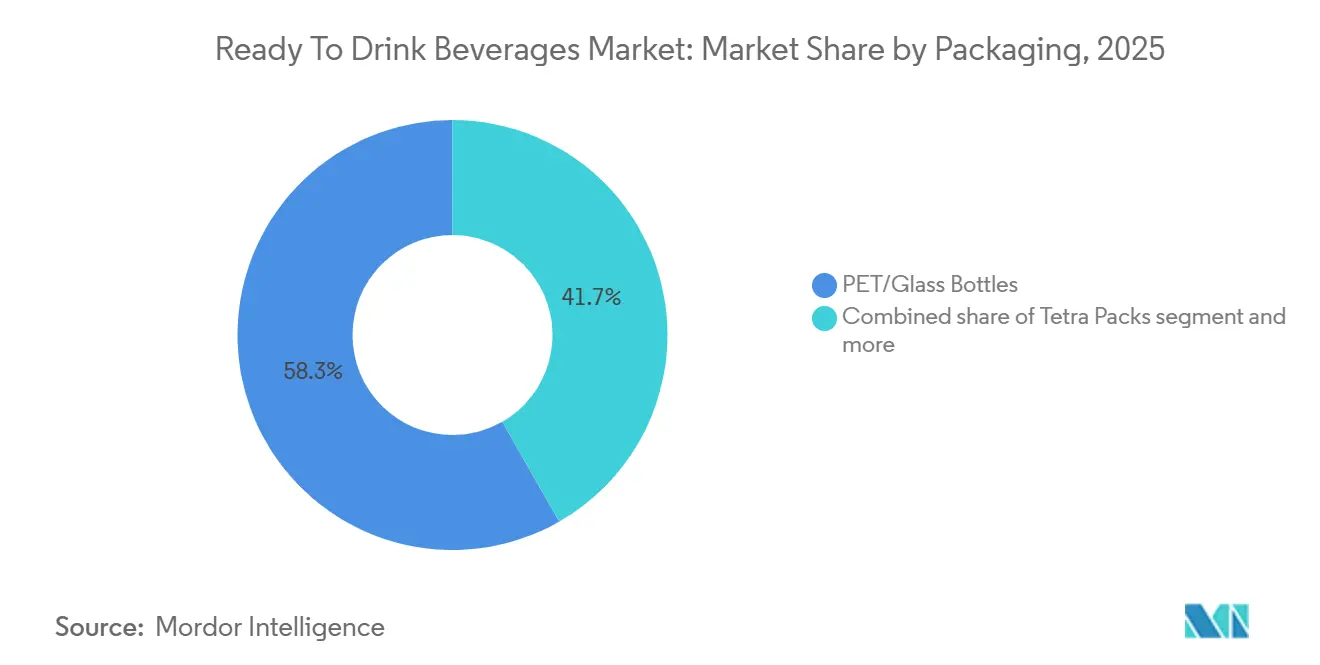
- By packaging, PET and glass bottles held 58.27% of the ready-to-drink beverages market size in 2025, while aluminum cans are projected to expand at a 5.74% CAGR through 2031
- By distribution channel, off-trade outlets accounted for 78.45% of the ready-to-drink beverages market share in 2025, while on-trade venues are projected to record a 5.46% CAGR between 2026 and 2031.
- By geography, Asia-Pacific accounted for 33.18% of the ready-to-drink beverages market share in 2025, while South America is projected to record a 5.14% CAGR between 2026 and 2031.
Note: Market size and forecast figures in this report are generated using ���ϲ�����’s proprietary estimation framework, updated with the latest available data and insights as of 2026.
Global Ready To Drink Beverages Market Trends and Insights
Drivers Impact Analysis*
| Driver | (~) % Impact on CAGR Forecast | Geographic Relevance | Impact Timeline |
|---|---|---|---|
| Rising demand for convenience and on-the-go consumption | +1.2% | Global, with concentration in North America, Europe, and urban Asia-Pacific | Medium term (2-4 years) |
| Increasing demand for on-the-go healthy beverages | +0.9% | North America, Europe, Asia-Pacific urban centers | Medium term (2-4 years) |
| Consumer inclination towards low sugar/sugar-free beverages | +1.1% | North America, Europe, Australia, with spillover to urban South America and Middle East and Africa | Short term (≤ 2 years) |
| Rising participation in sports and fitness activities | +0.7% | North America, Europe, Asia-Pacific (China, India, Southeast Asia) | Long term (≥ 4 years) |
| Growing influence of endorsements and social media marketing | +0.6% | Global, with highest impact in North America, Europe, and digitally connected Asia-Pacific markets | Short term (≤ 2 years) |
| Premiumization and flavor innovation | +0.8% | North America, Europe, Asia-Pacific premium segments, emerging in South America | Medium term (2-4 years) |
| Source: ���ϲ����� | |||


Rising demand for convenience and on-the-go consumption
Urbanization and the demands of modern life are driving increased interest in ready-to-drink (RTD) beverages that eliminate the need for preparation. Urban areas, where professionals face tight schedules, are becoming key markets for these convenient beverage options. In 2025, the International Labour Organization reported that 57.8% of the global workforce was employed, highlighting the growing preference for health-focused, on-the-go solutions[1]Source: International Labour Organization, "Number of employees worldwide from 1991 to 2025", www.ilo.org. Canada's foodservice sector experienced 5.1% growth in 2024, fueled by a rise in away-from-home dining as dual-income households prioritize convenience over cost. This shift is even more evident in the Asia-Pacific region, where megacities like Jakarta and Mumbai, with commute times exceeding 90 minutes, present significant opportunities for grab-and-go beverages. Convenience stores and vending machines are capturing a larger market share, particularly for energy drinks and RTD coffee, as retailers optimize cold-chain placements and impulse-buy displays to meet consumer demand.
Consumer inclination towards low sugar/sugar-free beverages
Regulatory pressures and growing health awareness are accelerating the adoption of zero-calorie sweeteners and reduced sugar content. In 2024, the FDA revised its definition of "healthy," introducing stricter limits on added sugars, sodium, and saturated fats. This change is expected to reshape front-of-package labeling and influence consumer perceptions. The WHO recommends limiting added sugar intake to less than 10% of total energy consumption, with additional benefits at 5%. This guidance is driving a decline in traditional soda and sweetened tea formulations. The increasing prevalence of diseases like diabetes is boosting demand for low-sugar and Sugar-Free Beverages. According to the International Diabetes Federation's 2025 Diabetes Atlas, 11.1% of adults aged 20-79, or 1 in 9, are living with diabetes[2]Source: International Diabetes Federation, "Diabetes Facts and Figures", idf.org. In 2024, sugar-free energy drinks expanded their market share, causing established brands to lose ground to agile competitors focusing on clean-label formulations. Additionally, the EFSA's re-evaluation of aspartame and saccharin is creating regulatory uncertainty, encouraging brands to diversify their sweetener options with stevia, monk fruit, and allulose.
Premiumization and flavor innovation
Consumers are showing a growing willingness to pay higher prices for distinctive taste profiles, exotic ingredients, and artisanal production techniques. In February 2024, Coca-Cola launched "Coca-Cola Spiced," followed by "Orange Cream" and "Sprite + Tea" variants in 2025, targeting consumers eager for flavors beyond traditional cola options. Innovation in the ready-to-drink (RTD) coffee segment is accelerating, with cold brews, nitro infusions, and single-origin beans commanding 20-30% price premiums compared to standard formats. The Asia-Pacific region, especially China, is driving the premiumization trend. China's RTD tea market is shifting toward higher-priced functional teas enriched with adaptogens, collagen, and traditional Chinese medicine ingredients. Flavor innovation also includes limited-edition releases that generate urgency and social media buzz, leveraging scarcity psychology to encourage trials and enhance brand engagement. The premium segment's stability during economic downturns highlights that consumers view these differentiated beverages as affordable luxuries, offering experiential value beyond basic refreshment.
Rising participation in sports and fitness activities
The global ready-to-drink (RTD) beverages market is experiencing growth due to increasing participation in sports and fitness activities. This trend is expanding the consumer base for functional hydration and performance-focused products, such as sports drinks, protein shakes, and electrolyte beverages. In 2024, the Sports and Fitness Industry Association (SFIA) revealed that 68.8% of Americans engaged in fitness sports, marking a modest uptick from the prior year[3]Source: Sports and Fitness Industry Association, "Share of population who participate in fitness sports in the United States from 2013 to 2024", www.sfia.org. Despite this, there is a growing interest in gym memberships, running, cycling, team sports, and home workouts, spanning from professional athletes to casual "weekend warriors." This increased activity has driven consistent demand for convenient RTDs that offer immediate post-exercise nutrition without the need for mixing powders. RTD beverages effectively meet athletes' requirements by delivering targeted benefits: protein supports muscle recovery and synthesis, electrolytes and carbohydrates aid hydration and reduce fatigue, and additional components like BCAAs or vitamins enhance performance. These attributes make RTDs an optimal choice for quick, portable recovery during training or events.
Restraint Impact Analysis*
| Restraint | (~) % Impact on CAGR Forecast | Geographic Relevance | Impact Timeline |
|---|---|---|---|
| Health concerns around sugar, calories, and additives | -0.8% | Global, with highest impact in North America, Europe, and Australia | Short term (≤ 2 years) |
| Consumer inclination towards fresh prepared drinks | -0.5% | North America, Europe, urban Asia-Pacific | Medium term (2-4 years) |
| Environmental impact and packaging waste concerns | -0.6% | Europe, North America, with emerging pressure in Asia-Pacific and South America | Medium term (2-4 years) |
| Fluctuating raw material prices | -0.9% | Global, with acute impact on coffee and tea sourcing regions | Short term (≤ 2 years) |
| Source: ���ϲ����� | |||
Health concerns around sugar, calories, and additives
Public health campaigns are increasingly linking sugary beverage consumption to obesity, type 2 diabetes, and cardiovascular disease, leading to a decline in demand for traditional high-calorie formats. In January 2025, the FDA's ban on Red Dye 3 underscored a growing regulatory intolerance for synthetic additives, compelling companies to reformulate their products and consider SKU rationalization. Following reports of adverse events tied to high caffeine consumption, energy drinks came under heightened scrutiny. This led the EFSA to recommend a maximum daily caffeine intake of 400 milligrams for adults and 3 milligrams per kilogram of body weight for adolescents. Brands now grapple with a strategic choice: should they reformulate to align with health guidelines, risking alienation of taste-loyal consumers, or stick with legacy formulations and face volume declines among health-conscious demographics? The industry's most adept players are channeling efforts into consumer education, positioning functional ingredients like caffeine, taurine, and B-vitamins as performance enhancers rather than health risks.
Fluctuating raw material prices
In 2024, droughts in Brazil and disruptions in Vietnam's supply chain, the leading producer of robusta coffee, pushed Arabica coffee futures higher. Sugar prices mirrored this volatility, with ICE Sugar No. 11 futures fluctuating between 19-23 cents per pound in 2024-2025, influenced by weather challenges in Brazil and India. While tea prices had been stable, they're now facing upward pressure due to climate change effects in Assam and Darjeeling. Brands with vertically integrated supply chains or long-term hedging contracts navigate this volatility more adeptly. In contrast, smaller players grapple with tighter margins, curbing their innovation and marketing investments. The industry's reactions vary: premium brands absorb costs to uphold their market stance, whereas value brands either shrink pack sizes or reformulate with cheaper ingredients, risking their quality image.
*Our updated forecasts treat driver/restraint impacts as directional, not additive. The revised impact forecasts reflect baseline growth, mix effects, and variable interactions.
Segment Analysis
By Product Type: Functional Positioning Redefines Categories
In 2025, energy drinks represented 17.59% of the ready-to-drink beverages market, maintaining cultural significance among students, shift workers, and amateur athletes. However, as formulators shift away from synthetic taurine and artificial colors, sugar-free and naturally caffeinated options are gaining traction. Dairy and dairy alternatives, growing at a robust 5.28% CAGR, utilize oat, almond, and pea proteins to appeal to dairy-avoidant consumers while preserving a creamy texture. Probiotic-rich yogurt drinks lead gut-health messaging in Asia-Pacific and parts of Europe. At the same time, smaller niches like kombucha, kefir, and functional shots, though limited in size, secure premium shelf space due to their high turnover rates. This trend underscores the growth potential for hybrid products, such as protein-enriched cold-brew coffee, which are poised to grow faster than the overall market.
Functional diversification is redefining competitive advantages, with large multinationals leveraging scale in the energy and cola segments. Meanwhile, emerging brands are capitalizing on untapped opportunities by blending categories, such as adaptogenic green-tea energy drinks targeting health-conscious millennials. Regulatory differences add complexity; while the FDA provides caffeine guidelines, the EFSA's stricter regulations limit brand consistency across the Atlantic. Consequently, market strategies focus on region-specific products, complicating global supply chains but reinforcing the advantages of local first movers in the ready-to-drink beverage sector.


By Ingredient: Clean-Label Premiums Outpace Cost Inflation
In 2025, conventional ingredients accounted for 68.15% of the ready-to-drink beverages market size, driven by established infrastructure and consumer taste familiarity. Key formulations utilized high-fructose corn syrup, cane sugar, and synthetic caffeine, ensuring cost efficiency at scale. However, natural and organic ingredient lines are expected to grow at an annual rate of 5.97% through 2031. This growth is supported by transparency apps, clean-label aisles in retail, and youth-driven environmental activism, which have increased consumers' willingness to pay a premium. Stevia and monk-fruit extracts are replacing aspartame, while allulose is emerging as a bulk sweetener that replicates sucrose’s functional properties without the caloric content. Certification logos, such as USDA Organic and EU Leaf, act as effective on-pack accelerators, contributing to higher basket sizes.
Manufacturers adopting a dual-portfolio strategy are demonstrating flexibility in managing demand elasticity. Economy SKUs are being utilized to maintain market presence during inflationary periods, ensuring affordability for cost-conscious consumers. Meanwhile, premium clean-label SKUs are positioned to capitalize on margin expansion as disposable incomes recover, catering to a growing segment of consumers seeking high-quality, minimally processed products. This dual approach reflects a broader trend within the food industry, emphasizing a clear and irreversible shift toward ingredient transparency and minimal processing. This evolution is reshaping the ready-to-drink beverages sector, aligning it more closely with consumer demands for healthier and more sustainable product offerings.
By Packaging: Circularity Shapes Material Decisions
In 2025, PET and glass bottles held a commanding 58.27% share of the ready-to-drink beverages market. Meanwhile, aluminum cans are projected to grow at a 5.74% CAGR through 2031. Thanks to deposit-return laws in Germany, Scandinavia, and twelve U.S. states, aluminum recycling rates have surged past 70%, bolstering closed-loop economics. Producers of energy drinks and hard seltzers favor cans for their portability and ability to block light, both of which help maintain flavor integrity. Glass bottles continue to dominate segments where color and a premium feel drive purchases, such as in sparkling botanicals and cold-brewed teas. In emerging markets, while the deployment of rPET faces supply challenges, multinational bottlers are responding by investing in localized wash-and-flake plants or partnering with municipal recycling initiatives.
Foodservice operators seeking to reduce waste per serving are increasingly adopting hybrid packaging formats, such as Tetra-top cartons and bag-in-box concentrate packs. Despite their advantages, these formats have achieved only limited penetration in the ready-to-drink beverages market. This is primarily due to consumer preferences for transparent or metallic containers, which effectively convey cues of product freshness and quality.
By Distribution Channel: The Rise of Data-Rich Omnichannel Models
In 2025, off-trade venues, such as supermarkets, hypermarkets, and convenience stores, accounted for 78.45% of the ready-to-drink beverages market share. This dominance is due to their advanced refrigeration infrastructure and effective promotional end-caps. Convenience stores near transit hubs achieve the highest unit velocities by leveraging micro-planograms that rotate energy drinks or protein coffees to meet demand during the morning rush and late-night study periods. Online channels, while contributing less than 15% of dollar sales in most mature economies, are driving a significant portion of year-on-year growth. This growth is primarily fueled by mobile wallets, which streamline transactions and reduce friction.
From 2026 to 2031, cafés, casual-dining chains, and entertainment venues are projected to grow at a 5.46% CAGR. Menu engineers are increasingly adding RTD cocktails, nitro coffees, and functional sodas to their offerings. These products, which require no back-bar labor, support premium pricing strategies. Direct-to-consumer subscription clubs are further merging channel boundaries by providing brands with zero-party data that helps prioritize flavor development. Consequently, omnichannel alignment has become a critical capability, with predictive analytics, dynamic fulfillment routing, and smart-vending pilots emerging as key differentiators in the ready-to-drink beverages market.
Geography Analysis
In 2025, the Asia-Pacific region commanded a dominant 33.18% share of the ready-to-drink (RTD) beverages market, driven by its vast population, a burgeoning middle class, and a cultural penchant for tea. China's RTD tea segment, significantly bolstered by domestic frontrunners like Nongfu Spring, capitalized on well-established distributor networks. Between 2020 and 2025, India's organized retail penetration surged from 12% to 18%, paving the way for a nationwide chilled-chain rollout of probiotic yogurt and functional water. Meanwhile, Japan and South Korea are leading the charge in premiumization, with products like collagen-infused coffees and hyaluronic-acid sodas tapping into the 'beauty-from-within' trend. Southeast Asia's growth can be attributed to its tropical climate, a burgeoning fitness culture, and an expanding network of 24-hour convenience stores.
South America is projected to grow at a 5.14% CAGR from 2026 to 2031, outpacing more established markets despite facing macroeconomic headwinds. Brazil's strong domestic production of sugar and coffee not only ensures competitive pricing for RTD beverages but also bolsters its export capabilities. Meanwhile, Argentina, Chile, and Colombia are carving out a niche by emphasizing upscale offerings, featuring functional infusions and botanicals sourced locally, setting themselves apart from global soda giants. While challenges like currency fluctuations and political instability persist, a burgeoning base of digital commerce users is paving new pathways to market access.
North America, though mature, remains vibrant, driven by innovations in functional beverages and stringent sugar regulations reshaping offerings. In Europe, while sugar taxes and directives on single-use plastics add to costs, the resilience of premium product lines and a shift towards aluminum cans help counterbalance the declining volume of traditional sodas. The Middle East and Africa, despite trailing in overall consumption, witness robust double-digit growth in unit sales, particularly in Gulf Cooperation Council nations. Here, a focus on premium hydration resonates with rising fitness investments. Supply-chain entities that adeptly navigate halal certification and maintain temperature-controlled logistics are gaining a competitive edge in these warmer regions. Given this diverse landscape, brands must remain agile, adapting their portfolios to maintain relevance in the ever-evolving RTD beverage market.

Competitive Landscape
The ready-to-drink beverages market exhibits moderate fragmentation. The top five companies command only a modest share of global revenue, leaving ample opportunity for regional champions and digital-native newcomers. Industry leaders, PepsiCo and Coca-Cola, have been diversifying their portfolios, with PepsiCo making headlines through its acquisition of Poppi and Coca-Cola ramping up its commitments to aluminum cans. While Red Bull and Monster Energy maintain their dominance in the energy drink sector, they've both intensified their focus on sugar-free innovations, a move to safeguard their market share amidst rising competition from influencer-backed brands targeting younger consumers. In a notable strategic move, Keurig Dr Pepper shelled out USD 1.65 billion for GHOST, underscoring its ambition to tap into lifestyle-centric brands that seamlessly merge the worlds of supplements and beverages.
Market strategies are revealing a two-pronged approach: on one hand, there's an expansion of product portfolios to align with evolving consumer preferences; on the other, a keen focus on specialized sub-brands aimed at niche markets. Major industry players are broadening their offerings to appeal to a wider audience, all the while crafting products that cater to specific consumer demands. The energy drinks segment stands out as particularly cutthroat. Companies like Monster Beverage and Red Bull are grappling with intensified competition, a reality underscored by Monster's co-CEO, who has pointed to the rising challenge from up-and-coming brands like Celsius.
In 2024, merger activity surged to a multi-year peak, driven by valuations that favor portfolios with functional claims and direct-to-consumer community engagement. Companies boasting vertically integrated operations, be it in roasting or juicing, found themselves better insulated against raw-input inflation, granting them an edge in acquisition capabilities. The industry witnessed a technological leap, with blockchain initiatives ensuring ingredient traceability and AI tools honing demand predictions, both curbing losses from products nearing their shelf-life expiration. As input and compliance costs climb, the industry's frontrunners will meld large-scale manufacturing with agile, insight-driven strategies. Meanwhile, niche innovators face a crossroads: either being absorbed through acquisitions or forging strategic co-packing partnerships to amplify their national presence.
Ready To Drink Beverages Industry Leaders
-
Red Bull GmbH
-
PepsiCo, Inc.
-
The Coca-Cola Company
-
Nestle S.A
-
Danone S.A
- *Disclaimer: Major Players sorted in no particular order

Recent Industry Developments
- February 2026: TENZING introduced its newest innovation: Natural Energy+. Designed to tackle the most demanding days, particularly during colder seasons, Natural Energy+ Lion’s Mane blends ingredients that enhance focus and mental clarity with nutrients that support sustained energy throughout the day.
- November 2025: Monster Energy unveiled Ultra Wild Passion, a new addition to its Ultra lineup. This zero-sugar energy drink boasts a bold passionfruit flavor, complemented by refreshing citrus notes.
- October 2025: Grupo Jumex and AriZona Beverages deepened their collaboration, introducing Jumex Energy, a new line of energy drinks crafted from authentic fruit nectar blends.
- April 2025: Lipton Ice Tea has launched a new twist on RTD tea with Lipton Fusions: a lemonade iced tea infused with fruit flavor. According to the brand, the drink comes in two flavors: strawberry lemonade and pineapple mango lemonade.


Global Ready To Drink Beverages Market Report Scope
Ready-to-drink beverages are a packaged form of drinks that are sold in a prepared form and are ready for consumption. The ready-to-drink beverages market is segmented into product type, ingredient, packaging, distribution channel, and geography. By product type, the market is segmented into tea, coffee, energy drinks, yogurt drinks, dairy and dairy alternatives, flavored and fortified water, and other product types. By ingredient, the market is segmented into conventional, natural, and organic. By packaging, the market is segmented into PET/glass bottles, tetra packs, cans, and other packaging types. By distribution channel, the market is segmented into on-trade and off-trade. Based on geography, the market is segmented into North America, South America, Europe, Asia-Pacific, the Middle East, and Africa. For each segment, the market sizing and forecasts have been done based on value (USD) and volume (liters).
By Product Type
| Tea |
| Coffee |
| Energy Drinks |
| Yogurt Drinks |
| Dairy and Dairy Alternatives |
| Flavored and Fortified Water |
| Other Product Types |
By Ingredient
| Conventional |
| Natural and Organic |
By Packaging
| PET/Glass Bottles |
| Tetra Packs |
| Cans |
| Other Packaging Types |
By Distribution Channel
| On-Trade | |
| Off-Trade | Supermarkets/Hypermarkets |
| Convenience/Grocery Stores | |
| Online Retail Stores | |
| Other Distribution Channels |
By Geography
| North America | United States |
| Canada | |
| Mexico | |
| Rest of North America | |
| South America | Brazil |
| Argentina | |
| Colombia | |
| Chile | |
| Rest of South America | |
| Europe | United Kingdom |
| Germany | |
| France | |
| Italy | |
| Spain | |
| Russia | |
| Sweden | |
| Belgium | |
| Poland | |
| Netherlands | |
| Rest of Europe | |
| Asia-Pacific | China |
| Japan | |
| India | |
| Thailand | |
| Singapore | |
| Indonesia | |
| South Korea | |
| Australia | |
| New Zealand | |
| Rest of Asia-Pacific | |
| Middle East and Africa | United Arab Emirates |
| South Africa | |
| Saudi Arabia | |
| Nigeria | |
| Egypt | |
| Morocco | |
| Turkey | |
| Rest of Middle East and Africa |
| By Product Type | Tea | |
| Coffee | ||
| Energy Drinks | ||
| Yogurt Drinks | ||
| Dairy and Dairy Alternatives | ||
| Flavored and Fortified Water | ||
| Other Product Types | ||
| By Ingredient | Conventional | |
| Natural and Organic | ||
| By Packaging | PET/Glass Bottles | |
| Tetra Packs | ||
| Cans | ||
| Other Packaging Types | ||
| By Distribution Channel | On-Trade | |
| Off-Trade | Supermarkets/Hypermarkets | |
| Convenience/Grocery Stores | ||
| Online Retail Stores | ||
| Other Distribution Channels | ||
| By Geography | North America | United States |
| Canada | ||
| Mexico | ||
| Rest of North America | ||
| South America | Brazil | |
| Argentina | ||
| Colombia | ||
| Chile | ||
| Rest of South America | ||
| Europe | United Kingdom | |
| Germany | ||
| France | ||
| Italy | ||
| Spain | ||
| Russia | ||
| Sweden | ||
| Belgium | ||
| Poland | ||
| Netherlands | ||
| Rest of Europe | ||
| Asia-Pacific | China | |
| Japan | ||
| India | ||
| Thailand | ||
| Singapore | ||
| Indonesia | ||
| South Korea | ||
| Australia | ||
| New Zealand | ||
| Rest of Asia-Pacific | ||
| Middle East and Africa | United Arab Emirates | |
| South Africa | ||
| Saudi Arabia | ||
| Nigeria | ||
| Egypt | ||
| Morocco | ||
| Turkey | ||
| Rest of Middle East and Africa | ||


Key Questions Answered in the Report
What is the current value of the ready-to-drink beverages market?
The market was valued at USD 399.47 billion in 2026 and is on course to reach USD 505.78 billion by 2031.
Which product category is growing fastest within ready-to-drink formats?
Dairy and dairy-alternative beverages are projected to register the fastest growth at 5.28% CAGR through 2031.
How significant is aluminum-can packaging compared with PET and glass?
While PET and glass still dominate, aluminum cans are set to grow at 5.74% CAGR thanks to high recycling rates and supportive regulations.
Which region offers the strongest future growth potential?
South America leads in forecast growth at 5.14% CAGR for 2026-2031, supported by expanding middle-class spending and retail modernization.
Page last updated on:


