Power Tools Market Size and Share
Market Overview
| Study Period | 2020 - 2031 |
|---|---|
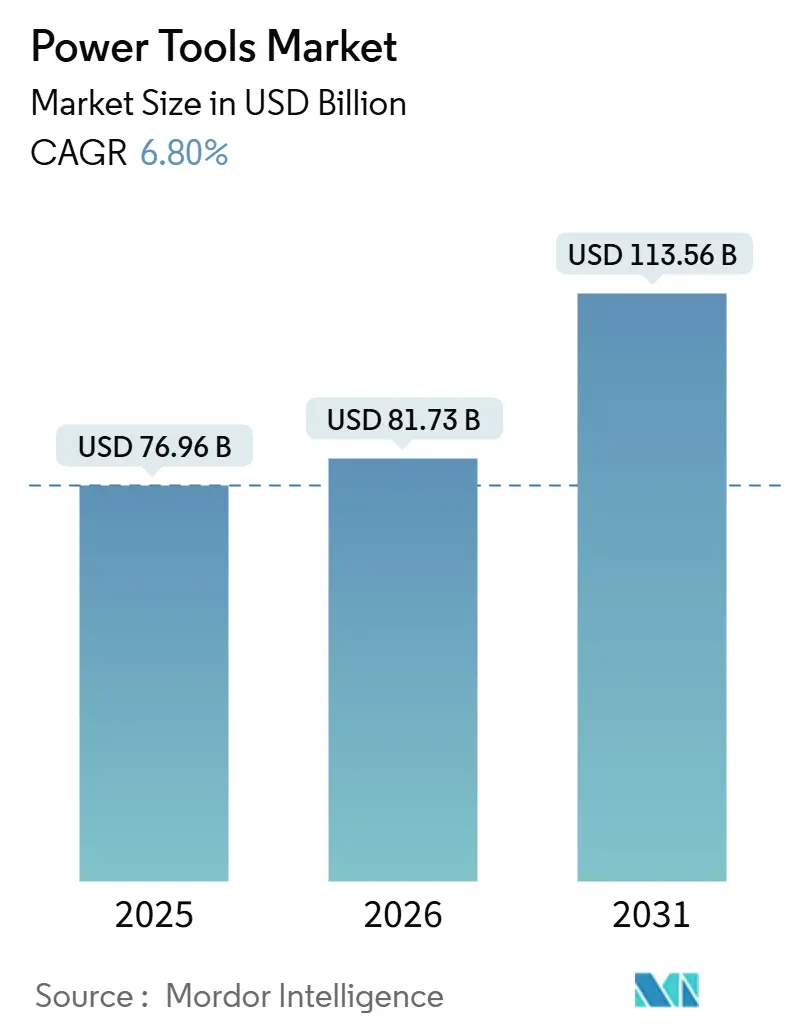
| Market Size (2026) | USD 81.73 Billion |
| Market Size (2031) | USD 113.56 Billion |
| Growth Rate (2026 - 2031) | 6.80% CAGR |
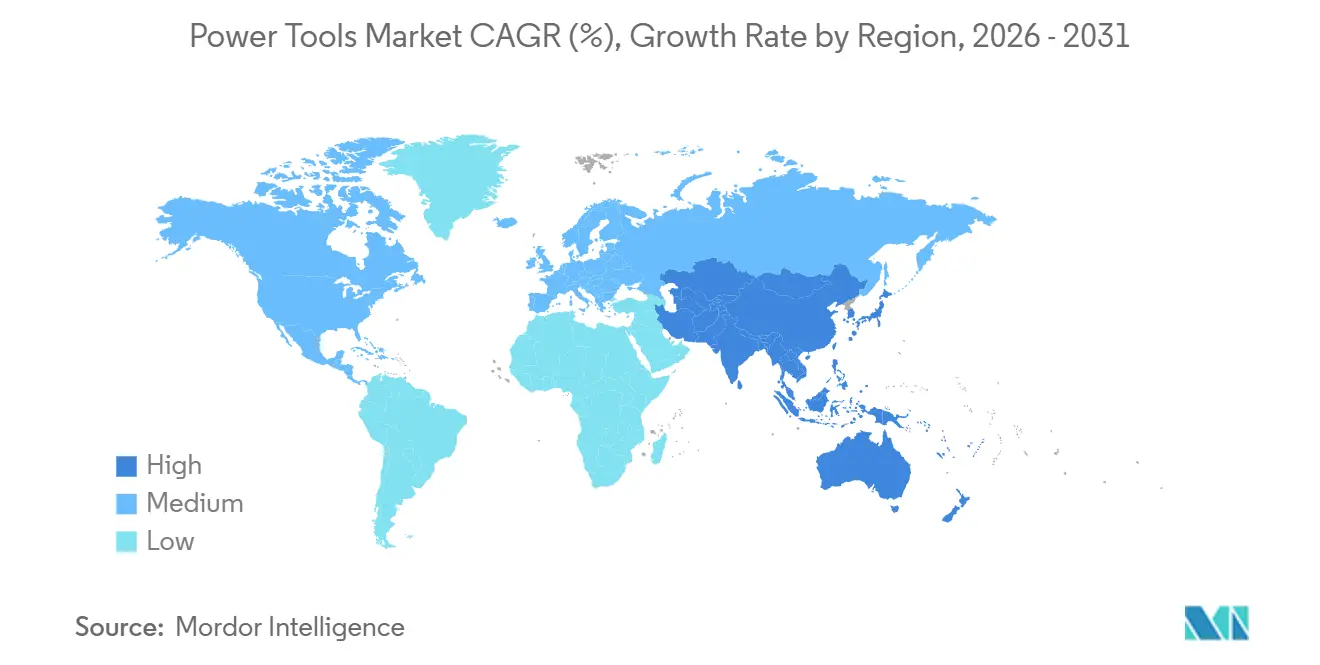
| Fastest Growing Market | Asia Pacific |
| Largest Market | Asia Pacific |
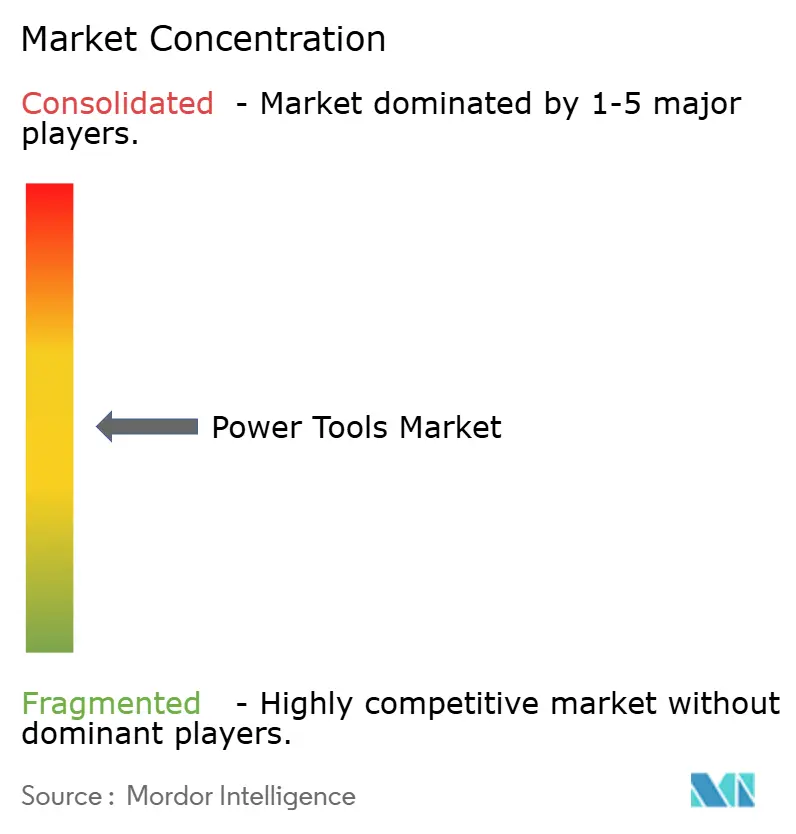
| Market Concentration | Medium |
Major Players *Disclaimer: Major Players sorted in no particular order Image © ���ϲ�����. Reuse requires attribution under CC BY 4.0. | |
Power Tools Market Analysis by ���ϲ�����
The Power Tools Market size is projected to expand from USD 76.96 billion in 2025 and USD 81.73 billion in 2026 to USD 113.56 billion by 2031, registering a CAGR of 6.80% between 2026 to 2031.
Higher public infrastructure spending, semiconductor plant build-outs, and the rapid switch from corded to lithium-ion cordless platforms are pushing global demand upward. Asia-Pacific already accounts for just under two-fifths of the power tools market, and it is adding share as India, China, and Indonesia ramp up megaprojects that specify calibrated, low-vibration electric tools for safety compliance.[1]Ministry of Finance, India, “Union Budget 2026 Highlights,” mof.gov.in Contractors on U.S. CHIPS Act fabrication sites are similarly moving to smart, self-calibrating tools that can document torque and location data, which shortens quality-assurance cycles and avoids costly rework.[2]U.S. Department of Commerce, “CHIPS for America Funding Notice,” commerce.gov On the technology side, battery packs now deliver 550-plus watt-hours per charge, closing the remaining performance gap with small pneumatic and gasoline units while eliminating exhaust fumes and extension-cord hazards. Finally, widening e-commerce penetration, especially brand-owned digital stores, is lowering procurement friction for both professional and do-it-yourself (DIY) buyers, speeding product-upgrade cycles and reinforcing the market’s growth trajectory.
Key Report Takeaways
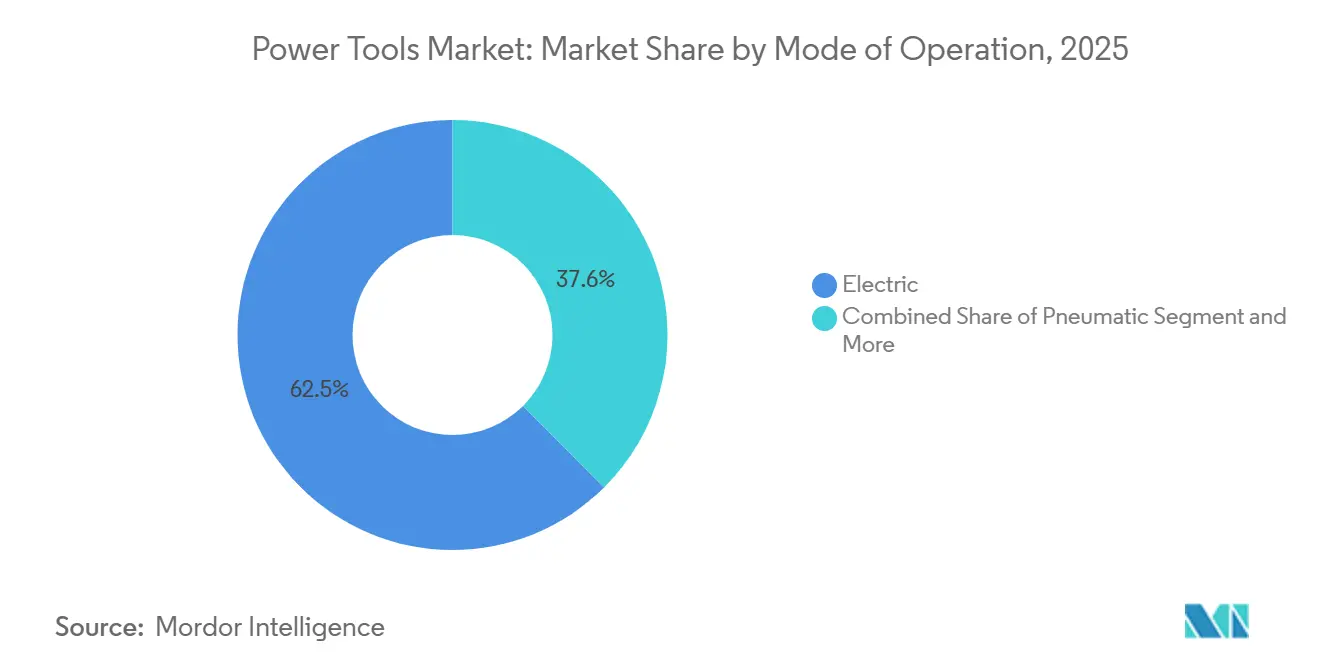
- By mode of operation, electric tools led with 62.45% of the power tools market share in 2025, while cordless variants within this category are forecast to expand at a 7.55% CAGR through 2031.
- By product, drilling and fastening captured 31.34% revenue share in 2025, whereas impact drivers and wrenches are projected to grow fastest at an 8.05% CAGR to 2031.
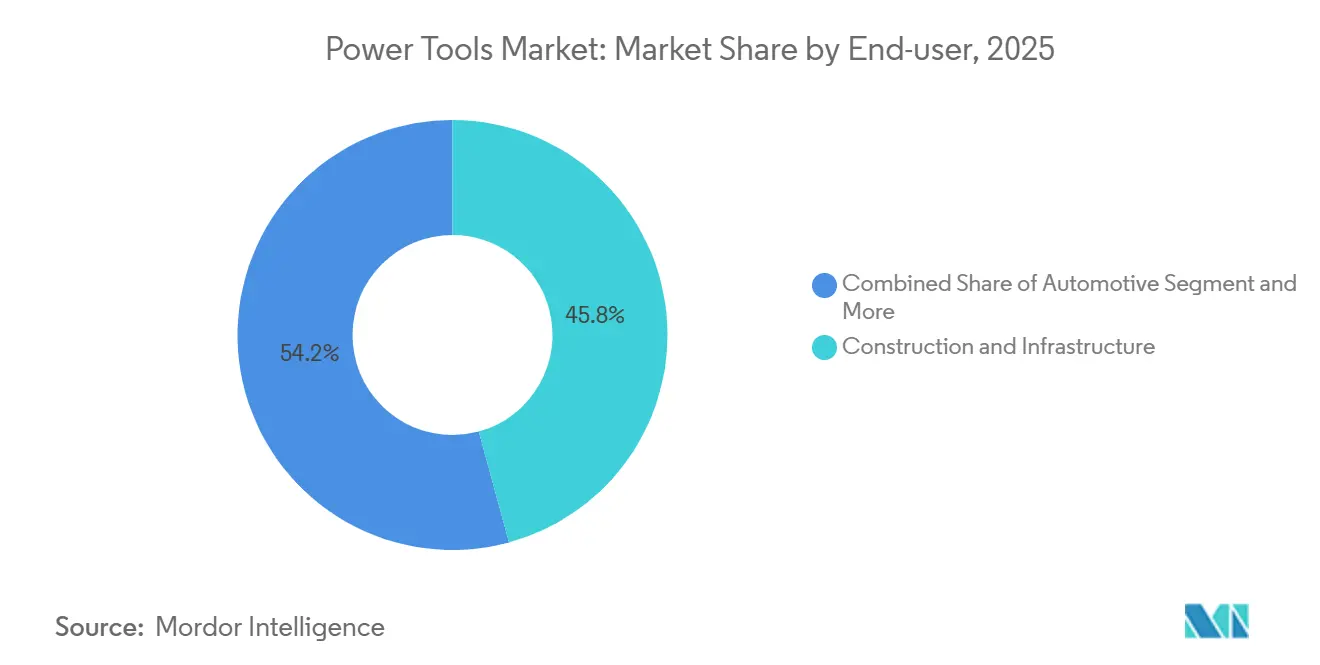
- By end-user, construction and infrastructure segments held 45.76% of the power tools market size in 2025, yet the residential and DIY segment shows the fastest trajectory at an 8.15% CAGR through 2031.
- By sales channel, offline distribution retained 78.88% share in 2025, while online channels are on track for an 8.10% CAGR over 2026-2031 as brand-owner webstores and marketplaces scale.
- By geography, Asia-Pacific commanded 38.86% share in 2025 and remains the fastest-growing region with a 7.85% CAGR forecast to 2031, supported by large-scale rail, metro, and capital-city projects in India and Indonesia.
Note: Market size and forecast figures in this report are generated using ���ϲ�����’s proprietary estimation framework, updated with the latest available data and insights as of January 2026.
Global Power Tools Market Trends and Insights
Drivers Impact Analysis
| Drivers | (~) % Impact on CAGR Forecast | Geographic Relevance | Impact Timeline |
|---|---|---|---|
| Surging Public-Infrastructure Capex in India & Tier-2/3 City Projects Lifting Pro-Tool Demand | 1.2% | India, with spillover to South Asia | Medium term (2-4 years) |
| CHIPS-Act Semiconductor Megafab Build-outs in US Requiring High-Precision Installation Tools | 1.0% | United States, with secondary effects in Taiwan and South Korea | Medium term (2-4 years) |
| Rapid Electrification of Heavy Construction Fleets Accelerating Shift to High-Voltage Cordless Platforms | 0.9% | Global, with early gains in North America, Western Europe, and China | Long term (≥ 4 years) |
| Job-Site Productivity Gains from AI-Enabled Smart & Self-Calibrating Tools Driving Contractor Upgrades | 0.8% | North America and the EU, expanding to the APAC core | Medium term (2-4 years) |
| Government-Funded Hi-Tech Tool Rooms in India Catalysing Indigenous Precision-Tool Manufacturing | 0.6% | India, with regional competitiveness effects in South Asia | Long term (≥ 4 years) |
| Community-Centric Construction Wave in Indonesia's Nusantara (Multi-Faith Complexes, Civic Amenities) Spurring Specialty Finishing-Tool Sales | 0.5% | Indonesia, with modest spillover to ASEAN | Medium term (2-4 years) |
| Source: ���ϲ����� | |||
Surging Public-Infrastructure Capex in India Lifts Professional Tool Demand
The Union Budget 2026 earmarked USD 145 billion for highways, metros, and industrial corridors, up 10.5% from the prior year. Large contractors are replacing legacy corded drills with high-voltage cordless models to meet tighter build schedules on remote Tier-2 and Tier-3 city sites. Government tool-room upgrades under the Technology Centre Systems Programme (TCSP) now offer CNC prototyping and metrology services, cutting import dependence for high-tolerance bits and blades. The Indian Standards Bureau also enforces ISO 9001 and ISO 14001 compliance on public projects, which nudges buyers toward branded tools that guarantee traceable calibration. As infrastructure orders flow, distributors in Coimbatore, Nashik, and Visakhapatnam report double-digit year-on-year sales of cordless impact wrenches and demolition hammers.
CHIPS Act Megafab Build-Outs Require High-Precision Installation Tools
Washington’s USD 52 billion incentive pool has already unlocked more than USD 165 billion in private semiconductor investment, with each fab requiring torque-verified fasteners and sub-millimeter civil modifications. Contractors on the TSMC Arizona site are deploying laser-guided drill rigs and Bluetooth-enabled torque wrenches that feed data directly to quality logs. New cordless cut-off saws from DEWALT deliver 4.75-inch cutting depth without exhaust fumes, eliminating special ventilation measures during cleanroom work. Labor shortages, however, have extended commissioning timelines, so rental houses are stretching payback periods on large tool fleets, a near-term drag that is expected to ease as apprenticeship programs scale.
Rapid Electrification of Heavy Construction Fleets Speeds High-Voltage Tool Adoption
Electric excavators from Liebherr and Hitachi joined job sites in 2025, bringing with them 600-volt DC charging islands that easily back-feed 40-volt and 60-volt power-tool packs. Shared battery chemistries lower carrying costs, while silent operation allows longer city-center work windows. Makita’s 40 V XGT series and Hilti’s 22 V Nuron packs now support grinders, breakers, and rotary hammers that can equal small hydraulic units in duty cycle. The European Union’s Energy Performance of Buildings Directive, recast in 2024, stipulates zero-emission construction methods by 2030, further tilting specifications toward battery-electric tools. Manufacturers that can harmonize connectors with equipment original-equipment manufacturers (OEMs) are likely to lock in replacement-pack revenue for years.
Job-Site Productivity Gains from AI-Enabled Self-Calibrating Tools
Hilti’s Nuron software lets supervisors set torque curves remotely, then verifies every fastener in real time, trimming inspection budgets by up to 20%. Milwaukee’s One-Key fleet system pairs Bluetooth tags with GPS handsets, helping rental companies cut loss write-offs and redeploy under-utilized assets faster. Third-party platforms such as ToolWorks AI now analyze material, ambient temperature, and operator skill to recommend bit speed, which reduces rework and consumables waste. These capabilities command 15-25% price premiums, yet contractors recoup the cost in lower insurance claims and faster project close-outs. The International Electrotechnical Commission (IEC) will codify cybersecurity norms in IEC 63278 by 2027, providing a baseline that could accelerate enterprise-wide adoption.[3] International Electrotechnical Commission, “Draft IEC 63278 Cybersecurity Requirements,” iec.ch
Restraints Impact Analysis
| Restraints | (~) % Impact on CAGR Forecast | Geographic Relevance | Impact Timeline |
|---|---|---|---|
| Cobalt price spikes from DRC export quotas | – 0.7% | Global, most acute in North America and Europe | Short term (≤2 years) |
| Skilled labor shortages at North American megafab sites | – 0.5% | United States, spillover to Canada and Mexico | Short term (≤2 years) |
| Stricter hand-arm vibration limits across ASEAN | – 0.4% | Core ASEAN (Indonesia, Thailand, Philippines, Malaysia, Vietnam) | Medium term (2-4 years) |
| Fiscal tightening slowing Indonesia’s Nusantara megaproject | – 0.3% | Indonesia, minor regional knock-on | Short term (≤2 years) |
| Source: ���ϲ����� | |||
Cobalt-Price Volatility Inflates Lithium-Ion Battery Costs
The Democratic Republic of the Congo (DRC) capped annual cobalt exports at 96,600 metric tons for 2026-2027, and spot prices jumped 90% in 2025 to reach USD 41,890 per ton. Nickel-manganese-cobalt (NMC) battery chemistries still dominate power-tool packs for their superior energy density, so OEMs without long-term offtake deals face margin pressure. The U.S. Inflation Reduction Act offers a USD 10 per kilowatt-hour credit for domestically made cells, but similar subsidies are scarce in Europe and Asia, widening regional cost gaps. Research into cobalt-free lithium-iron-phosphate (LFP) cells is gaining steam, though energy-density losses of around 18% limit adoption in heavy-duty rotary hammers for now. Should prices stay elevated, brands may shift toward partial-chemistry substitutions, potentially stalling the pace of cordless upgrades.
Skilled-Labor Shortages Create Tool Fleet Idle Time in North America
U.S. semiconductor construction will need 48,000 additional technicians by 2030, but training programs will supply fewer than 30,000 graduates. At the TSMC Arizona site, wage premiums have jumped 25%, yet completion of Phase 1 slipped to 2025, leaving large inventories of torque tools idle for months. Rental utilization fell below 50%, well under the 65-70% break-even norm, slowing replacement purchases of high-cost smart tools. Although the CHIPS Act sets aside funding for apprenticeships, two-year training cycles mean meaningful relief will not arrive before 2027. Immigration reforms that could ease the gap remain mired in political gridlock, preserving this near-term drag on equipment turnover.
Segment Analysis
By Mode of Operation: Cordless Platforms Cement Electric Dominance
Electric tools accounted for 62.45% of the power tools market share in 2025, underpinned by their expanding voltage ranges and rapid battery-cost declines. Cordless variants are on track for a 7.55% CAGR across 2026-2031, more than double the pace of corded units. Contractors cite freedom from extension cords, compliance with tighter emission rules, and shared batteries with electric excavators as key adoption factors. DEWALT’s 554-watt-hour POWERSHIFT packs now deliver 156 rebar cuts per charge, shrinking runtime anxiety on remote bridges. Meanwhile, Hilti’s Nuron 22 V system adds on-board connectivity that logs impact energy, satisfying quality-control clauses on data-center builds.
Pneumatic systems still dominate in vehicle assembly plants, where their spark-free operation remains indispensable. Yet falling compressor-maintenance budgets and emerging vibration limits are encouraging a switch to brushless electrics in many metal-fabrication cells. Hydraulic and engine-driven tools stay relevant for heavy demolition and deep-cutting jobs, but their volume is slipping as cordless breakers reach 45 joules of impact energy. ISO 21940 vibration-management standards, expected by 2028, could accelerate the retirement of high-vibration air hammers, reinforcing the long-term edge of advanced brushless lines.
Note: Segment shares of all individual segments available upon report purchase
By Product: Impact Drivers Race Ahead of Conventional Drills
Drilling and fastening commanded 31.34% of the power tools market in 2025, reflecting the ubiquity of rotary drills on every job site. The fastest climbers, however, are impact drivers and wrenches, forecast to post an 8.05% CAGR to 2031 as torque-critical tasks multiply in semiconductor fabs and wind-turbine towers. Milwaukee’s One-Key platform captures and stores torque values, allowing supervisors to pass quality audits quickly. Snap-on’s acquisition of Mountz brought micro-torque tools that can tighten EV battery modules to ±2% accuracy, a critical need for automakers pivoting to high-voltage packs.
Cordless cut-off saws and track saws now finish concrete grooves inside cleanrooms without fumes, reducing re-entry intervals for HVAC crews. Random-orbit sanders equipped with brushless motors are replacing orbital sanders among DIY remodelers seeking furniture-grade finishes. Demolition tools integrate vibration-dampening handles, helping contractors meet both EU and impending ASEAN exposure caps. Across categories, accessory sales bits, blades, wheels are growing even faster than primary units, cementing the business case for closed battery ecosystems that lock in recurring revenue.
By End-User: DIY Surge Narrows the Gap with Commercial Trades
Construction and infrastructure firms generated 45.76% of the power tools market size in 2025, buoyed by mega rail, metro, and chip-plant projects. Yet the residential and DIY cohort is on pace for an 8.15% CAGR through 2031, outstripping every professional segment. Home Depot derived 15% of its USD 40.2 billion third-quarter 2024 sales online, aided by how-to videos that demystify tool selection. Lowe’s saw 11% digital penetration in the same quarter, and it pilots augmented-reality paint and drill simulators that cut in-store returns.
Automotive assembly plants need calibrated torque tools for electric-vehicle battery packs, producing steady demand that rises in line with EV output. Aerospace factories require low-particle drills for composite fuselages, a niche where premium Swiss and German brands still enjoy pricing power. Energy producers, especially offshore wind-farm operators, want high-voltage cordless wrenches that can swap blades on remote nacelles without diesel gensets. As each vertical pursues specialized workflow gains, sellers with broad accessory ranges and digital-fleet dashboards are best positioned to cross-sell upgrades.
Note: Segment shares of all individual segments available upon report purchase
By Sales Channel: Online Platforms Carve Out Faster Growth
Offline distributors and home-center aisles still processed 78.88% of global unit sales in 2025, confirming the tactile importance of in-person demos. Even so, online outlets are forecast to grow at 8.10% per year to 2031, almost 250 basis points ahead of brick-and-mortar channels. Brand-owned stores capture higher gross margins and, crucially, first-party data that feeds loyalty programs and auto-replenishment reminders. Milwaukee’s Tool Link subscription lets contractors rent connected tools for monthly fees, ensuring access to the latest firmware without large upfront bills.
E-commerce marketplaces such as Amazon remain popular among DIYers, but professional buyers often avoid them due to counterfeit-product risks. Tightening data-privacy rules, including California’s Consumer Privacy Act and the EU’s GDPR, require consent management and encrypted storage, raising compliance costs for smaller sellers. As logistics networks shorten last-mile delivery times to under 24 hours in most tier-one cities, the convenience gap between store pickup and doorstep drop narrows, feeding the structural shift online.
Geography Analysis
Asia-Pacific captured 38.86% of the global power tools market in 2025 and is heading toward a 7.85% CAGR through 2031 as India, China, and Indonesia infuse billions of dollars into rail corridors, semiconductor fabs, and new capital districts. India’s construction gross domestic product advanced 8.6% in fiscal year 2024-2025, and its Manufacturing Value Added climbed 8.1%, supporting bulk orders for cordless hammers on metro and bridge jobs. Japan’s project pipeline, buoyed by post-Olympic disaster-resilience retrofits, lifted national construction orders to USD 106 billion in January–November 2024, a 9.8% jump that sustains replacement demand for vibration-controlled grinders. ASEAN regulators are rolling out EU-style vibration caps that restrict air-hammer usage, accelerating purchases of low-vibration brushless alternatives across Thailand, Vietnam, and the Philippines.
North America ranks second, powered by CHIPS Act awards and a rebound in U.S. single-family housing starts, which reached a 1.499 million annualized rate in December 2024. Canada’s 240,960 housing starts in 2024, together with Mexico’s near-shoring factory builds, sustain regional growth for compact impact drivers. However, skilled-labor shortages on megafab sites drag on tool-fleet utilization, while tariff volatility clouds sourcing costs for imported accessories. The Occupational Safety and Health Administration (OSHA) pushes adoption of vibration-monitoring software, stimulating demand for smart handle modules that can record exposure in real time.
Europe shows mature but steady demand, with green-building retrofits under the Energy Performance of Buildings Directive underpinning cordless-tool uptake. Germany’s renewable heating law drives heat-pump installs that rely heavily on hammer drills and screwdrivers able to operate in tight interior spaces. STIHL’s EUR 125 million battery-exclusive plant in Oradea, Romania, set for one million packs per year by 2026, signals a shift toward localized battery production that hedges logistics risk. The new EU Machinery Regulation, effective 2027, mandates cybersecurity by design, favoring established brands with in-house firmware teams. Elsewhere, Saudi Arabia’s Vision 2030 megaprojects and Egypt’s solar build-outs sustain Middle East and Africa sales, while Brazil’s housing recovery and Argentina’s lithium-mining camps anchor South America, although currency shocks in Turkey and Peru moderate regional averages.
Competitive Landscape
Market concentration is moderate, with the top five suppliers, such as Stanley Black & Decker, Techtronic Industries, Robert Bosch, Makita, and Hilti, holding roughly 45-50% of 2025 global revenue, while dozens of regional brands occupy price-sensitive niches. Stanley Black & Decker sold its USD 1.8 billion Consolidated Aerospace Manufacturing (CAM) unit in December 2025 and is pursuing a USD 2.1 billion cost-reduction program to raise gross margin to 35% by 2028. Techtronic Industries reported USD 15.26 billion in sales in 2025, kept a USD 700 million net-cash position, and authorized a USD 500 million share buyback that underpins R&D spending on 40-volt high-output packs. Bosch expanded its North Carolina accessory plant in 2023, adding 400 jobs to shorten lead times for drill bits and saw blades.
Acquisitions continue to redefine the competitive chessboard. Atlas Copco closed four deals between August 2025 and March 2026, including the USD 17.6 million buyout of Cypress Equipment Rental to bolster portable compressor distribution in the Gulf Coast. Snap-on’s USD 40 million purchase of Mountz widened its torque-tool suite for EV battery lines, a segment expected to post double-digit annual growth. STIHL opened a battery-exclusive factory in Romania, with capacity for 1.8 million packs and 1.7 million tools by 2028, signaling an aggressive tilt toward cordless lawn and garden segments.
In terms of strategy, incumbents are deepening ecosystem lock-ins through proprietary batteries, cloud telemetry, and subscription analytics. DEWALT’s Site Manager and Milwaukee’s One-Key each exceed 100 compatible models, turning tool fleets into data platforms that feed predictive-maintenance paywalls. Bosch and Makita focus on vertical integration in accessories to capture high-margin consumables. New entrants such as Positec and CSUN lean on Amazon storefronts and aggressive pricing, but the EU’s incoming cybersecurity rules and ASEAN’s vibration caps raise compliance barriers, likely preserving incumbents’ mid-term advantage.
Power Tools Industry Leaders
Stanley Black & Decker, Inc.
Robert Bosch GmbH
Techtronic Industries Co. Ltd.
Makita Corporation
Hilti Corporation
- *Disclaimer: Major Players sorted in no particular order
Recent Industry Developments
- March 2026: Atlas Copco acquired Cypress Equipment Rental, a Louisiana portable-compressor distributor generating USD 17.6 million in 2025 sales, to reinforce its Power Technique division.
- February 2026: DEWALT unveiled three 20 V MAX brushless cordless ratchets delivering up to 50 ft-lb torque, shipping March 2026 to automotive and industrial channels.
- February 2026: Atlas Copco agreed to buy vacuum-solution specialist LACO Technologies for USD 25 million, with closing expected in Q2 2026.
- January 2026: DEWALT introduced its POWERSHIFT 12-inch cut-off saw and 1-1/8-inch demolition hammer at World of Concrete, broadening its battery-powered concrete line.
Research Methodology Framework and Report Scope
Market Definitions and Key Coverage
Our study defines the global power tools market as every newly built hand-held or stationary device that draws electricity, compressed air, hydraulics, or small engines to replace manual effort in industrial, professional, or DIY tasks. The perimeter therefore spans drills, saws, grinders, impact drivers, nailers, wrenches, demolition, and material-removal tools, along with the integrated battery or motor shipped with each unit.
Scope exclusion: Rental revenue, stand-alone accessories, aftermarket parts, and medical or surgical powered instruments sit outside this assessment.
Segmentation Overview
- By Mode of Operation
- Electric
- Cordless
- Corded
- Pneumatic
- Hydraulic
- Engine-Driven
- Electric
- By Product
- Drilling & Fastening Tools
- Sawing & Cutting Tools
- Grinding & Polishing Tools
- Material Removal Tools (sanders, etc.)
- Demolition Tools (Breakers, Jackhammers)
- Impact Drivers & Wrenches
- Nailers & Staplers
- Others (heat guns, glue guns, mixers, speciality tools)
- By End-user
- Construction & Infrastructure
- Automotive
- Aerospace & Defense
- Energy & Power Generation
- Shipbuilding, Marine & Railways
- Manufacturing (Electronics, Metalworking, Wood Work, etc.)
- Residential / DIY
- Others (Utilities, Mining, etc.)
- By Sales Channel
- Offline
- Direct Industrial/ Distributor
- Mass Retail / Home Centers
- Online
- E-commerce Marketplaces
- Brand-Owned Digital Stores
- Offline
- By Region
- North America
- United States
- Canada
- Mexico
- South America
- Brazil
- Argentina
- Peru
- Rest of South America
- Europe
- United Kingdom
- Germany
- France
- Italy
- Spain
- BENELUX (Belgium, Netherlands, and Luxembourg)
- NORDICS (Denmark, Finland, Iceland, Norway, and Sweden)
- Rest of Europe
- Asia-Pacific
- China
- India
- Japan
- Australia
- South Korea
- ASEAN (Indonesia, Thailand, Philippines, Malaysia, Vietnam)
- Rest of Asia-Pacific
- Middle East and Africa
- Saudi Arabia
- United Arab Emirates
- Qatar
- Kuwait
- Turkey
- Egypt
- South Africa
- Nigeria
- Rest of Middle East and Africa
- North America
Detailed Research Methodology and Data Validation
Primary Research
Analysts followed up with interviews and short surveys of tool makers, lithium-ion cell vendors, distributors, and big-box buyers across Asia-Pacific, Europe, and North America. The conversations confirmed cordless penetration, average selling prices, and warranty return patterns that public data seldom covers.
Desk Research
We at ���ϲ����� began by linking HS-level trade lines from UN Comtrade, US Census, and Eurostat with Federal Reserve industrial production, global housing-start trackers, and S&P Global PMIs to anchor demand. Open briefs from the European DIY Retail Association, patent logs, company 10-Ks, plus paid feeds such as D&B Hoovers and Dow Jones Factiva added pricing color and competitive intent. These titles are illustrative; many additional publications supported evidence collection.
Market-Sizing & Forecasting
A single top-down build adds thirty-five economies' factory output to net imports to derive apparent consumption. It then cross-checks totals against sampled average selling price × shipment snapshots, a focused bottom-up pass that trims variance. Predictor variables, housing starts, light-vehicle production, infrastructure capex pipelines, lithium-ion battery cost curves, and cordless share migration feed a multivariate regression that shapes the 2025-2030 outlook. Scenario analysis overlays policy or cycle shocks.
Data Validation & Update Cycle
Every model clears dual analyst review; material variances prompt rapid call-backs, and outputs are reconciled with third-party gauges before sign-off. We refresh figures annually and issue interim tweaks whenever recalls, major M&A, or regulation changes move the baseline.
Power Tools Numbers Clients Can Trust
Published estimates often diverge because researchers choose unequal tool baskets, freeze exchange rates on different days, or project history forward without field checks. Our disciplined scope, country-specific variables, and yearly refresh keep drift low.
Key gap drivers include studies that drop pneumatic or hydraulic units, overlook DIY retail, or assume flat battery costs, whereas Mordor's model blends housing, industrial output, and e-commerce penetration for every country.
Benchmark comparison
| Market Size | Anonymized source | Primary gap driver |
|---|---|---|
| USD 76.96 B (2025) | ���ϲ����� | - |
| USD 39.50 B (2024) | Global Consultancy A | Excludes pneumatic & hydraulic units; constant 2023 FX |
| USD 32.95 B (2024) | Research Publisher B | Trend extrapolation; minimal primary checks |
| USD 28.56 B (2024) | Industry Insights C | Factory-gate shipments only; DIY retail omitted |
Together, the comparison shows that our transparent variables and multi-source triangulation give decision-makers a balanced, repeatable baseline they can rely upon.
Key Questions Answered in the Report
How large will the power tools market be by 2031?
The sector is forecast to reach USD 113.56 billion by 2031, expanding at an annual 6.8% clip from 2026 onward.
Which region is growing fastest?
Asia-Pacific leads, with a projected 7.85% CAGR thanks to infrastructure spending in India, China, and Indonesia.
Are cordless tools really displacing pneumatic models?
Yes, cordless units already hold the majority of electric-tool sales and are growing at 7.55% per year as battery energy density rises.
What is the main raw material risk for tool makers?
Cobalt supply from the DRC is volatile, and export caps have pushed spot prices up 90%, pressuring lithium-ion battery costs.
How are brands using connectivity?
Platforms such as Hilti Nuron and Milwaukee One-Key log torque, location, and usage data, enabling predictive maintenance and easier compliance audits.
Will online sales overtake brick-and-mortar outlets?
Online channels are the fastest growing at 8.10% annually, yet they still trail physical stores and are unlikely to surpass them before the decade ends.


