Power Electronics Market Size and Share
Market Overview
| Study Period | 2020 - 2031 |
|---|---|
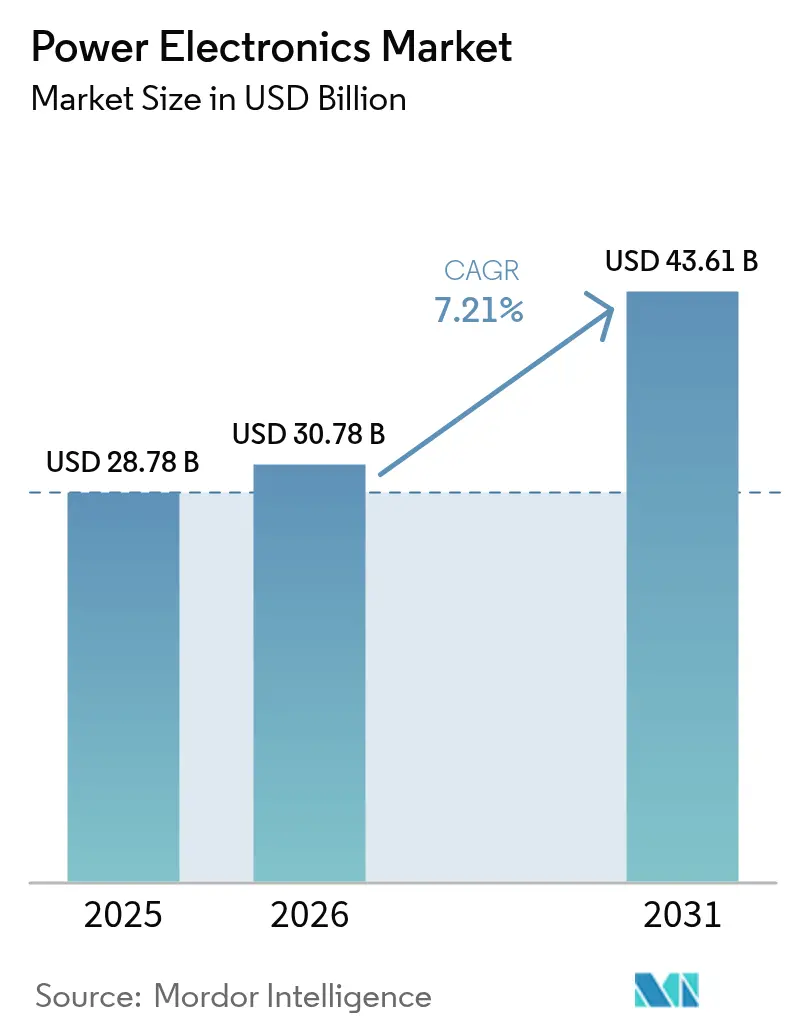
| Market Size (2026) | USD 30.78 Billion |
| Market Size (2031) | USD 43.61 Billion |
| Growth Rate (2026 - 2031) | 7.21% CAGR |
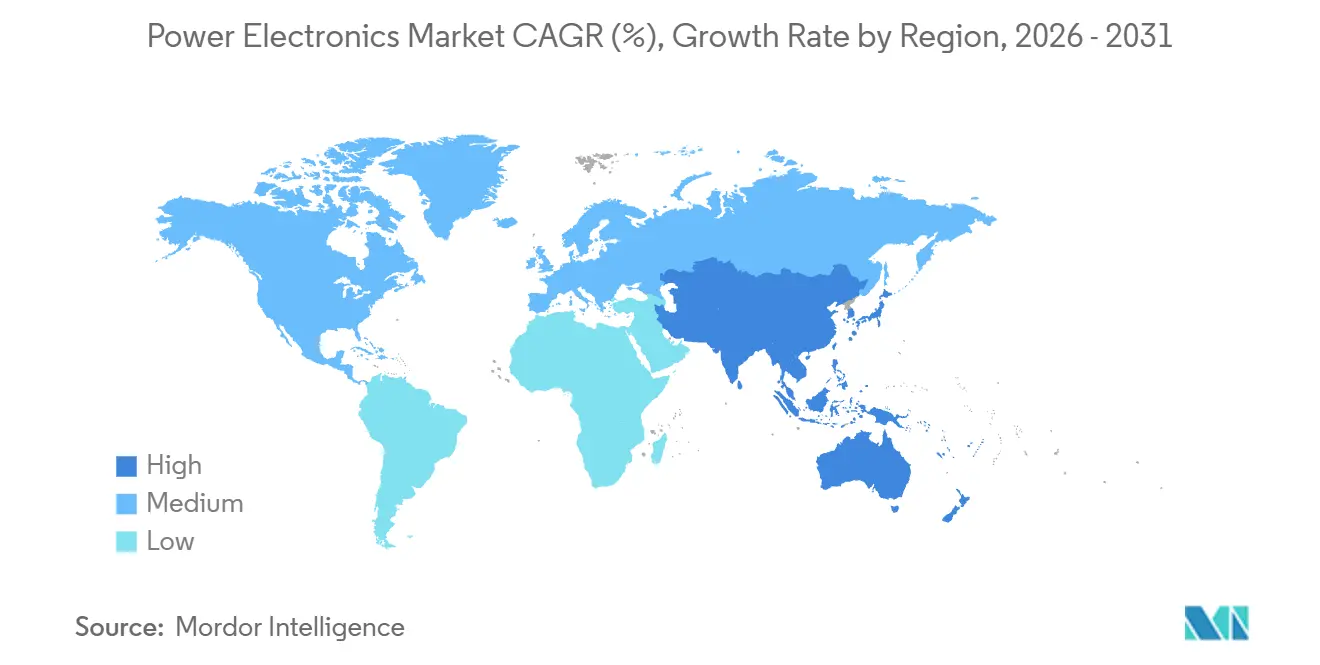
| Fastest Growing Market | Asia Pacific |
| Largest Market | Asia Pacific |
| Market Concentration | Medium |
Major Players*Disclaimer: Major Players sorted in no particular order Image © ���ϲ�����. Reuse requires attribution under CC BY 4.0. | |
Power Electronics Market Analysis by ���ϲ�����
The power electronics market size is projected to expand from USD 28.78 billion in 2025 and USD 30.78 billion in 2026 to USD 43.61 billion by 2031, registering a CAGR of 7.21% between 2026 to 2031. Architectural shifts toward wide-bandgap devices are compressing design cycles, compelling automakers, renewable-energy integrators, and telecom OEMs to migrate beyond the physical limits of silicon. Module revenue is already growing faster than discrete sales because factory-tested packages with embedded sensing shorten time-to-market for high-power systems. Asia-Pacific leads both volume and innovation as state-directed capacity additions in China and subsidy programs in Japan accelerate silicon-carbide (SiC) adoption. Competitive intensity is rising as integrated device manufacturers defend silicon incumbencies while fabless specialists capture design wins through superior thermal performance.
Key Report Takeaways
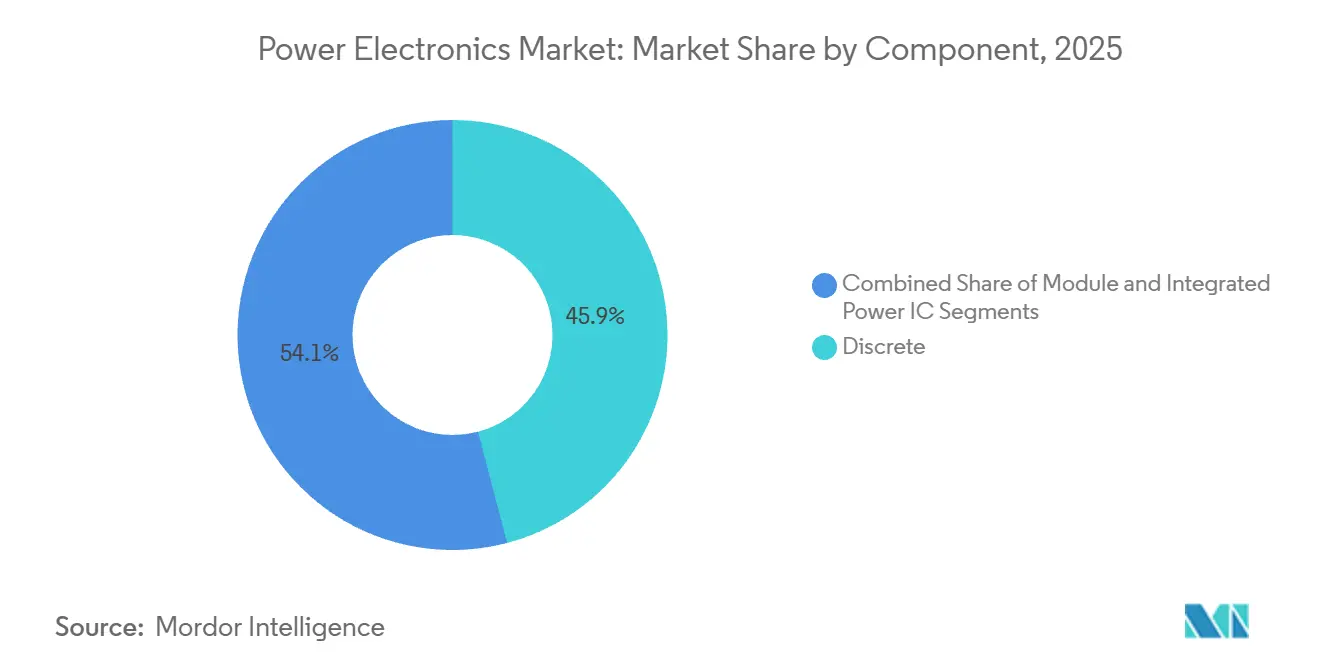
- By component, discrete devices commanded 45.91% of market share in 2025, while the modules segment is projected to advance at an 8.42% CAGR through 2031.
- By device type, MOSFETs segment led with 43.67% of market share in 2025, and is forecast to grow at the fastest 8.19% CAGR over 2026-2031.
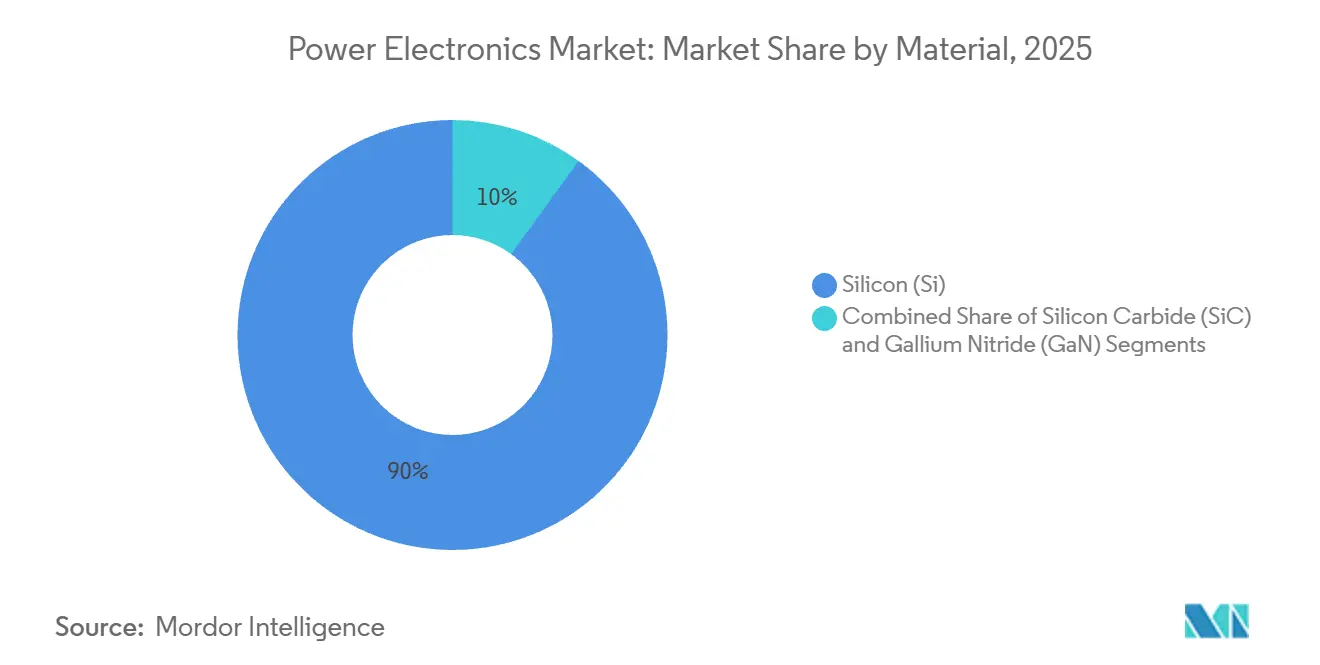
- By material, silicon retained a dominant 90.02% share in 2025, whereas silicon carbide is expected to expand at an 8.67% CAGR during the forecast period.
- By end-user industry, consumer electronics held 27.78% of the market share in 2025, yet the automotive segment is projected to register the highest CAGR of 9.12% through 2031.
- By geography, Asia-Pacific captured 41.94% of the share in 2025 and is anticipated to grow at an 8.35% CAGR through 2031.
Note: Market size and forecast figures in this report are generated using ���ϲ�����’s proprietary estimation framework, updated with the latest available data and insights as of 2026.
Global Power Electronics Market Trends and Insights
Drivers Impact Analysis*
| Driver | (~) % Impact on CAGR Forecast | Geographic Relevance | Impact Timeline |
|---|---|---|---|
| EV-Led Shift to 800-V and 1,000-V Architectures | +1.8% | Global, concentrated in China, Europe, North America | Medium term (2-4 years) |
| Rapid Build-out of Ultra-Fast Charging (>350 kW) Networks | +1.5% | Europe, North America, APAC urban corridors | Medium term (2-4 years) |
| Industrial Electrification of ≥7.5 kW Motor Drives | +1.2% | Global, led by APAC manufacturing hubs | Long term (≥4 years) |
| Telecom 5G Base-Station Roll-outs Requiring High-Efficiency RF PA | +1.0% | APAC, North America, Middle East | Short term (≤2 years) |
| Utility-Scale Battery Storage Creating Demand for Bi-Directional Converters | +0.9% | North America, Europe, Australia | Long term (≥4 years) |
| DoD Move to All-Electric Platforms Driving Ruggedized Devices | +0.6% | North America, Europe | Long term (≥4 years) |
| Source: ���ϲ����� | |||


EV-Led Shift to 800-V and 1,000-V Architectures
Carmakers are standardizing 800-V traction batteries to cut charging time in half and shrink copper mass, a transition that renders silicon IGBTs obsolete above 650-V blocking voltages due to conduction losses. Porsche, Hyundai, and General Motors validated SiC inverters that refill 10-80% state-of-charge in under 18 minutes, proving the commercial merit of higher voltage stacks. Chinese OEMs are already leaping to 1,000-V systems using SiC MOSFETs qualified for 200 °C junction temperatures, exposing supply-chain fragility whenever wafer shipments face geopolitical hurdles. As fleet operators adopt total-cost-of-ownership metrics, inverter replacement cycles fall from 15 to 8 years, advantaging module vendors with integrated gate-drive and protection circuitry. The resulting volume pull-through accelerates commitments for 200 mm and 300 mm SiC wafer capacity worldwide.
Rapid Build-Out of Ultra-Fast Charging (More than 350 kW) Networks
Charging network operators now deploy 350 kW dispensers that match the charging acceptance rates of 800-V vehicles, creating derived demand for SiC rectifiers capable of continuous 97% efficiency without forced-air cooling.[1]IONITY Expands Ultra-Fast Charging Network Across UK, IONITY, ionity.eu Funding from the United States Department of Energy and similar European programs specifies SiC power stages to meet uptime and energy-efficiency mandates. Thermal cycling remains the primary failure mode because quick transitions from idle to peak load stress traditional wire-bond packages. Infineon’s copper-clip interconnect extends mean-time-between-failure beyond 1 million cycles, lowering the total cost of ownership for vertically integrated network operators able to amortize higher semiconductor bills across multi-site deployments.
Industrial Electrification of ≥7.5 kW Motor Drives
Variable-frequency drives exceeding 7.5 kW must achieve sub-2% losses under IEC 61800-9-2, a target unattainable with silicon IGBTs. SiC-based drives introduced by ABB and Danfoss in 2025 deliver 98.5% efficiency, cutting electricity consumption by 12% in HVAC and pumping applications. Payback periods shorten to under two years in Asia-Pacific factories where tariffs exceed USD 0.15 per kilowatt-hour, encouraging procurement departments to make SiC the default in retrofit projects. Multinational corporations now require ISO 50001 compliance from suppliers, indirectly locking SiC into global upgrade cycles and expanding the addressable base for high-efficiency modules.
Telecom 5G Base-Station Roll-Outs Requiring High-Efficiency RF PA
Massive-MIMO 5G radios demand gallium-nitride RF power amplifiers that deliver 50% power-added efficiency at 3.5 GHz, double the performance of gallium-arsenide devices.[2]NEC Deploys GaN-Based Power Amplifiers in 5G Base Stations, NEC Corporation, nec.com NEC and Qorvo demonstrated 30% reductions in cooling infrastructure by adopting GaN, enabling denser urban site placement and lowering operational costs. Limited 150 mm epi-wafer capacity has extended lead times to 26 weeks, but the higher component price is offset within 18 months by energy savings that satisfy 3GPP Release 17 efficiency rules. The result is steady GaN penetration across telecom and defense radar platforms, diversifying revenue streams for wide-bandgap suppliers.
Restraints Impact Analysis*
| Restraint | (~) % Impact on CAGR Forecast | Geographic Relevance | Impact Timeline |
|---|---|---|---|
| Limited 200 mm SiC Wafer Capacity | -1.4% | Global, acute in North America and Europe | Medium term (2-4 years) |
| Thermal-Management Limits > 1.2 kV Package Classes | -1.1% | Global, most severe in utility-scale applications | Long term (≥4 years) |
| High CAPEX of Wide-Bandgap Fabs for New Entrants | -0.8% | Global, entry barrier for APAC and emerging markets | Long term (≥4 years) |
| Geopolitical Critical-Mineral Supply Risks | -0.7% | Global, concentrated risk in gallium supply | Medium term (2-4 years) |
| Source: ���ϲ����� | |||
Limited 200 mm SiC Wafer Capacity
SiC substrate output lags demand because only a handful of fabs have mastered 200 mm boule growth at acceptable defect densities, keeping die costs well above silicon.[3] Investor Presentation Q1 2025, Wolfspeed, wolfspeed.com STMicroelectronics’ Catania line and Wolfspeed’s Mohawk Valley plant together satisfy less than one-fifth of projected 2026 automotive needs, forcing OEMs to dual-source silicon and SiC inverters. Device makers pad die area to accommodate substrate defects, sacrificing die-per-wafer economics and extending lead times to 52 weeks for qualified modules. Until 300 mm production achieves yield parity, unlikely before 2028, capacity shortages will cap near-term growth despite robust order books.
Thermal-Management Limits More than 1.2 kV Package Classes
Power modules rated above 1.2 kV can generate more than 300 W/cm² during switching transients, overwhelming direct-bonded-copper substrates unless designers add liquid cooling, which adds cost and volume. Mitsubishi Electric’s 3.3 kV solar-inverter modules require forced-liquid systems that expand enclosure sizes by 35%. Although sintered-silver die attach narrows the conductivity gap, the mismatch between SiC and epoxy adhesives remains a bottleneck. Because SEMI thermal-resistance guidelines are voluntary, inverter integrators face variability of up to 40% across vendors, complicating system-level thermal budgets and delaying large-scale roll-outs in utility-scale renewables.
*Our updated forecasts treat driver/restraint impacts as directional, not additive. The revised impact forecasts reflect baseline growth, mix effects, and variable interactions.
Segment Analysis
By Component: Modules Gain Traction In High-Power Applications
Discrete devices accounted for 45.91% of share in 2025, underscoring their entrenched role in consumer and low-power industrial products. However, modules segment is expanding at an 8.42% CAGR as integrators embrace factory-tested packages that embed gate-drivers and temperature sensors. The crossover appears near the 10 kW threshold, where the cost of assembling discrete parts exceeds the premium for a qualified module. ON Semiconductor’s EliteSiC M3e family integrates Kelvin-source sensing to enable real-time junction-temperature feedback, a feature that satisfies stringent automotive warranty requirements.
Module growth is altering supply-chain economics, because substrate fabrication and sintered-silver die attach demand capital-intensive lines that favor vertically integrated giants. Integrated power ICs, while competitive below 100 W in USB-C adapters, face latch-up risks above 200 W, funneling most medium- and high-power innovation toward modular architectures. Longer term, 300 mm SiC wafers could lower module prices by 35%, triggering substitution of discrete devices in mid-power segments and further boosting the power electronics market.


By Device Type: MOSFETs Dominate Wide-Bandgap Migration
The MOSFETs segment captured 43.67% of the share in 2025 and is projected to rise at an 8.19% CAGR through 2031, led by SiC MOSFETs in xEV inverters and GaN MOSFETs in fast chargers. IGBTs retain a foothold in industrial drives and railway traction, though their share is shrinking as voltage thresholds and switching-frequency ceilings limit compliance with modern efficiency standards. Thyristors and diodes remain niche for legacy rectifiers and HVDC links. Renesas’ RAA2211xx GaN stage squeezes a half-bridge pair and driver into a 5 mm × 6 mm package, proving that monolithic integration can displace silicon super-junction MOSFETs in the sub-100 W class.
The MOSFET landscape is bifurcated; silicon devices dominate cost-sensitive consumer electronics, while SiC commands automotive and industrial volumes above 650 V. Hybrid concepts such as Toshiba’s IEGT stretch silicon’s relevance by merging low conduction loss with faster switching, yet cannot match SiC’s thermal ceiling. Synchronous rectification architectures are eroding diode revenue because actively controlled MOSFET pairs eliminate forward-voltage drops in data centers and telecom power supplies, bolstering the power electronics market size for MOSFETs.
By Material: Silicon Carbide Erodes Silicon’s Volume Share
Silicon still accounted for 90.02% of the share in 2025 due to mature tooling and low wafer costs, but silicon carbide is expanding at an 8.67% CAGR as xEV makers lock in multi-year supply agreements. Gallium nitride addresses sub-650 V, high-frequency topologies such as RF PAs and 65-W phone chargers, where its electron-mobility advantage enables megahertz switching. ROHM’s fourth-generation SiC MOSFET reduced on-resistance by 40%, allowing 99% efficient 6.6 kW onboard chargers that extend driving range without battery upgrades.
Supply constraints shape material adoption curves; SiC wafer lead times average 40 weeks versus 12 weeks for silicon, so device vendors prioritize high-margin automotive orders. GaN-on-silicon leverages existing 200 mm fabs to cut costs but sacrifices thermal headroom, confining its use to under-200 W products. As governments subsidize domestic wide-bandgap fabs, regional supply chains will diversify, but silicon will remain dominant in segments where efficiency mandates are absent and pricing is paramount.
By End-User Industry: Automotive Overtakes Consumer Electronics Growth
Consumer electronics held 27.78% of share in 2025, anchored by chargers and TV power supplies, but price erosion limits future upside. Automotive is the fastest-growing vertical, with a 9.12% CAGR, because regulatory zero-emission mandates justify SiC’s higher bill of materials. ICT and telecom infrastructure also expand as edge computing densifies networks, while industrial sectors pivot to SiC to meet corporate carbon-reduction goals. Fluence Energy’s 2.4 GWh storage project in Virginia illustrates how stationary battery systems borrow automotive-grade bi-directional inverters for grid services.
Defense programs like the U.S. Army’s electric vehicle initiative specify ruggedized SiC modules qualified for 125 °C ambient and 50-G shock loads, creating high-margin niches for vertically integrated suppliers. Industrial adoption remains uneven: multinational manufacturers retrofit drives early to meet ISO 50001 targets, while small enterprises postpone upgrades until existing assets depreciate. The resulting demand pattern widens the power electronics market's application footprint without diluting average selling prices.
Geography Analysis
Asia-Pacific captured 41.94% of the share in 2025 and is projected to advance at an 8.35% CAGR through 2031. China dominates xEV output and has issued subsidies that have lifted domestic SiC substrate capacity to beyond 500,000 wafers per year by 2025, while Japan channels JPY 200 billion (USD 1.4 billion) toward wide-bandgap fabs to secure a 30% global share by 2030. South Korea scales GaN-on-SiC epi capacity for telecom PAs, complementing the regional ecosystem.
North America benefits from CHIPS Act outlays of USD 2 billion for ON Semiconductor and USD 750 million for Wolfspeed, but its power-electronics market share lags Asia-Pacific because local xEV adoption remains slower. Still, federal incentives accelerate domestic SiC crystal growth and packaging, de-risking supply chains for Detroit automakers. Europe enforces a 2035 internal-combustion ban, driving SiC inverter demand, while Fraunhofer IISB leads 300 mm SiC research.
South America contributes marginal volume, with Brazil’s wind corridor prompting utility-scale inverter imports. The Middle East and Africa are nascent but notable; Saudi Arabia’s NEOM invests in SiC-based HVDC, and South Africa’s grid instability spurs storage deployments. Geographic fragmentation increases capital intensity as firms duplicate fabs to align with local content rules, reinforcing regional ecosystems and embedding the phrase power electronics market in government policy discourse.

Competitive Landscape
The competitive landscape remained moderately concentrated, with players including Infineon, Mitsubishi Electric, ON Semiconductor, STMicroelectronics, and others. Vertical integration is the dominant strategy; Infineon bought GaN Systems, and Renesas took Transphorm to secure epitaxial know-how and offset silicon IGBT commoditization. Wide-bandgap specialists such as Wolfspeed and Navitas thrive by focusing on thermal performance rather than wafer scale.
Packaging innovation is now a critical differentiator. Infineon’s copper-clip .XT bonds deliver 1 million thermal cycles, satisfying automotive reliability tests. Patent filings in 2024-2025 shifted toward system-level IP in gate-driver integration and fault-protection logic, reflecting customer demand for turnkey solutions. Compliance with ISO 26262 functional-safety adds 18-24 months of qualification, favoring incumbents that can fund prolonged test regimes.
Smaller players leverage GaN’s compatibility with mainstream silicon fabs, avoiding the high capital cost of SiC boule growth. Yet the thermal ceiling of GaN confines these challengers to sub-200 W or telecom bands. White-space opportunities persist in >1.2 kV SiC modules for utility-scale solar and wind and in GaN-on-silicon devices aiming for cost parity with silicon super-junction MOSFETs, keeping the power electronics market dynamic and open to disruptors.
Power Electronics Industry Leaders
ON Semiconductor Corporation
ABB Ltd.
Infineon Technologies AG
Texas instruments Inc.
ROHM Co. Ltd
- *Disclaimer: Major Players sorted in no particular order

Recent Industry Developments
- February 2026: Infineon Technologies began production at its expanded Villach, Austria SiC fab, adding 200 mm capacity equal to 50,000 automotive modules per year. The EUR 2 billion (USD 2.2 billion) investment secured multi-year supply deals with Volkswagen and BMW.
- January 2026: STMicroelectronics partnered with Geely Automobile to co-develop 1,000-V SiC modules for Geely’s next electric-vehicle platform, establishing exclusivity through 2030.
- December 2025: ON Semiconductor completed a USD 2 billion expansion of its Hudson, New Hampshire fab, doubling EliteSiC MOSFET output and achieving IATF 16949 qualification.
- November 2025: Wolfspeed obtained a USD 750 million U.S. DoE loan guarantee to accelerate its Siler City, North Carolina 200 mm SiC fab, targeting volume production in Q3 2026.


Global Power Electronics Market Report Scope
Power electronics include components such as capacitors, inductors, and other semiconductor devices used in the power management of various systems. Moreover, power electronics integrate energy, control systems, and electronic devices.
The Power Electronics Market Report is Segmented by Component (Discrete, Module, and Integrated Power IC), Device Type (MOSFET, IGBT, Thyristor, and Diode), Material (Silicon, Silicon Carbide, and Gallium Nitride), End-User Industry (Consumer Electronics, Automotive, ICT and Telecommunication, Industrial, Energy and Power, Aerospace and Defense, and Healthcare), and Geography (North America, South America, Europe, Asia-Pacific, and Middle East and Africa). The Market Forecasts are Provided in Terms of Value (USD).
| Discrete |
| Module |
| Integrated Power IC |
| MOSFET |
| IGBT |
| Thyristor |
| Diode |
| Silicon (Si) |
| Silicon Carbide (SiC) |
| Gallium Nitride (GaN) |
| Consumer Electronics |
| Automotive (xEV, Charging) |
| ICT and Telecommunication |
| Industrial (Drives, Automation) |
| Energy and Power (Renewables, HVDC) |
| Aerospace and Defense |
| Healthcare |
| North America | United States | |
| Canada | ||
| Mexico | ||
| South America | Brazil | |
| Argentina | ||
| Rest of South America | ||
| Europe | Germany | |
| United Kingdom | ||
| France | ||
| Italy | ||
| Rest of Europe | ||
| Asia-Pacific | China | |
| Japan | ||
| South Korea | ||
| Australia | ||
| India | ||
| Rest of Asia-Pacific | ||
| Middle East and Africa | Middle East | Saudi Arabia |
| United Arab Emirates | ||
| Turkey | ||
| Rest of Middle East | ||
| Africa | South Africa | |
| Egypt | ||
| Rest of Africa | ||
| By Component | Discrete | ||
| Module | |||
| Integrated Power IC | |||
| By Device Type | MOSFET | ||
| IGBT | |||
| Thyristor | |||
| Diode | |||
| By Material | Silicon (Si) | ||
| Silicon Carbide (SiC) | |||
| Gallium Nitride (GaN) | |||
| By End-User Industry | Consumer Electronics | ||
| Automotive (xEV, Charging) | |||
| ICT and Telecommunication | |||
| Industrial (Drives, Automation) | |||
| Energy and Power (Renewables, HVDC) | |||
| Aerospace and Defense | |||
| Healthcare | |||
| By Geography | North America | United States | |
| Canada | |||
| Mexico | |||
| South America | Brazil | ||
| Argentina | |||
| Rest of South America | |||
| Europe | Germany | ||
| United Kingdom | |||
| France | |||
| Italy | |||
| Rest of Europe | |||
| Asia-Pacific | China | ||
| Japan | |||
| South Korea | |||
| Australia | |||
| India | |||
| Rest of Asia-Pacific | |||
| Middle East and Africa | Middle East | Saudi Arabia | |
| United Arab Emirates | |||
| Turkey | |||
| Rest of Middle East | |||
| Africa | South Africa | ||
| Egypt | |||
| Rest of Africa | |||


Key Questions Answered in the Report
How large will the power electronics market be by 2031?
It is projected to reach USD 43.61 billion by 2031, up from USD 30.78 billion in 2026.
Which region is growing fastest?
Asia-Pacific leads with an 8.35% CAGR through 2031, driven by aggressive xEV production and government incentives.
Why are modules gaining share over discrete devices?
Pre-packaged modules embed sensing and protection, cutting design time and meeting reliability targets above 10 kW.
What is driving silicon carbide adoption in vehicles?
800-V and 1,000-V battery systems need SiC MOSFETs to hit fast-charging and efficiency goals that silicon cannot achieve.
What limits wider use of SiC today?
Global output of 200 mm SiC wafers is constrained, leading to 40-week lead times and higher device costs.
Page last updated on:


