Market Overview
| Study Period | 2021 - 2031 |
|---|---|
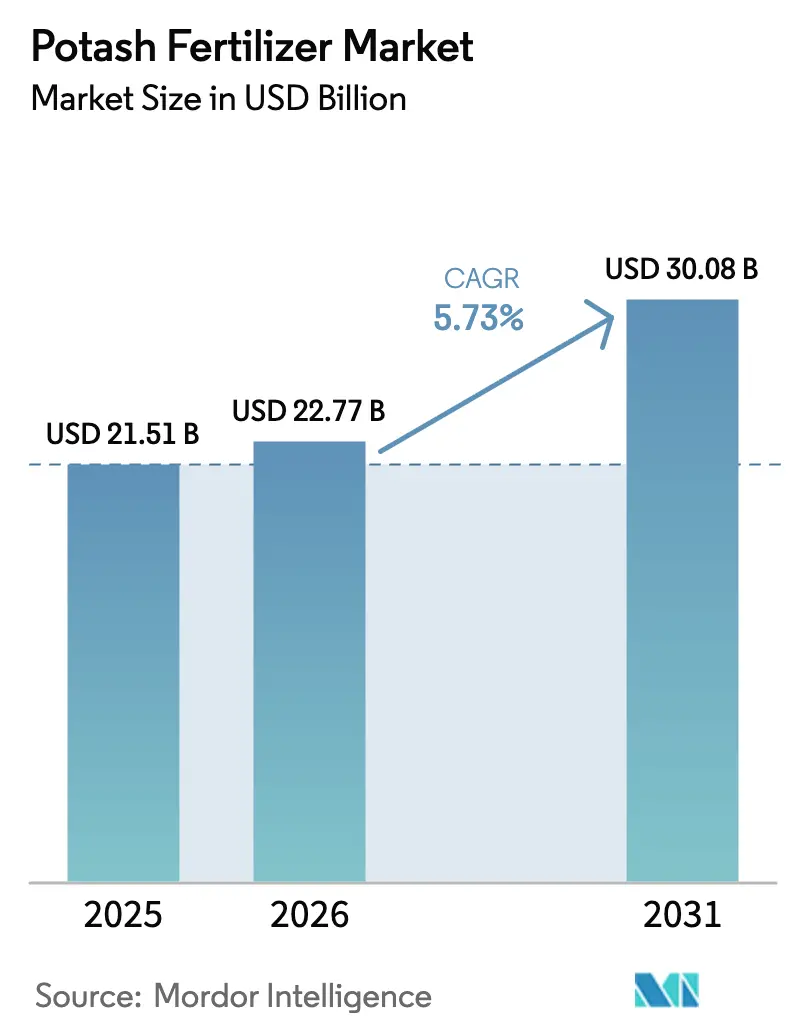
| Market Size (2026) | USD 22.77 Billion |
| Market Size (2031) | USD 30.08 Billion |
| Growth Rate (2026 - 2031) | 5.73% CAGR |
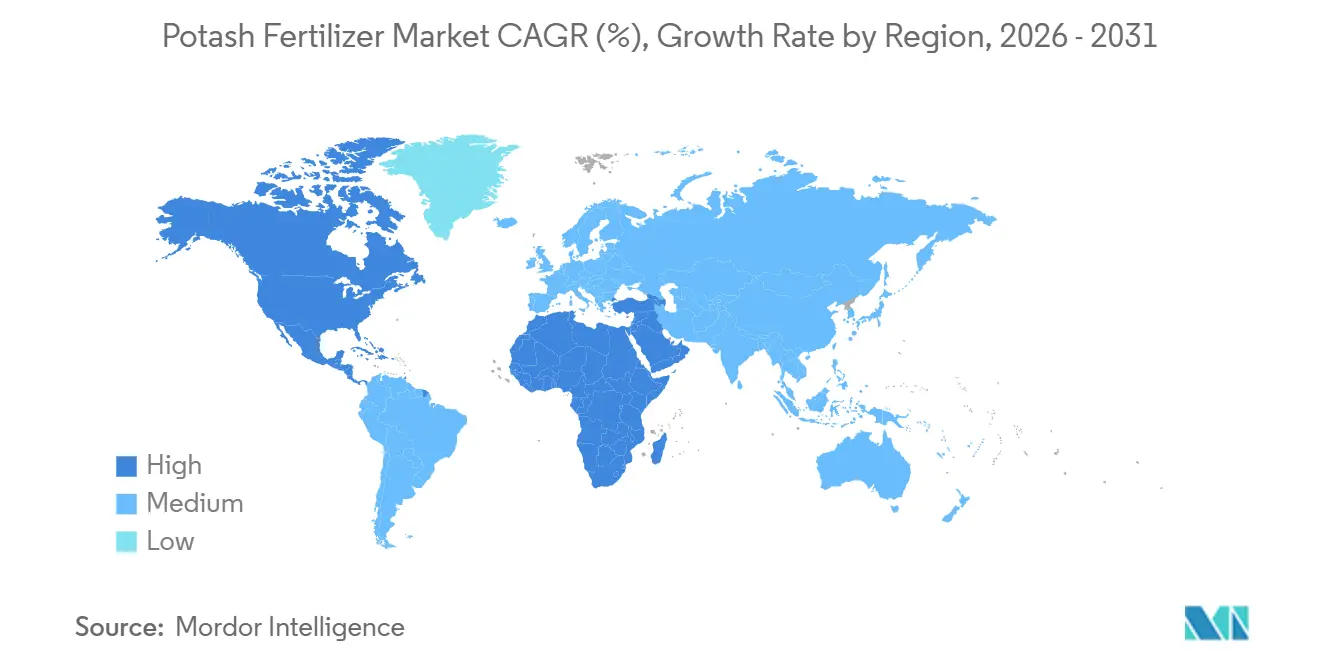
| Fastest Growing Market | North America |
| Largest Market | Asia-Pacific |
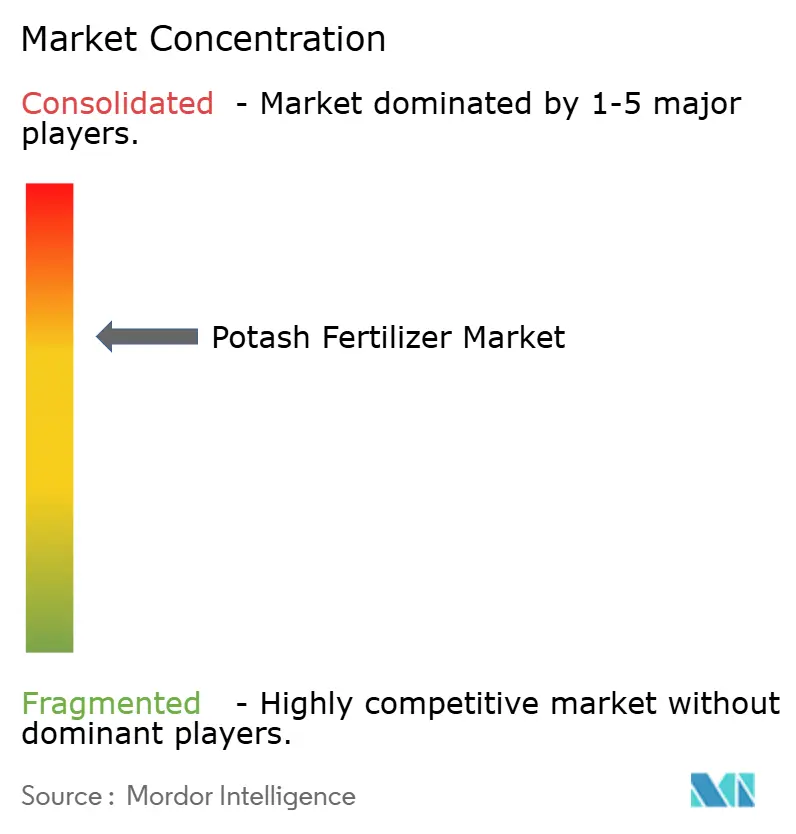
| Market Concentration | Medium |
Major Players *Disclaimer: Major Players sorted in no particular order Image © ���ϲ�����. Reuse requires attribution under CC BY 4.0. | |
Potash Fertilizer Market Analysis by ���ϲ�����
The potash market size is projected to expand from USD 21.51 billion in 2025 and USD 22.77 billion in 2026 to USD 30.08 billion by 2031, registering a CAGR of 5.73% between 2026 to 2031. Factors such as soil-nutrient depletion in intensively farmed regions, the adoption of precision-application technologies that optimize potassium doses per square meter, and continued government subsidies in Asia and Africa are driving demand. Soil-nutrient depletion is particularly critical in regions with high agricultural intensity, where repeated cropping cycles have significantly reduced potassium levels, necessitating increased potash application. Precision-application technologies are enabling farmers to apply potassium more efficiently, reducing waste and improving crop yields. Government subsidies in Asia-Pacific and Africa are further incentivizing farmers to adopt potash fertilizers, ensuring food security in these regions. On the supply side, growth is concentrated in Canada and the Middle East, while sanctions on Belaruskali are maintaining a tight global supply-demand balance. Corporate net-zero commitments are increasing demand for low-carbon and low-chloride potash grades, leading to higher price premiums for sulfate of potash. Although volatile natural gas prices are raising compound-fertilizer costs, forward projections indicate moderate easing by late 2026, which could improve potash affordability.
Key Report Takeaways
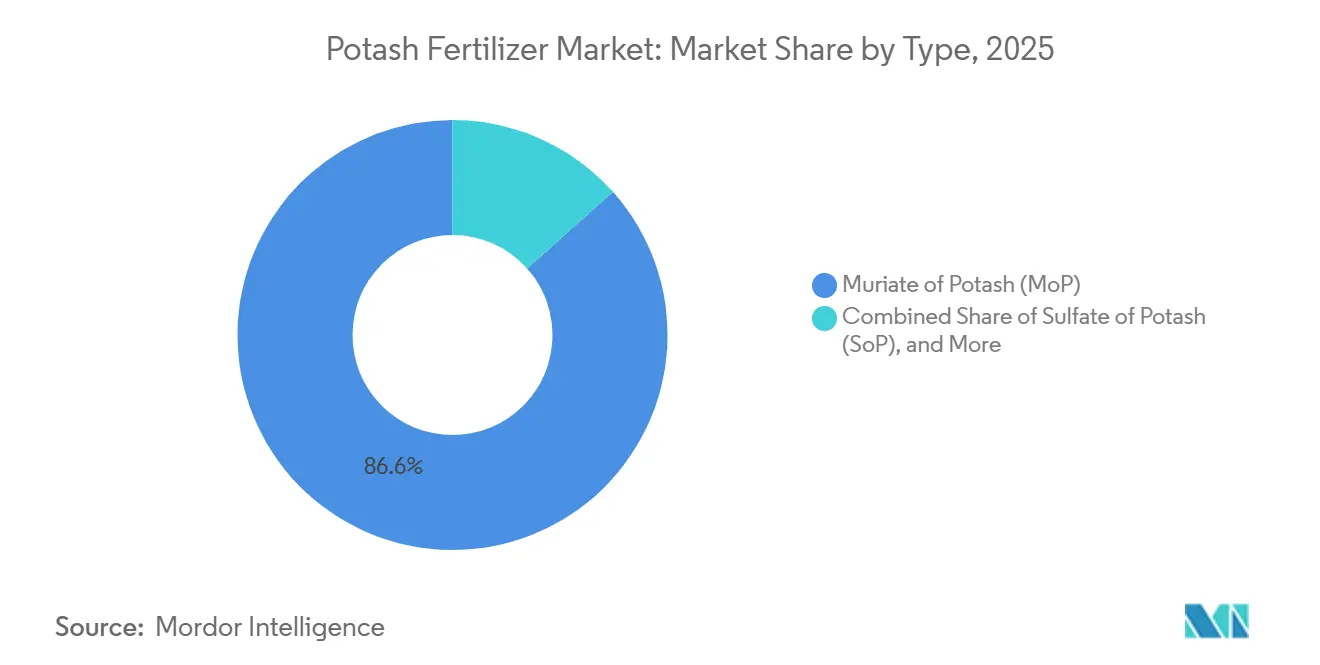
- By type, muriate of potash (MoP) led with an 86.6% of the potash fertilizer market share in 2025, while sulfate of potash (SoP) is projected to expand at a 6.1% CAGR through 2031.
- By application mode, soil application held 91.3% of the potash fertilizer market size in 2025, and fertigation is projected to grow at a 6.7% CAGR between 2026 and 2031.
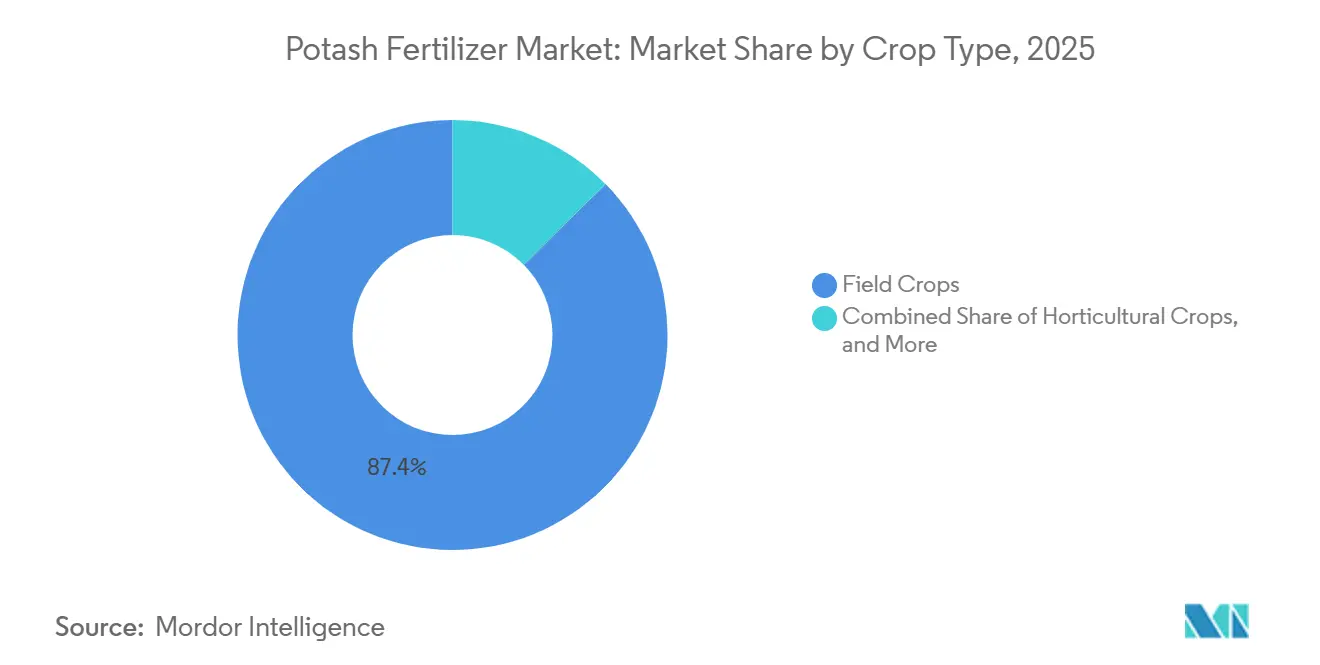
- By crop type, field crops accounted for 87.4% share in 2025, whereas turf and ornamental applications are set to grow at a 6.9% CAGR to 2031.
- By geography, Asia-Pacific accounted for the largest regional share in 2025, at 41.9%. Whereas North America is set to grow at a 7.1% CAGR to 2031.
- Market concentration is moderate, with the top five companies, The Mosaic Company, K+S Aktiengesellschaft, Nutrien Ltd., EuroChem Group AG, and Sinofert Holdings Limited (Sinochem Group Co., Ltd.), collectively holding the majority of the market share in 2025.
Note: Market size and forecast figures in this report are generated using ���ϲ�����’s proprietary estimation framework, updated with the latest available data and insights as of 2026.
Global Potash Fertilizer Market Trends and Insights
Drivers Impact Analysis*
| Driver | (~) % Impact on CAGR Forecast | Geographic Relevance | Impact Timeline |
|---|---|---|---|
| Rising soil nutrient depletion in intensively farmed regions | +1.2% | South Asia, Sub-Saharan Africa, and Brazilian Cerrado | Long term (≥ 4 years) |
| Accelerating adoption of precision-application technologies among large growers | +0.9% | North America and European Union | Medium term (2-4 years) |
| Shifting Chinese feed regulations toward grain-based livestock rations | +0.7% | China, and spillover Southeast Asia | Medium term (2-4 years) |
| Post-pandemic food-security subsidy programs across Asia-Pacific and Africa | +0.8% | South Asia, Southeast Asia, and Sub-Saharan Africa | Short term (≤ 2 years) |
| Potash demand from green-hydrogen salt caverns for seasonal storage | +0.4% | Germany, the Netherlands, Texas, and Alberta | Long term (≥ 4 years) |
| Corporate net-zero pledges driving use in low-chloride soils | +0.3% | North America, Europe, and Japan | Medium term (2-4 years) |
| Source: ���ϲ����� | |||
Rising Soil Nutrient Depletion in Intensively Farmed Regions
Global cropland is increasingly falling below critical potassium thresholds, a trend driven by hybrid corn and soybean varieties that extract more K₂O per metric ton of grain. India confirmed that 38% of the districts sampled in 2024 were potassium-deficient, a marked rise from 29% in 2019, because subsidized nitrogen crowds out balanced fertilization[1]Source: Ministry of Agriculture and Farmers Welfare, India, “Soil Health Card Report 2024,” agricoop.gov.in. Brazil’s Embrapa reported soybean yield losses on low-potassium Oxisols, leading to recommendations for split applications that increase total potash application rates per hectare. Comparable trends are observed in the African Savannah belt, where five-year nutrient balance sheets indicate a net potassium export of over 20 kg/ha annually. In Europe and the United States, adoption of ISO 11074 soil-testing protocols is expanding, enabling the creation of prescription maps that align potash application rates with depletion zones.
Accelerating Adoption of Precision-Application Technologies Among Large Growers
A significant percentage of North American farms exceeding 500 hectares employed sensor-guided spreaders and satellite imagery, achieving notable reductions in waste while meeting yield targets. These technologies facilitate precise input application, enhancing resource efficiency and sustainability. Deere & Company and CNH Industrial N.V. supplied a substantial number of GPS-enabled controllers, representing a considerable year-on-year increase. This growth reflects the rising adoption of precision agriculture tools to optimize farm operations. In Europe, this hardware integrates Copernicus imagery to identify potassium-stress zones early, facilitating micro-dosing that reduces fertilizer costs and minimizes environmental impact. Cooperative-sharing models and service contractors are emerging to improve accessibility, enabling broader adoption of these advanced technologies.
Shifting Chinese Feed Regulations Toward Grain-Based Livestock Rations
Beijing is implementing a long-term strategic plan to secure its food supply, with a specific focus on reducing reliance on imported soybeans and grains for animal feed. The objective is to transform its livestock feed sector by 2030. Meeting the target requires an estimated 25 million new grain acres or equivalent yield gains, both of which demand higher potash inputs to sustain field productivity. Provincial governments are fast-tracking rail upgrades to move fertilizer from coastal ports to inland locations, trimming historical delays during spring planting. Domestic producers are also blending smaller chloride loads to suit high-value vegetable hubs around Shandong, broadening product mix beyond bulk Muriate of Potash. These converging steps anchor a robust Asia-Pacific demand base for the potash fertilizer market through at least 2030.
Potash Demand From Green-Hydrogen Salt Caverns for Seasonal Storage
Eighteen hydrogen storage projects, with a combined capacity of 6.2 terawatt-hours, are under construction in Germany, the Netherlands, Texas, and Alberta. These projects are anticipated to produce brines rich in potassium chloride starting in 2027[2]Source: International Energy Agency, “Hydrogen Projects Database 2026,” iea.org. Storengy’s Etzel cavern alone is projected to generate 420,000 metric tons of potash-bearing brine annually. Although this output is modest compared to global consumption, it provides a low-carbon feedstock that supports corporate climate goals. The scalability of this resource will depend on offtake agreements and the development of processing infrastructure. Additionally, these projects represent a significant step toward integrating hydrogen storage with resource recovery, offering an opportunity to reduce environmental impact while meeting industrial demand for potassium chloride. The success of these initiatives will hinge on advancements in brine-processing technologies and on collaboration among stakeholders to ensure the efficient use of the extracted resources.
Restraints Impact Analysis*
| Restraint | (~) % Impact on CAGR Forecast | Geographic Relevance | Impact Timeline |
|---|---|---|---|
| Geopolitical sanctions limiting Belaruskali exports | –0.6% | Europe and North America | Medium term (2-4 years) |
| Volatile natural-gas prices inflating downstream fertilizer costs | –0.5% | Europe and South Asia | Short term (≤ 2 years) |
| Rising adoption of regenerative farming that lowers synthetic-input intensity | –0.4% | North America, Europe, and Australia | Long term (≥ 4 years) |
| Infrastructure bottlenecks at Brazilian inland ports | –0.3% | Brazil Mato Grosso and Goias | Medium term (2-4 years) |
| Source: ���ϲ����� | |||
Geopolitical Sanctions Limiting Belaruskali Exports
Western sanctions imposed in 2022 sidelined millions of metric tons of capacity, leading to freight premiums of several dollars per metric ton for replacement volumes sourced from Canada, Russia, and the Middle East. The European Union has extended these restrictions until December 2026, while United States Treasury regulations prohibit dollar-based transactions with Belaruskali[3]Source: U.S. Department of the Treasury, “Belarus Sanctions FAQ,” home.treasury.gov. Rail and port limitations restrict further expansion. This redirection highlights the shifting trade dynamics in the global market, as producers adapt to geopolitical and logistical challenges. Supply constraints are anticipated to persist until new mines in Canada and Ethiopia reach full operational capacity after 2028, which is projected to alleviate market tightness and stabilize freight premiums.
Rising Adoption of Regenerative Farming That Lowers Synthetic-Input Intensity
The global acreage under regenerative protocols is projected to increase in the coming years. Participants are anticipated to reduce synthetic potash usage as organic matter levels rise. These practices focus on improving soil health, enhancing water retention, and decreasing reliance on chemical inputs, thereby supporting sustainable agricultural systems. In 2024, the United States Department of Agriculture’s Conservation Stewardship Program allocated significant funding to support these practices across a large area, reflecting a notable year-on-year increase. Additionally, European buyers are offering price premiums for grain produced under regenerative labels, promoting broader adoption and providing economic incentives for farmers. Long-term trials conducted in the United States Midwest indicate stable soil potassium levels after 5 years, resulting in reduced annual fertilizer requirements. However, higher initial application rates during the transition period partially mitigate the short-term decline in demand.
*Our updated forecasts treat driver/restraint impacts as directional, not additive. The revised impact forecasts reflect baseline growth, mix effects, and variable interactions.
Segment Analysis
By Type: Cost-Effective Muriate of Potash (MoP) Anchors Demand, Sulfate of Potash (SoP) Leads Growth
Muriate of potash (MoP) accounted for 86.6% of the potash fertilizer market share in 2025. Field crops such as corn and sugar beets benefit from chloride, reinforcing MoP dominance. Potash fertilizer market size gains in the segment also stem from Saskatchewan’s capital programs and Middle East brine expansions that lower marginal costs. Mannheim production in Europe integrates with sulfuric-acid byproduct streams from metal smelters, ensuring a steady domestic supply for compound fertilizers.
Sulfate of potash (SoP) is the fastest-growing grade with a projected 6.1% CAGR to 2031, propelled by expanding acreage of almonds, avocados, coffee, and greenhouse berries that command price premiums for low-chloride cultivation. California’s tree-nut growers lifted SoP purchases in 2025 following drought-driven salinity concerns. Dead Sea producers cut energy intensity by 9% through optimized crystallization, narrowing the cost gap with MoP and expanding the potash fertilizer market for premium grades. Specialty products like potassium nitrate cater to fertigation needs in European greenhouse hubs, driven by year-round, consistent tomato and cucumber production.
Note: Segment shares of all individual segments available upon report purchase
Get Detailed Market Forecasts at the Most Granular Levels
Download PDF
By Application Mode: Soil Application Dominance, Fertigation Momentum
Soil application remained the principal delivery route, accounting for 91.3% of the potash fertilizer market in 2025, as it fits existing spreader fleets and allows one-pass coverage of large acreages. Canadian and the United States grain growers apply an average of 135 kilograms of K₂O per hectare in a single pre-plant pass, a method that keeps labor costs low and synchronizes with tillage operations. Similar practices prevail across the Brazilian Cerrado, where super-sacks of muriate are trucked hundreds of miles inland and aired out with pneumatic spreaders. Asia-Pacific’s smallholders also favor granular broadcast because it merges with urea and phosphate in local NPK blends subsidized under national nutrient programs. Together, these factors entrench soil application as the baseline technology for the potash fertilizer market.
Fertigation is expanding the fastest, with a 6.7% CAGR through 2031, as water-scarce regions adopt drip and micro-sprinkler lines that dissolve potash directly into irrigation water. California almond orchards, Spanish olive groves, and Indian sugarcane estates documented lower nutrient leaching once fertigation replaced surface broadcasting, thereby elevating potassium-use efficiency and supporting specialty-grade demand. Equipment vendors note rising orders for inline venturi injectors and automated dosing pumps that synchronize nutrient delivery with evapotranspiration rates. Although system capital costs remain a barrier for smallholders, cooperative finance schemes in Israel and Australia are widening access and should lift fertigation’s contribution to the potash fertilizer market size over the forecast window.
By Crop Type: Field Crop Foundation, Turf and Ornamental Upswing
Field crops such as corn, wheat, soybeans, and rice accounted for 87.4% of the potash fertilizer market in 2025, driven by their extensive acreage and nutrient-intensive genetics. Corn alone accounts for roughly one-third of all potash use, with Midwestern growers applying 140 kilograms of K₂O per hectare to stabilize yields. Soybeans remove 60 kilograms of K₂O per metric ton of harvested seed, compelling Brazilian producers to split-apply potash across two growth stages to offset acid-prone Oxisols. Wheat and rice add volume through their global footprint of more than 400 million hectares. Public soil-test surveys in Iowa, Madhya Pradesh, and Henan indicate falling potassium reserves, signaling sustained replenishment demand that anchors the potash fertilizer market.
Turf and ornamental uses are projected to advance at a 6.9% CAGR, the fastest among crop categories, driven by municipal green-space mandates and golf-course sustainability certifications that specify low-chloride formulations. Sports-field managers favor sulfate of potash to mitigate salt stress on hybrid bermudagrass and perennial ryegrass, a standard now embedded in renovation tenders from the United States school districts and European football clubs. Residential lawn-care companies are also shifting to slow-release potassium blends to comply with runoff rules in Florida and Maryland. Greenhouse floriculture in the Netherlands and Kenya uses potassium nitrate through fertigation to boost bud color and stem strength, further expanding the premium niche within the broader potash fertilizer market.
Note: Segment shares of all individual segments available upon report purchase
Get Detailed Market Forecasts at the Most Granular Levels
Download PDF
Geography Analysis
Asia-Pacific accounted for 41.9% of the potash fertilizer market share in 2025, as China and India combined imported more than 14 million metric tons to offset limited domestic capacity. China plans to increase Qinghai salt-lake production significantly by 2026, reducing import dependency by a notable percentage. Vietnam and Thailand ramped up purchases for rice and feed-corn acreage, underscoring Southeast Asia’s growing pull on the potash fertilizer market. Japan and South Korea, though smaller in volume, demand high-purity SoP for protected-crop systems, maintaining a premium-price sub-segment in the region.
North America is the fastest-growing region, with a projected compound annual growth rate (CAGR) of 7.1% through 2031, driven by mine expansions and advancements in digital farming. Nutrien Ltd.'s upgrades at Rocanville and Lanigan, along with The Mosaic Company's Esterhazy K3 project, are projected to increase Canada's production capacity by 2027. This increase in application rates reflects efforts to address nutrient imbalances and improve crop yields. Meanwhile, Mexico's avocado and berry industries increased imports of sulfate of potash (SoP) to meet export standards, ensuring compliance with international quality requirements. This complements the region's strong position in muriate of potash (MoP) production, further solidifying North America's role in the global potash market.
Europe, South America, the Middle East, and Africa represented the remaining demand. Europe’s usage dipped in 2024 as high gas prices idled NPK plants, yet France, Germany, and Poland remain heavy users due to intensive wheat and sugar-beet farming. Brazil imported potash fertilizers to support the soybean and corn production in the Cerrado region. However, hinterland-port bottlenecks increased delivered costs. Israel Chemicals and Arab Potash leverage Dead Sea brines to supply the Middle East and Asia at some of the world’s lowest unit costs.
Get Analysis on Important Geographic Markets
Download PDF
Competitive Landscape
Market concentration is moderate, with the top five companies, The Mosaic Company, K+S Aktiengesellschaft, Nutrien Ltd., EuroChem Group AG, and Sinofert Holdings Limited (Sinochem Group Co., Ltd.), collectively holding the majority of the market share in 2025. Nutrien Ltd. integrates downstream through over 2,400 North American retail points, bundling agronomic advice with proprietary blends. K+S Aktiengesellschaft deployed autonomous haul trucks at Werra, cutting labor costs and reducing Scope 1 emissions, while ICL Group Ltd. implemented machine-learning algorithms at Dead Sea ponds, lifting SOP yields.
Smaller specialists carve niches in premium or regional markets. Intrepid Potash Inc. supplies SoP to California tree-nut orchards, whereas Compass Minerals International Inc. monetizes de-icing byproducts into fertilizer-grade potash after securing ISO 14064 certification for its Canadian site. EuroChem Group AG’s patent for low-temperature crystallization could trim energy use, a strategic hedge as carbon prices rise. Market share continues to shuffle as Belaruskali sanctions persist, enabling Canadian and Middle Eastern suppliers to fill the vacuum. Strategic alliances, such as Yara International ASA and The Mosaic Company’s co-marketing of precision-application services, underscore a pivot toward digital agronomy.
Corporate commitments to decarbonizing fertilizer production are emerging as a key differentiator. K+S Aktiengesellschaft has signed a long-term offtake agreement, starting in the mid-2020s, for potash sourced from hydrogen-cavern brines, ensuring an annual supply with a carbon footprint significantly lower than that of traditional mining methods. Similarly, Arab Potash Company PLC has invested in a large-scale solar project at its Dead Sea operations, aiming to substantially reduce grid power consumption over the next few years.
Potash Fertilizer Industry Leaders
The Mosaic Company
K+S Aktiengesellschaft
Nutrien Ltd.
EuroChem Group AG
Sinofert Holdings Limited (Sinochem Group Co., Ltd.)
- *Disclaimer: Major Players sorted in no particular order
Need More Details on Market Players and Competitors?
Download PDF
Recent Industry Developments
- November 2025: Nutrien Ltd. has chosen the Port of Longview in Washington state for a USD 1 billion potash export terminal, with an annual capacity of 5-6 million metric tons aimed at Asian markets. The selection was based on advantages such as superior rail access, deep-water capabilities, and improved construction feasibility compared to Canadian locations.
- October 2025: Arab Potash Company PLC and the German firm CEC have signed an engineering services contract to develop a third cold crystallization unit. The project is intended to boost high-purity potash production, support value-added derivative industries, and strengthen APC's competitive position in global markets.
- August 2025: The Mosaic Company has entered into an agreement to sell its Taquari-Vassouras potash mine, located in Sergipe, Brazil, to VL Mineração Ltda. The transaction is valued at up to USD 27 million in staged cash payments, with the buyer also taking on USD 22 million in asset-retirement obligations. Mosaic anticipates completing the divestiture by the end of 2025, pending approval from Brazilian competition authorities.
Global Potash Fertilizer Market Report Scope
Potash fertilizer is a potassium-rich material, such as potassium chloride (MoP) or potassium sulfate (SoP), extracted from natural salt deposits. It provides essential potassium (K) to plants, which is vital for water regulation, photosynthesis, disease resistance, and improving crop yield and quality. Potash fertilizers replenish the potassium removed from the soil during harvest. The Potash Fertilizer Market Report is Segmented by Type (Muriate of Potash (MoP), Sulfate of Potash (SoP), and Others), by Application Mode (Fertigation, Foliar, and Soil), by Crop Type (Field Crops, Horticultural Crops, and Turf and Ornamental), and by Geography (North America, Europe, Asia-Pacific, South America, Middle East, and Africa). The Market Forecasts are Provided in Terms of Value (USD) and Volume (Metric Tons).
By Type
| Muriate of Potash (MoP) |
| Sulfate of Potash (SoP) |
| Others |
By Application Mode
| Fertigation |
| Foliar |
| Soil |
By Crop Type
| Field Crops |
| Horticultural Crops |
| Turf and Ornamental |
By Geography
| North America | Canada |
| Mexico | |
| United States | |
| Rest of North America | |
| Europe | France |
| Germany | |
| Italy | |
| Netherlands | |
| Russia | |
| Spain | |
| Ukraine | |
| United Kingdom | |
| Rest of Europe | |
| Asia-Pacific | Australia |
| Bangladesh | |
| China | |
| India | |
| Indonesia | |
| Japan | |
| Pakistan | |
| Philippines | |
| Thailand | |
| Vietnam | |
| Rest of Asia-Pacific | |
| South America | Argentina |
| Brazil | |
| Rest of South America | |
| Middle East | Turkey |
| Saudi Arabia | |
| Rest of Middle East | |
| Africa | Nigeria |
| South Africa | |
| Rest of Africa |
| By Type | Muriate of Potash (MoP) | |
| Sulfate of Potash (SoP) | ||
| Others | ||
| By Application Mode | Fertigation | |
| Foliar | ||
| Soil | ||
| By Crop Type | Field Crops | |
| Horticultural Crops | ||
| Turf and Ornamental | ||
| By Geography | North America | Canada |
| Mexico | ||
| United States | ||
| Rest of North America | ||
| Europe | France | |
| Germany | ||
| Italy | ||
| Netherlands | ||
| Russia | ||
| Spain | ||
| Ukraine | ||
| United Kingdom | ||
| Rest of Europe | ||
| Asia-Pacific | Australia | |
| Bangladesh | ||
| China | ||
| India | ||
| Indonesia | ||
| Japan | ||
| Pakistan | ||
| Philippines | ||
| Thailand | ||
| Vietnam | ||
| Rest of Asia-Pacific | ||
| South America | Argentina | |
| Brazil | ||
| Rest of South America | ||
| Middle East | Turkey | |
| Saudi Arabia | ||
| Rest of Middle East | ||
| Africa | Nigeria | |
| South Africa | ||
| Rest of Africa | ||
Need A Different Region or Segment?
Customize Now
Market Definition
- MARKET ESTIMATION LEVEL - Market Estimations for various types of fertilizers has been done at the product-level and not at the nutrient-level.
- NUTRIENT TYPES COVERED - All Potassic Fertilizers
- AVERAGE NUTRIENT APPLICATION RATE - This refers to the average volume of nutrient consumed per hectare of farmland in each country.
- CROP TYPES COVERED - Field Crops: Cereals, Pulses, Oilseeds, and Fiber Crops Horticulture: Fruits, Vegetables, Plantation Crops and Spices, Turf Grass and Ornamentals
| Keyword | Definition |
|---|---|
| Fertilizer | Chemical substance applied to crops to ensure nutritional requirements, available in various forms such as granules, powders, liquid, water soluble, etc. |
| Specialty Fertilizer | Used for enhanced efficiency and nutrient availability applied through soil, foliar, and fertigation. Includes CRF, SRF, liquid fertilizer, and water soluble fertilizers. |
| Controlled-Release Fertilizers (CRF) | Coated with materials such as polymer, polymer-sulfur, and other materials such as resins to ensure nutrient availability to the crop for its entire life cycle. |
| Slow-Release Fertilizers (SRF) | Coated with materials such as sulfur, neem, etc., to ensure nutrient availability to the crop for a longer period. |
| Foliar Fertilizers | Consist of both liquid and water soluble fertilizers applied through foliar application. |
| Water-Soluble Fertilizers | Available in various forms including liquid, powder, etc., used in foliar and fertigation mode of fertilizer application. |
| Fertigation | Fertilizers applied through different irrigation systems such as drip irrigation, micro irrigation, sprinkler irrigation, etc. |
| Anhydrous Ammonia | Used as fertilizer, directly injected into the soil, available in gaseous liquid form. |
| Single Super Phosphate (SSP) | Phosphorus fertilizer containing only phosphorus which has lesser than or equal to 35%. |
| Triple Super Phosphate (TSP) | Phosphorus fertilizer containing only phosphorus greater than 35%. |
| Enhanced Efficiency Fertilizers | Fertilizers coated or treated with additional layers of various ingredients to make it more efficient compared to other fertilizers. |
| Conventional Fertilizer | Fertilizers applied to crops through traditional methods including broadcasting, row placement, ploughing soil placement, etc. |
| Chelated Micronutrients | Micronutrient fertilizers coated with chelating agents such as EDTA, EDDHA, DTPA, HEDTA, etc. |
| Liquid Fertilizers | Available in liquid form, majorly used for application of fertilizers to crops through foliar and fertigation. |
Need More Details on Market Definition?
Ask a Question
Research Methodology
���ϲ����� follows a four-step methodology in all our reports.
- Step-1: IDENTIFY KEY VARIABLES: In order to build a robust forecasting methodology, the variables and factors identified in Step-1 are tested against available historical market numbers. Through an iterative process, the variables required for market forecast are set and the model is built on the basis of these variables.
- Step-2: Build a Market Model: Market-size estimations for the forecast years are in nominal terms. Inflation is not a part of the pricing, and the average selling price (ASP) is kept constant throughout the forecast period for each country.
- Step-3: Validate and Finalize: In this important step, all market numbers, variables and analyst calls are validated through an extensive network of primary research experts from the market studied. The respondents are selected across levels and functions to generate a holistic picture of the market studied.
- Step-4: Research Outputs: Syndicated Reports, Custom Consulting Assignments, Databases & Subscription Platforms

Get More Details On Research Methodology
Download PDF


