Performance Additives Market Size and Share
Market Overview
| Study Period | 2021 - 2031 |
|---|---|
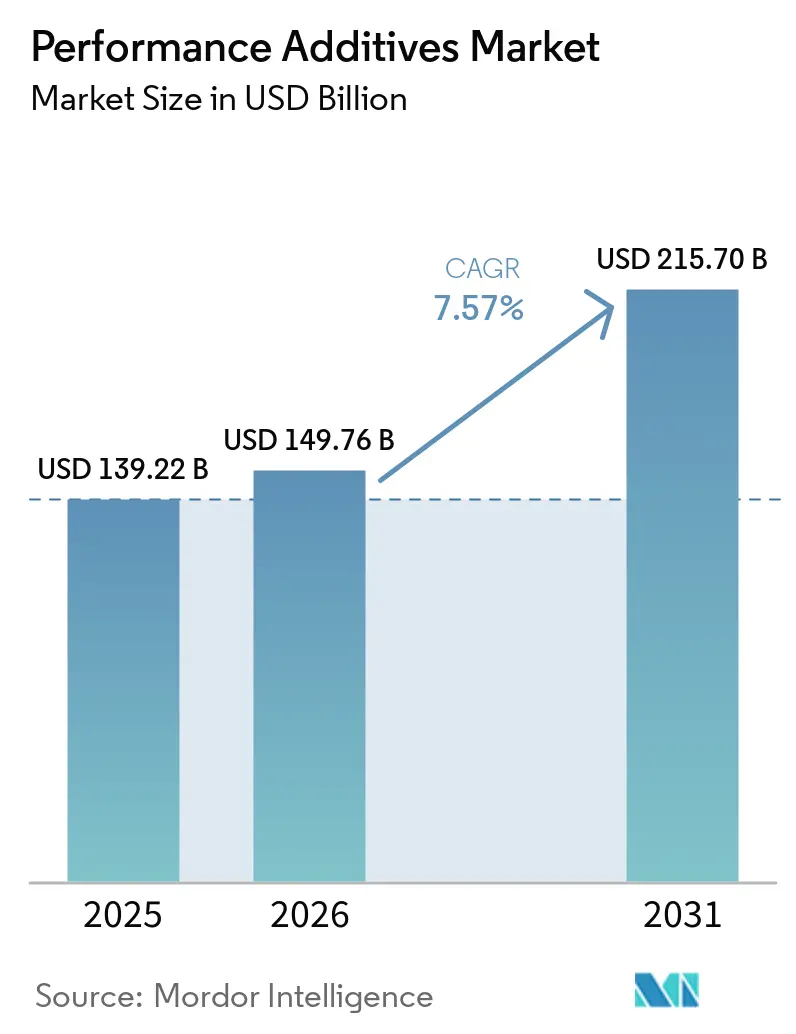
| Market Size (2026) | USD 149.76 Billion |
| Market Size (2031) | USD 215.70 Billion |
| Growth Rate (2026 - 2031) | 7.57% CAGR |
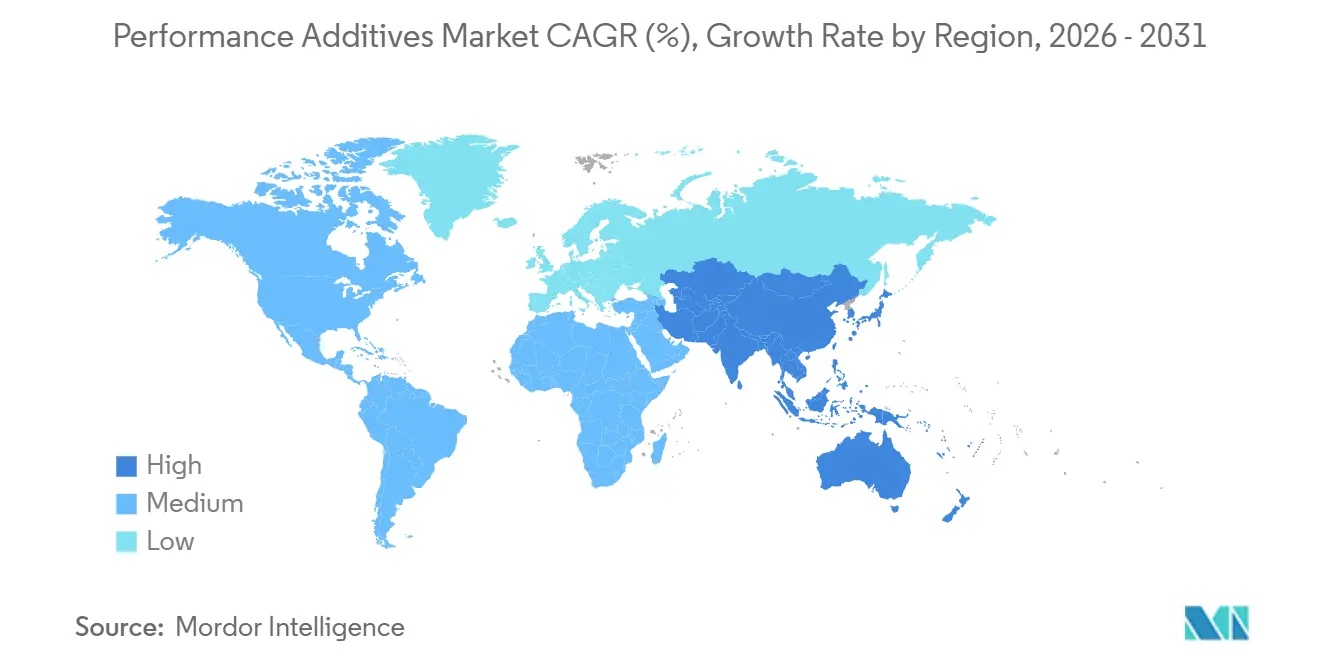
| Fastest Growing Market | Asia Pacific |
| Largest Market | Asia Pacific |
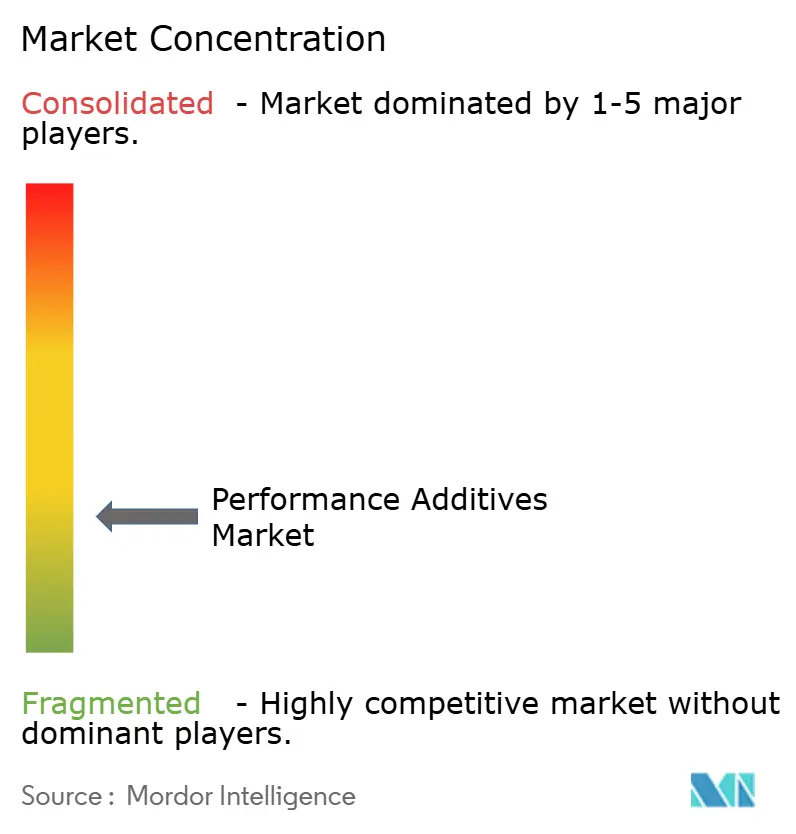
| Market Concentration | Low |
Major Players *Disclaimer: Major Players sorted in no particular order Image © ���ϲ�����. Reuse requires attribution under CC BY 4.0. | |
Performance Additives Market Analysis by ���ϲ�����
The Performance Additives Market size is projected to be USD 139.22 billion in 2025, USD 149.76 billion in 2026, and reach USD 215.70 billion by 2031, growing at a CAGR of 7.57% from 2026 to 2031. Driven by a rise in low-VOC architectural coatings, the adoption of Euro 7 and China VI-b emissions standards, and the momentum of circular-economy initiatives, formulators are increasingly opting for dispersants, rheology modifiers, and compatibilizers that deliver heightened efficiency with lower treat rates. As electric-drive units surpass 20,000 rpm, the demand for high-temperature, long-drain lubricants has increased, intensifying the need for shear-stable viscosity-index improvers. At the same time, AI-driven formulation platforms are accelerating development cycles, enabling smaller producers to match the innovation pace of larger multinationals. Furthermore, in response to supply risks tied to crude-derived aromatics, converters are shifting towards bio-based plasticizers and lubricity agents from fatty acids, a move that helps shield their margins from feedstock price fluctuations.
Key Report Takeaways
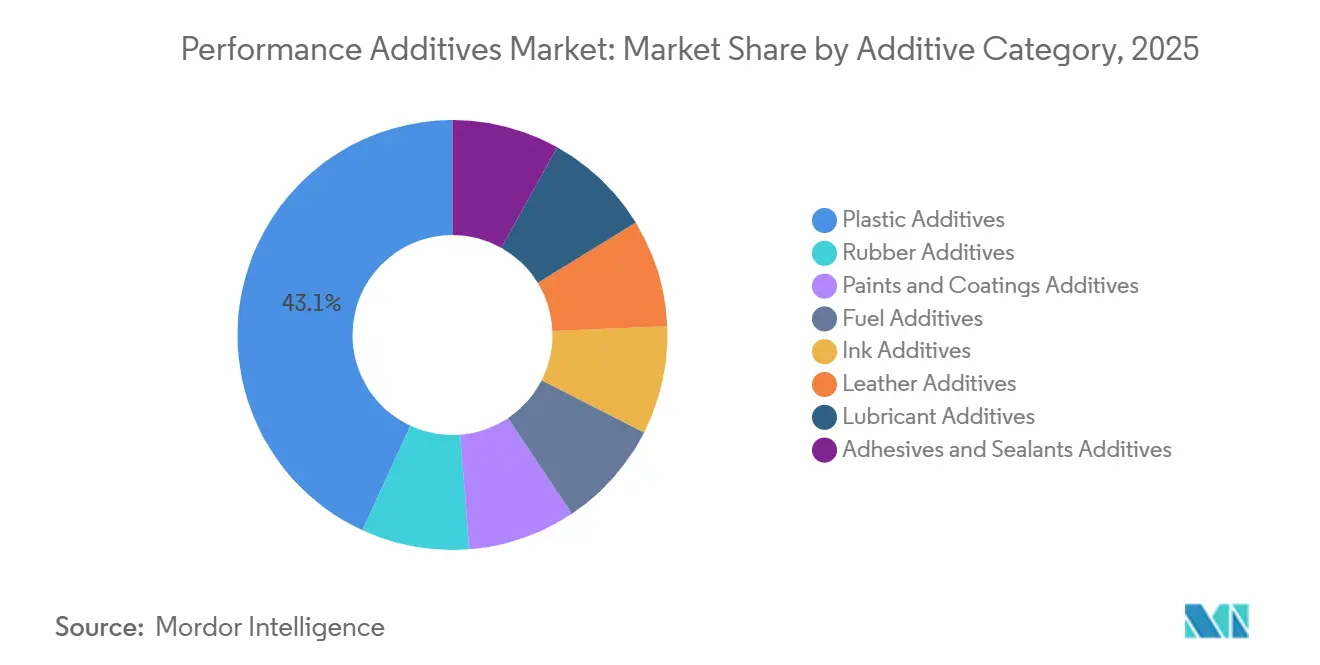
- By additive category, plastic additives led with 43.12% performance additives market share in 2025 and are forecast to expand at a 9.22% CAGR through 2031.
- By form, solid/powder additives held 49.16% share of the performance additives market size in 2025; micro-encapsulated formats are advancing at a 10.36% CAGR to 2031.
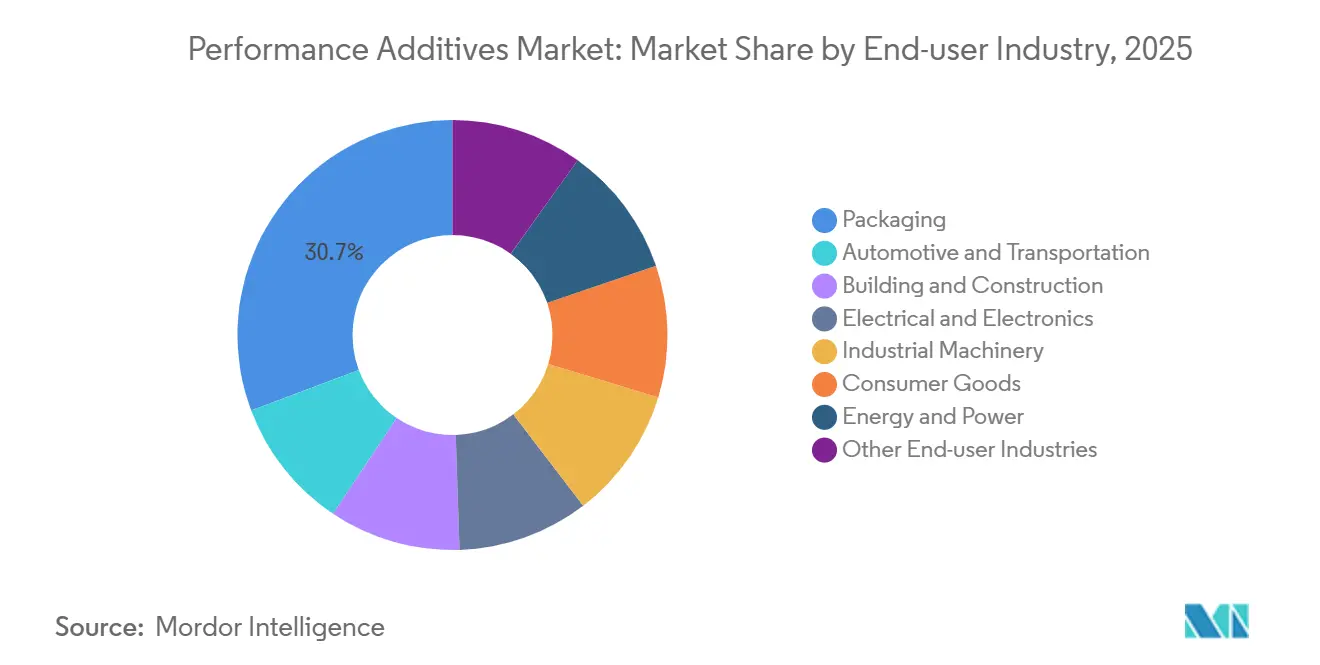
- By end-user industry, packaging accounted for 30.71% of the performance additives market size in 2025, while automotive and transportation are projected to record the highest 10.61% CAGR between 2026 and 2031.
- By geography, Asia-Pacific captured 46.62% of the performance additives market share in 2025 and remains the fastest-growing region with an 8.35% CAGR to 2031.
Note: Market size and forecast figures in this report are generated using ���ϲ�����’s proprietary estimation framework, updated with the latest available data and insights as of 2026.
Global Performance Additives Market Trends and Insights
Drivers Impact Analysis*
| Drivers | (~) % Impact on CAGR Forecast | Geographic Relevance | Impact Timeline |
|---|---|---|---|
| Rapid plastics demand growth in emerging economies | +1.8% | Asia-Pacific core, spill-over to Middle-East and Africa | Medium term (2-4 years) |
| Tightening fuel-economy and emissions norms driving high-performance lubricant and fuel additives | +2.1% | Global, with early adoption in Europe, North America, and China | Short term (≤ 2 years) |
| Shift toward water-borne and low-VOC coatings boosts specialty additive uptake | +1.4% | Europe and North America, expanding to Asia-Pacific urban centers | Medium term (2-4 years) |
| Additive-enabled chemical-recycling and circular-polymer initiatives gain traction | +0.9% | Europe leading, North America and Asia-Pacific following | Long term (≥ 4 years) |
| AI-driven additive formulation platforms accelerate customized performance additives | +0.6% | Global, concentrated in research and development hubs (Germany, United States, Japan) | Long term (≥ 4 years) |
| Source: ���ϲ����� | |||
Rapid Plastics Demand Growth in Emerging Economies
By 2025, China ramped up its plastic production, while India, buoyed by an incentive scheme, saw a marked increase in its output. This uptick in India's production has spurred a steady demand for UV stabilizers, antioxidants, and impact modifiers. In Southeast Asia, as Vietnam, Thailand, and Indonesia expand their polyolefin capacities, an increase in export-driven packaging lines is evident. These lines are increasingly turning to performance additives to boost clarity and minimize impact. However, a hurdle emerges as many regional tier-2 compounders lack the essential formulation expertise. Toll blenders step in to bridge this gap, offering pre-dispersed masterbatches. Moreover, the e-commerce sector's pivot toward rigid parcels has amplified the demand for acrylic impact modifiers. Concurrently, EVA copolymers are transitioning from niche applications to mainstream acceptance, particularly in protective mailers.
Tightening Fuel-Economy and Emissions Norms
Euro 7 regulations limit particulates to a specific threshold. This regulation mandated the use of low-ash detergent and dispersant packages to safeguard gasoline direct injection systems. In March 2025, Chevron Oronite introduced a zero-ash dispersant, which ensured prolonged piston cleanliness in alignment with extended OEM drain intervals[1]Chevron Corporation, “Zero-Ash Dispersant Package,” chevron.com. China's VI-b regulation, which capped sulfur levels at a specific limit, increased the demand for fatty acid ester lubricity improvers. Furthermore, 0W-8 viscosity grades currently represent a significant portion of passenger car motor oils in the European region, further driving the demand for shear-stable VI improvers.
Shift Toward Water-Borne and Low-VOC Coatings Boosts Specialty Additive Uptake
In the European Union (EU), interior matt paints are restricted to a VOC limit of 30 g/L, while California plans to reduce industrial-maintenance limits to 100 g/L by 2025. To address challenges such as increased surface tension and film-formation issues, water-borne systems now rely on associative thickeners, wetting agents, and defoamers. Dow introduced a bio-based acrylic thickener in June 2025, which meets the demand for cobalt-free and ammonia-free labels while ensuring optimal rheology control[2]Dow Chemical Company, “Bio-Based Rheology Modifier Launch,” dow.com.
Additive-Enabled Chemical Recycling and Circular-Polymer Initiatives
In 2025, BASF's ChemCycling rejuvenated the melt-flow and color of recycled PE and PP by using proprietary antioxidants and phosphites on processed pyrolysis oil. As EU regulations mandate that plastic packaging must be recycled by 2030, the demand for slip agents and flame retardants has increased. These additives are now designed to maintain their effectiveness across multiple extrusion cycles. Eastman's Kingsport molecular-recycling unit utilizes chain extenders and impact modifiers to convert recycled polyester into food-contact-grade resins.
Restraints Impact Analysis*
| Restraints | (~) % Impact on CAGR Forecast | Geographic Relevance | Impact Timeline |
|---|---|---|---|
| Volatile crude-derived feedstock prices | -1.2% | Global, with acute impact in import-dependent regions (Europe, Japan) | Short term (≤ 2 years) |
| Pending microplastics legislation targeting functional additives in packaging | -0.7% | Europe leading, potential spill-over to North America and Asia-Pacific | Medium term (2-4 years) |
| Supply-chain traceability mandates elevate compliance costs for formulators | -0.5% | Europe (REACH), North America (TSCA), expanding to Asia-Pacific | Long term (≥ 4 years) |
| Source: ���ϲ����� | |||
Volatile Crude-Derived Feedstock Prices
In 2025, Brent crude prices exhibited moderate fluctuations within a defined range. This volatility increased cash costs for benzene- and toluene-based additives, significantly tightening margins in Europe. Industry giants such as SABIC, equipped with upstream crackers, effectively managed these price fluctuations. However, mid-sized formulators resorted to quarterly price adjustments. Although bio-based sebacates and tall-oil esters provided a buffer against these pressures, they carried a notable premium.
Pending Microplastics Legislation Targeting Functional Additives
In March 2025, California's Safer Consumer Products list included "microplastic-generating additives," which leads to an expensive alternatives analysis, a challenge that disproportionately affects smaller blenders. Additionally, ECHA's draft regulations classify solid polymer particles under 5 mm as intentionally added microplastics, which may result in restrictions on erucamide slip agents and PE-wax matting agents unless they are reformulated.
*Our updated forecasts treat driver/restraint impacts as directional, not additive. The revised impact forecasts reflect baseline growth, mix effects, and variable interactions.
Segment Analysis
By Additive Category: Plastic Additives Dominate Revenue and Innovation
In 2025, plastic additives accounted for 43.12% of the performance additives market turnover, with projections indicating growth at a CAGR of 9.22% during the forecast period of 2026–2031. The market for stabilizers in performance additives, driven by phenolic antioxidants and hindered-amine light stabilizers, plays a crucial role in preserving polypropylene composites during processing at 280 degrees Celsius. As industries such as electronics and battery casings move away from bromine-based solutions, halogen-free flame retardants - utilizing aluminum dihydroxide and melamine polyphosphate - have experienced significant growth.
Despite scrutiny from REACH, both phthalate and non-phthalate plasticizers continue to dominate the flexible PVC tubing market. This dominance has prompted suppliers to increasingly explore alternatives such as epoxidized soybean oil and citrate blends. Processing aids and impact modifiers are now being specified more frequently in rigid e-commerce packaging, boosting productivity and throughput on production lines that exceed 200 meters per minute. Other segments of the performance additives market - spanning rubber, coatings, fuel, ink, leather, lubricants, and adhesives - play pivotal roles. These segments ensure everything from tread wear resistance to smooth digital ink dispersion, highlighting a broad and diversified demand.


By Form: Micro-Encapsulation Gains Momentum
In 2025, solid and powder products led the performance additives market, securing 49.16% of revenue due to their ease of dosing and extended shelf life. Liquids ensured homogeneous dispersion in coatings, while molding shops preferred masterbatch pellets to reduce dust exposure. Micro-encapsulated solutions, projected to grow at a 10.36% CAGR during the forecast period of 2026–2031, provided a controlled release of antimicrobials and self-healing resins. In food packaging, silver-ion capsules release biocides upon moisture detection, boosting shelf life without altering taste. Encapsulated antioxidants safeguarded polyolefins during twin-screw extrusion, activating as melt temperatures neared oxidative limits. Brand owners in cosmetics, pharmaceuticals, and high-performance paints accepted potential cost increases from encapsulation, valuing the enhanced functionality. While solid/powder and liquid formats dominated commodity PVC and architectural paints, micro-encapsulated and masterbatch lines gained traction in the technical-grade market.
By End-User Industry: Electrification Reshapes Additive Demand
In 2025, packaging generated 30.71% of the total revenue, highlighting the global output's heavy reliance on agents such as slip, antiblock, and antifog. The automotive and transportation sector is leading the growth, with a projected CAGR of 10.61% during the forecast period of 2026–2031. As electric vehicles account for a significant share of light-vehicle sales, they require fluids that maintain dielectric properties and resist copper corrosion at temperatures reaching 120 degrees Celsius. This increasing demand is driving the need for advanced friction modifiers and synthetic esters. Additionally, as battery-pack thermoplastics evolve, there is a growing requirement for halogen-free flame retardants and thermally conductive fillers, both of which depend on dispersants and coupling agents.
India’s Housing-for-All initiative is driving growth in the building and construction sector, resulting in increased demand for concrete admixtures and waterproofing modifiers. In the electrical and electronics sector, there is a noticeable shift toward halogen-free and low-smoke formulations that comply with UL 94 V-0 standards. This trend is boosting the demand for aluminum trihydroxide and phosphorus systems. The range of applications is extensive, spanning from corrosion inhibitors in offshore fluids to pour-point depressants in Arctic drilling muds, with contributions from the industrial machinery, consumer goods, and energy sectors.
Geography Analysis
Asia-Pacific, projected to account for 46.62% of the 2025 turnover, is set to lead with an 8.35% CAGR during the forecast period of 2026–2031. China, bolstered by Sinopec’s HALS plant, has significantly curtailed its reliance on imports in the Performance additives market. In India, government incentives are accelerating the nation's push towards self-sufficiency in specialty chemicals, allowing local buyers to benefit from shorter lead times with domestic suppliers. Meanwhile, ASEAN's expansion of compounding lines now mandates ISO 9001-certified additive supply chains, creating broader opportunities for regional toll blenders.
North America, a major contributor to the 2025 revenue, excels in high-performance coatings and automotive lubricants. The Inflation Reduction Act, which provides production credits for domestic specialty chemicals, has spurred expansions for industry giants like Dow and Huntsman along the Gulf Coast. Furthermore, with Mexico's production of millions of vehicles, there is a strong local demand for detergent and dispersant packages, predominantly assembled in Monterrey, underscoring the region’s near-shoring trends.
Europe, despite facing challenges like high energy costs and stringent REACH compliance, remains a significant player in the Performance additives market. The region is also a hub for R&D: BASF’s pilot lines in Ludwigshafen are exploring CO₂-based polyols, while Evonik’s Marl site is pioneering AI-curated rheology modifiers. South America and the Middle-East, together making up the remaining market share, are witnessing a surge in additive demand, driven by Brazil’s booming packaging industry and Saudi Arabia’s robust petrochemical sector.

Competitive Landscape
The performance additives market is fragmented. Chinese toll manufacturers are now offering four-week lead times, outpacing global suppliers who typically operate on a 12-week cycle for custom masterbatches. Meanwhile, start-ups that utilize high-throughput screening to identify vegetable-oil-derived plasticizers pose a challenge to established players focusing on phthalate alternatives. As regulations such as REACH, TSCA, and the looming microplastics rules increase compliance costs, slight consolidation in the market is anticipated. However, the wide array of additive chemistries in the Performance additives industry suggests that no single player is likely to dominate.
Performance Additives Industry Leaders
BASF
Dow
Clariant
The Lubrizol Corporation
Evonik Industries AG
- *Disclaimer: Major Players sorted in no particular order

Recent Industry Developments
- March 2026: Univar Solutions expanded its partnership with SI Group for performance additives distribution in Europe, the Middle East, and Africa. The agreement with SI Group included their range of additives for plastics and adhesives, such as antioxidants, stabilizers, UV light stabilizers, and impact modifiers.
- February 2026: hubergroup Chemicals launched ELARA, a high-performance additives brand tailored for coatings, printing inks, and adhesives. The product portfolio is designed to improve dispersion, wetting, and surface quality, emphasizing sustainability and adherence to regulatory standards.


Global Performance Additives Market Report Scope
Performance additives are specialized chemical compounds added in small quantities to base materials, such as polymers, oils, and coatings, to enhance their functional properties, durability, and processability while maintaining the material's bulk structure.
The performance additives market is segmented by additive category, form, end-user industry, and geography. By additive category, the market is segmented into plastic additives, rubber additives, paints and coatings additives, fuel additives, ink additives, leather additives, lubricant additives, and adhesives and sealants additives. By form, the market is segmented into solid/powder, liquid, masterbatch/pellet, and micro-encapsulated. By end-user industry, the market is segmented into packaging, automotive and transportation, building and construction, electrical and electronics, industrial machinery, consumer goods, energy and power (including oil and gas), and other end-user industries. The report also covers the market size and forecasts for the market in 17 countries across major regions. For each segment, the market sizing and forecasts are done based on value (USD).
| Plastic Additives | Lubricants |
| Processing Aids (Fluoropolymer-based) | |
| Flow Improvers | |
| Slip Additives | |
| Antistatic Additives | |
| Pigment Wetting Agents | |
| Filler Dispersants | |
| Antifog Additives | |
| Plasticizers | |
| Stabilizers | |
| Flame Retardants | |
| Impact Modifiers | |
| Rubber Additives | Accelerators |
| Antidegradants | |
| Blowing and Adhesive Agents | |
| Paints and Coatings Additives | Biocides |
| Dispersants and Wetting Agents | |
| Defoamers and De-aerators | |
| Rheology Modifiers | |
| Surface Modifiers | |
| Stabilizers | |
| Flow and Leveling Additives | |
| Other Paint and Coating Additives | |
| Fuel Additives | Deposit Control |
| Cetane Improvers | |
| Lubricity Improvers | |
| Antioxidants | |
| Anticorrosion | |
| Fuel Dyes | |
| Cold-Flow Improvers | |
| Antiknock Agents | |
| Other Fuel Additives | |
| Ink Additives | Rheology Modifiers |
| Slip/Rub Agents | |
| Defoamers | |
| Dispersants | |
| Antioxidants | |
| Chelating Agents | |
| Other Ink Additives | |
| Leather Additives | Finishing Agents |
| Fat Liquors | |
| Syntans | |
| Other Leather Additives | |
| Lubricant Additives | Dispersants and Emulsifiers |
| Viscosity-Index Improvers | |
| Detergents | |
| Corrosion Inhibitors | |
| Oxidation Inhibitors | |
| Extreme-Pressure Additives | |
| Friction Modifiers | |
| Other Lubricant Additives | |
| Adhesives and Sealants Additives | Antioxidants |
| Light Stabilizers | |
| Tackifiers | |
| Other Additives |
| Solid/Powder |
| Liquid |
| Masterbatch/Pellet |
| Micro-encapsulated |
| Packaging |
| Automotive and Transportation |
| Building and Construction |
| Electrical and Electronics |
| Industrial Machinery |
| Consumer Goods |
| Energy and Power (incl. Oil and Gas) |
| Other End-user Industries |
| Asia-Pacific | China |
| Japan | |
| India | |
| South Korea | |
| ASEAN Countries | |
| Rest of Asia-Pacific | |
| North America | United States |
| Canada | |
| Mexico | |
| Europe | Germany |
| United Kingdom | |
| France | |
| Italy | |
| Spain | |
| Russia | |
| NORDIC Countries | |
| Rest of Europe | |
| South America | Brazil |
| Argentina | |
| Rest of South America | |
| Middle-East and Africa | Saudi Arabia |
| South Africa | |
| Rest of Middle-East and Africa |
| By Additive Category | Plastic Additives | Lubricants |
| Processing Aids (Fluoropolymer-based) | ||
| Flow Improvers | ||
| Slip Additives | ||
| Antistatic Additives | ||
| Pigment Wetting Agents | ||
| Filler Dispersants | ||
| Antifog Additives | ||
| Plasticizers | ||
| Stabilizers | ||
| Flame Retardants | ||
| Impact Modifiers | ||
| Rubber Additives | Accelerators | |
| Antidegradants | ||
| Blowing and Adhesive Agents | ||
| Paints and Coatings Additives | Biocides | |
| Dispersants and Wetting Agents | ||
| Defoamers and De-aerators | ||
| Rheology Modifiers | ||
| Surface Modifiers | ||
| Stabilizers | ||
| Flow and Leveling Additives | ||
| Other Paint and Coating Additives | ||
| Fuel Additives | Deposit Control | |
| Cetane Improvers | ||
| Lubricity Improvers | ||
| Antioxidants | ||
| Anticorrosion | ||
| Fuel Dyes | ||
| Cold-Flow Improvers | ||
| Antiknock Agents | ||
| Other Fuel Additives | ||
| Ink Additives | Rheology Modifiers | |
| Slip/Rub Agents | ||
| Defoamers | ||
| Dispersants | ||
| Antioxidants | ||
| Chelating Agents | ||
| Other Ink Additives | ||
| Leather Additives | Finishing Agents | |
| Fat Liquors | ||
| Syntans | ||
| Other Leather Additives | ||
| Lubricant Additives | Dispersants and Emulsifiers | |
| Viscosity-Index Improvers | ||
| Detergents | ||
| Corrosion Inhibitors | ||
| Oxidation Inhibitors | ||
| Extreme-Pressure Additives | ||
| Friction Modifiers | ||
| Other Lubricant Additives | ||
| Adhesives and Sealants Additives | Antioxidants | |
| Light Stabilizers | ||
| Tackifiers | ||
| Other Additives | ||
| By Form | Solid/Powder | |
| Liquid | ||
| Masterbatch/Pellet | ||
| Micro-encapsulated | ||
| By End-user Industry | Packaging | |
| Automotive and Transportation | ||
| Building and Construction | ||
| Electrical and Electronics | ||
| Industrial Machinery | ||
| Consumer Goods | ||
| Energy and Power (incl. Oil and Gas) | ||
| Other End-user Industries | ||
| By Geography | Asia-Pacific | China |
| Japan | ||
| India | ||
| South Korea | ||
| ASEAN Countries | ||
| Rest of Asia-Pacific | ||
| North America | United States | |
| Canada | ||
| Mexico | ||
| Europe | Germany | |
| United Kingdom | ||
| France | ||
| Italy | ||
| Spain | ||
| Russia | ||
| NORDIC Countries | ||
| Rest of Europe | ||
| South America | Brazil | |
| Argentina | ||
| Rest of South America | ||
| Middle-East and Africa | Saudi Arabia | |
| South Africa | ||
| Rest of Middle-East and Africa | ||


Key Questions Answered in the Report
How fast is demand for additives in electric-vehicle fluids growing?
Sales to EV lubricant formulators are advancing at a 10.61% CAGR through 2031, the quickest pace among end users.
Which region offers the highest growth opportunity?
Asia-Pacific leads with an 8.35% CAGR, lifted by new plastics capacity and tightening emissions rules in China, India, and ASEAN.
What share do Plastic Additives hold today?
Plastic Additives account for 43.12% of 2025 revenue, the largest slice of the Performance additives market.
Are micro-encapsulated additives gaining traction?
Yes, micro-encapsulated formats are projected to expand at a 10.36% CAGR as converters seek controlled-release and self-healing features.
What is the main regulatory risk ahead?
Pending European and Californian microplastics rules could curb certain slip and matting agents unless reformulated or encapsulated.
What is the current global demand for the performance additives market and its expected growth by 2031?
The Performance Additives Market size is projected to be USD 139.22 billion in 2025, USD 149.76 billion in 2026, and reach USD 215.70 billion by 2031, growing at a CAGR of 7.57% from 2026 to 2031.
Page last updated on:


