North America Peas Market Analysis by ���ϲ�����
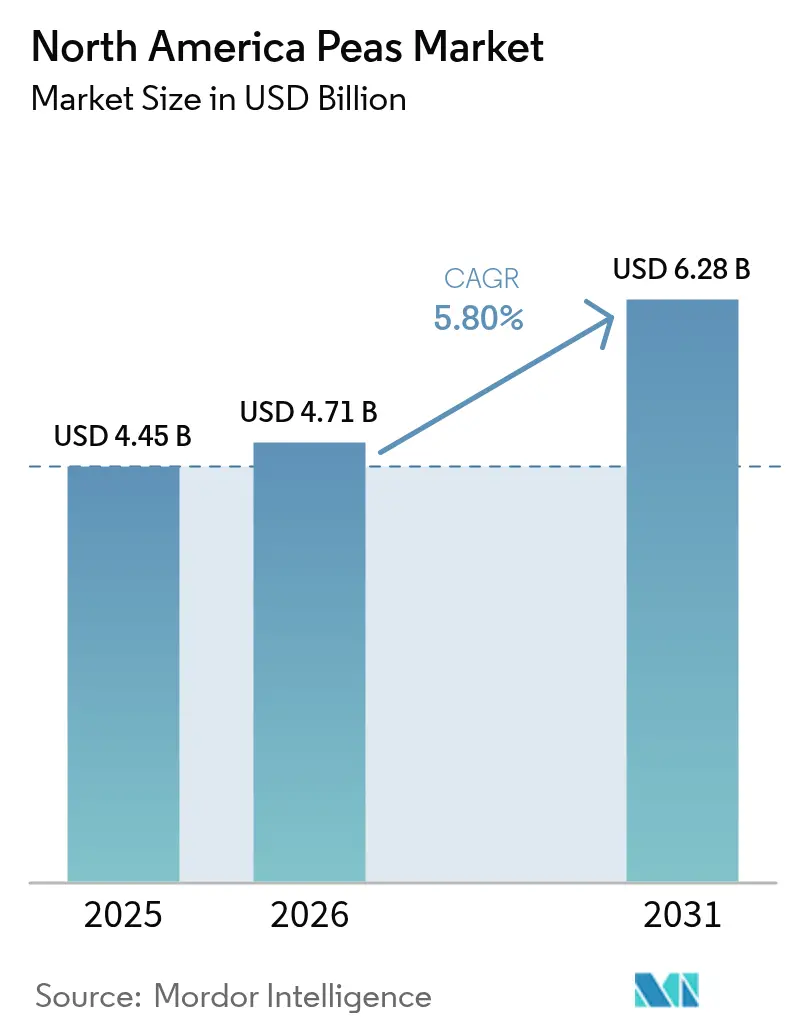
The North America peas market size is projected to expand from USD 4.45 billion in 2025 and USD 4.71 billion in 2026 to USD 6.28 billion by 2031, registering a CAGR of 5.80% between 2026 and 2031. Rapid adoption of pea protein isolates in dairy-alternative beverages and meat analogs, a pivot toward regenerative agriculture, and rising industrial demand for pea starch have lifted processor margins and encouraged acreage expansion across the northern Great Plains and Prairie provinces. Growth is also supported by the United States Department of Agriculture (USDA) Climate-Smart Commodities incentives that link verified soil-health outcomes to carbon-credit payments, thereby lowering production risk for growers. Regional processors are investing in dry-fractionation technology to improve protein yields, while tariffs applied in 2025 reshaped trade flows and nudged buyers to diversify their supply. Industrial buyers of biodegradable plastics are adding another layer of demand, tightening available supply during peak food-grade procurement windows.
Key Report Takeaways
- By geography, the United States held 62.1% of the North America peas market share in 2025, while Mexico is forecast to register a 7.4% CAGR through 2031.
Note: Market size and forecast figures in this report are generated using ���ϲ�����’s proprietary estimation framework, updated with the latest available data and insights as of 2026.
North America Peas Market Trends and Insights
Drivers Impact Analysis*
| Driver | (~) % Impact on CAGR Forecast | Geographic Relevance | Impact Timeline |
|---|---|---|---|
| Rising demand for pea-based protein ingredients | +1.2% | United States and Canada, and with spillover to Mexico | Medium term (2-4 years) |
| Growing preference for flexitarian and plant-forward diets | +0.9% | United States and Canada urban centers, and emerging in Mexico | Medium term (2-4 years) |
| Expansion of pea use in gluten-free bakery and snacks | +0.7% | North America, strongest in United States | Short term (≤ 2 years) |
| Food-grade pea varieties supported by regenerative-agriculture incentives | +0.6% | United States Great Plains, and Canadian Prairies | Long term (≥ 4 years) |
| Demand from methyl-ester bio-based plastics value chain | +0.4% | United States and Canada industrial corridors | Long term (≥ 4 years) |
| Food security stockpiling by North American pet-food makers | +0.8% | United States, Canada, and Mexico | Short term (≤ 2 years) |
| Source: ���ϲ����� | |||
Rising Demand for Pea-Based Protein Ingredients
Food manufacturers are adopting pea protein isolates and concentrates to diversify away from soy allergens and genetically modified organisms. Improved dry-fractionation and wet-milling now deliver protein content above 80%, while co-producing starch and fiber for industrial buyers[1]Source: Puris, “Regenerative Agriculture and Pea Protein Sourcing,” PURISPEA.COM. In 2025, Puris expanded its regenerative-sourcing network to 100,000 acres across North Dakota and Montana, ensuring traceable feedstock for its protein plants. Dairy-alternative and meat-analog brands specify pea isolates for their neutral flavor and superior emulsification, outperforming rice and hemp proteins in clean-label recipes. United States retail sales of products fortified with pea protein grew at double-digit rates during 2025, underscoring this structural shift.
Growing Preference for Flexitarian and Plant-Forward Diets
Flexitarian eating has grown rapidly, and an estimated 30% of United States adults self-identified as flexitarian in 2025, up from 25% two years earlier. Quick-service chains and meal-kit companies now routinely feature pea-protein menu items, guaranteeing steady ingredient offtake. Canada’s Protein Industries Canada supercluster has approved more than CAD 200 million (USD 145 million) in grants since 2024 to scale domestic processing. Mexico’s urban middle class is beginning to mirror this dietary pivot, with pea-protein imports filling demand gaps at local processors.
Expansion of Pea Use in Gluten-Free Bakery and Snacks
Pea flour and starch enhance texture, protein content, and shelf life in gluten-free baked goods and extruded snacks. United States bakeries increased pea-flour procurement by 15% in 2025 as they reformulated their bread and muffin lines. Food and Drug Administration (FDA) enforcement of gluten-free labeling under 21 CFR 101.91 demands verified ingredient traceability, elevating premiums for identity-preserved pea lots. This regulatory clarity is positioning certified gluten-free pea inputs as a high-margin niche within the broader North America peas market.
Food-Grade Pea Varieties Supported by Regenerative-Agriculture Incentives
The USDA Climate-Smart Commodities program allocates USD 3.1 billion in 2023 to projects that reward cover cropping, reduced tillage, and nitrogen-fixing rotations[2]Source: USDA, “USDA Announces Availability of USD 2.8 Billion in Funding for First Round of Projects Under Partnerships for Climate-Smart Commodities,” USDA.GOV. Peas naturally align, fixing atmospheric nitrogen and increasing soil organic matter, which strengthens growers’ eligibility for carbon-credit revenue. Pilot schemes in Montana and Saskatchewan now link credit issuance to verified pea acreage, encouraging long-term expansion of high-protein yellow varieties and stabilizing farm-gate supply for processors.
Restraints Impact Analysis*
| Restraint | (~) % Impact on CAGR Forecast | Geographic Relevance | Impact Timeline |
|---|---|---|---|
| Climatic yield variability in northern plains | -0.8% | United States northern Great Plains, and Canadian Prairies | Short term (≤ 2 years) |
| Tariff-driven price volatility in USMCA pulse trade | -0.6% | United States, Canada, and Mexico | Short term (≤ 2 years) |
| Increasing root-rot and Ascochyta blight incidence | -0.5% | United States and Canada pea-growing regions | Medium term (2-4 years) |
| Stricter phytosanitary residue limits on dry pulses | -0.3% | United States, Canada, and Mexico border crossings | Medium term (2-4 years) |
| Source: ���ϲ����� | |||
Climatic Yield Variability in Northern Plains
Pea fields in Montana, North Dakota, Saskatchewan, and Alberta face wide yield swings tied to spring moisture and summer heat stress. During 2024, drought reduced Montana yields to 1,200 pounds per acre, well below the five-year average of 1,500 pounds[3]Source: North Dakota State University, “Ascochyta Blight of Field Pea,” NDSU.EDU. Excess rainfall in Saskatchewan delayed planting and elevated disease risk, complicating processor contracting and insurance coverage. Climate modeling points to more extreme weather events before 2030, embedding production volatility into the North America peas market outlook.
Tariff-Driven Price Volatility in USMCA Pulse Trade
Reciprocal tariff measures imposed in early 2025 disrupted historical pulse trade patterns within North America, with the United States applying 25% duties on Canadian dry pea imports and China levying 100% tariffs on Canadian pulses in March 2025, as per Statistics Canada. These actions compressed Canadian farm-gate prices and forced growers to seek alternative export markets in India, Bangladesh, and the Philippines. United States processors benefited from lower import costs but faced uncertainty about the duration of tariffs and potential retaliation, complicating long-term sourcing strategies. Mexico's pea imports from the United States and Canada became subject to intensified customs inspections under USMCA (United States-Mexico-Canada Agreement) rules-of-origin verification, adding logistical delays and compliance expenses that elevated landed costs for Mexican buyers.
*Our forecasts treat driver/restraint impacts as directional, not additive. The impact forecasts reflect baseline growth, mix effects, and variable interactions.
Geography Analysis
The United States accounted for 62.1% of the North America peas market share in 2025, driven by strong infrastructure and consistent production levels. Dry pea production experienced steady growth, with states such as North Dakota and Montana increasing acreage and improving yields. Imports from Canada addressed processing gaps in the United States. However, reciprocal tariffs introduced in 2025 raised landed costs, prompting an increase in domestic acreage. USDA Climate-Smart initiatives linked carbon credits to verified pea rotations, mitigating weather-related risks and enhancing grower income. Additionally, stricter gluten-free regulations improved traceability, boosting demand for identity-preserved lots.
Mexico is projcted to grow at a 7.4% CAGR from 2026 to 2031, positioning it as the fastest-growing sub-market in North America. Imports account for over 80% of consumption, as processors meet demand for plant-based foods and pet nutrition. COFEPRIS (Comisión Federal para la Protección contra Riesgos Sanitarios) has enhanced residue testing protocols, which, while delaying border clearance, have improved quality assurance. Rising disposable incomes and the adoption of urban flexitarian diets in cities such as Mexico City, Guadalajara, and Monterrey are driving sustained demand growth through 2031. Urbanization and growing health awareness are further boosting demand for plant-based proteins, including pea-based products.
Canada remains a leading global producer of pulses, with Saskatchewan accounting for the majority of pulse cultivation and serving as a hub for research, grain handling, and ingredient processing. In 2024, the country's pea harvest saw a significant increase, driven by favorable growing conditions and efficient logistics. Canadian peas are associated with lower greenhouse gas emissions compared to international alternatives, making them attractive to sustainability-conscious markets. Non-GMO and organic certifications allow suppliers to command premiums in specialty markets. However, tariff uncertainties in key markets such as China are prompting Canadian exporters to explore alternative trade routes, particularly in Southeast Asia and South America.
Competitive Landscape
The North America peas market includes companies such as AGT Food and Ingredients, Roquette, and Ingredion, which operate integrated fractionation facilities and maintain contracts with growers across the Great Plains and Prairies. These companies play a significant role in ensuring a steady supply of peas for various applications. Additionally, Puris and Burcon NutraScience collaborate with contract growers to enhance dry-fractionation capacity, aiming to increase protein yield while minimizing water usage. This approach not only improves efficiency but also supports sustainable practices. Regional cooperatives compete by offering organic and identity-preserved sourcing options to meet the growing demand for traceable, high-quality products.
Supply concentration in Saskatchewan and Alberta, which produce more than 80% of Canada's peas, heightens vulnerability to weather shocks. Processors diversify procurement into Montana, North Dakota, and emerging Midwest acreage to mitigate risk. Technology adoption revolves around precision agriculture tools for nitrogen management and disease scouting, alongside blockchain traceability pilots that document carbon footprint and phytosanitary compliance.
White-space growth lies in bio-based plastics and industrial starch. Roquette’s CAD 45 million (USD 32 million) Manitoba bio-refinery will extract pea starch for methyl-ester synthesis, catering to renewable plastics clients. Puris patented a dry-fractionation process that boosts protein yield 12 % and creates fiber suited for bio-composites. Sustainability certifications and carbon-credit linkage are emerging as competitive differentiators as consumer scrutiny of supply chains intensifies.
Recent Industry Developments
- June 2025: Louis Dreyfus Company has completed the construction of a pea protein isolate facility in Yorkton, Saskatchewan. This facility has enhanced the company's presence in North America's pea market. The investment addresses the rising demand for sustainable, allergen-free protein ingredients while expanding the region's production capacity for pea derivatives used in food and nutrition applications.
- December 2024: Burcon NutraScience introduced Peazazz C pea protein to address the increasing demand in North America for clean-label, plant-based ingredients. Sourced from non-GMO yellow peas, this protein offers an allergen-friendly and sustainable option for use in beverages, baked goods, and dairy alternatives across both retail and foodservice applications.
- July 2024: AGT Foods has inaugurated a new extrusion facility in North Dakota, strengthening the state's position as a center for pulse innovation and value-added pea processing. This location strategically addresses the increasing demand for plant-based proteins in North America while utilizing the region's robust agricultural infrastructure and research capabilities.


North America Peas Market Report Scope
The North America Peas Market Report is Segmented by Geography (Argentina, Peru, and Colombia). The Report Includes Production Analysis (Volume), Consumption Analysis (Value and Volume), Import Analysis (Value and Volume), Export Analysis (Value and Volume), Wholesale Price Trend Analysis and Forecast, List of Key Players, Regulatory Framework, Logistics and Infrastructure, and Seasonality Analysis. The Market Forecasts are Provided in Terms of Value (USD) and Volume (Metric Tons).
By Geography
| North America | United States | Production Analysis (Area Harvested, Yield, and Production Volume) |
| Consumption Analysis (Consumption Value and Volume) | ||
| Import Market Analysis (Import Value, Volume, and Key Supplying Markets) | ||
| Export Market Analysis (Export Value, Volume, and Key Destination Markets) | ||
| Wholesale Price Trend Analysis and Forecast | ||
| Regulatory Framework | ||
| List of Key Players | ||
| Logistics and Infrastructure | ||
| Seasonality Analysis | ||
| Canada | Production Analysis (Area Harvested, Yield, and Production Volume) | |
| Consumption Analysis (Consumption Value and Volume) | ||
| Import Market Analysis (Import Value, Volume, and Key Supplying Markets) | ||
| Export Market Analysis (Export Value, Volume, and Key Destination Markets) | ||
| Wholesale Price Trend Analysis and Forecast | ||
| Regulatory Framework | ||
| List of Key Players | ||
| Logistics and Infrastructure | ||
| Seasonality Analysis | ||
| Mexico | Production Analysis (Area Harvested, Yield, and Production Volume) | |
| Consumption Analysis (Consumption Value and Volume) | ||
| Import Market Analysis (Import Value, Volume, and Key Supplying Markets) | ||
| Export Market Analysis (Export Value, Volume, and Key Destination Markets) | ||
| Wholesale Price Trend Analysis and Forecast | ||
| Regulatory Framework | ||
| List of Key Players | ||
| Logistics and Infrastructure | ||
| Seasonality Analysis | ||
| By Geography | North America | United States | Production Analysis (Area Harvested, Yield, and Production Volume) |
| Consumption Analysis (Consumption Value and Volume) | |||
| Import Market Analysis (Import Value, Volume, and Key Supplying Markets) | |||
| Export Market Analysis (Export Value, Volume, and Key Destination Markets) | |||
| Wholesale Price Trend Analysis and Forecast | |||
| Regulatory Framework | |||
| List of Key Players | |||
| Logistics and Infrastructure | |||
| Seasonality Analysis | |||
| Canada | Production Analysis (Area Harvested, Yield, and Production Volume) | ||
| Consumption Analysis (Consumption Value and Volume) | |||
| Import Market Analysis (Import Value, Volume, and Key Supplying Markets) | |||
| Export Market Analysis (Export Value, Volume, and Key Destination Markets) | |||
| Wholesale Price Trend Analysis and Forecast | |||
| Regulatory Framework | |||
| List of Key Players | |||
| Logistics and Infrastructure | |||
| Seasonality Analysis | |||
| Mexico | Production Analysis (Area Harvested, Yield, and Production Volume) | ||
| Consumption Analysis (Consumption Value and Volume) | |||
| Import Market Analysis (Import Value, Volume, and Key Supplying Markets) | |||
| Export Market Analysis (Export Value, Volume, and Key Destination Markets) | |||
| Wholesale Price Trend Analysis and Forecast | |||
| Regulatory Framework | |||
| List of Key Players | |||
| Logistics and Infrastructure | |||
| Seasonality Analysis | |||


Key Questions Answered in the Report
How large will pea sales become in North America by 2031?
The North America peas market is forecast to reach USD 6.28 billion by 2031, expanding at a 5.80% CAGR from 2026.
Which country dominates regional pea volume?
The United States held 62.1% of the market share in 2025, supported by 0.93 million metric tons harvested in Montana and North Dakota.
Why are processors favoring pea protein over soy?
Pea protein is non-allergenic, non-GMO, and qualifies for clean-label claims, meeting rising flexitarian and dairy-alternative demand.
How are tariffs affecting cross-border pea trade?
Reciprocal duties imposed in 2025 raised landed costs and redirected Canadian exports from China to South Asia, while U.S. buyers boosted domestic contracts.
What role does regenerative agriculture play in pea supply?
USDA Climate-Smart funding links carbon credits to verified pea acreage, providing growers extra revenue and encouraging sustainable rotations.
Page last updated on:


