Laser Sensor Market Size and Share
Market Overview
| Study Period | 2020 - 2031 |
|---|---|
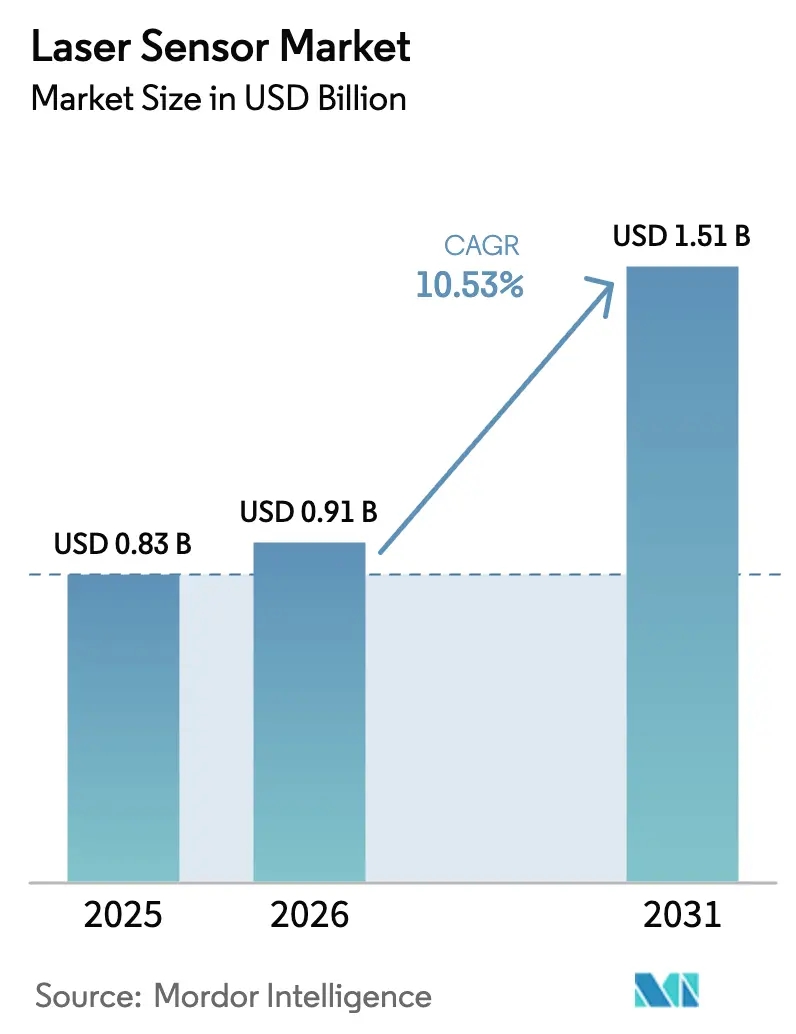
| Market Size (2026) | USD 0.91 Billion |
| Market Size (2031) | USD 1.51 Billion |
| Growth Rate (2026 - 2031) | 10.53% CAGR |
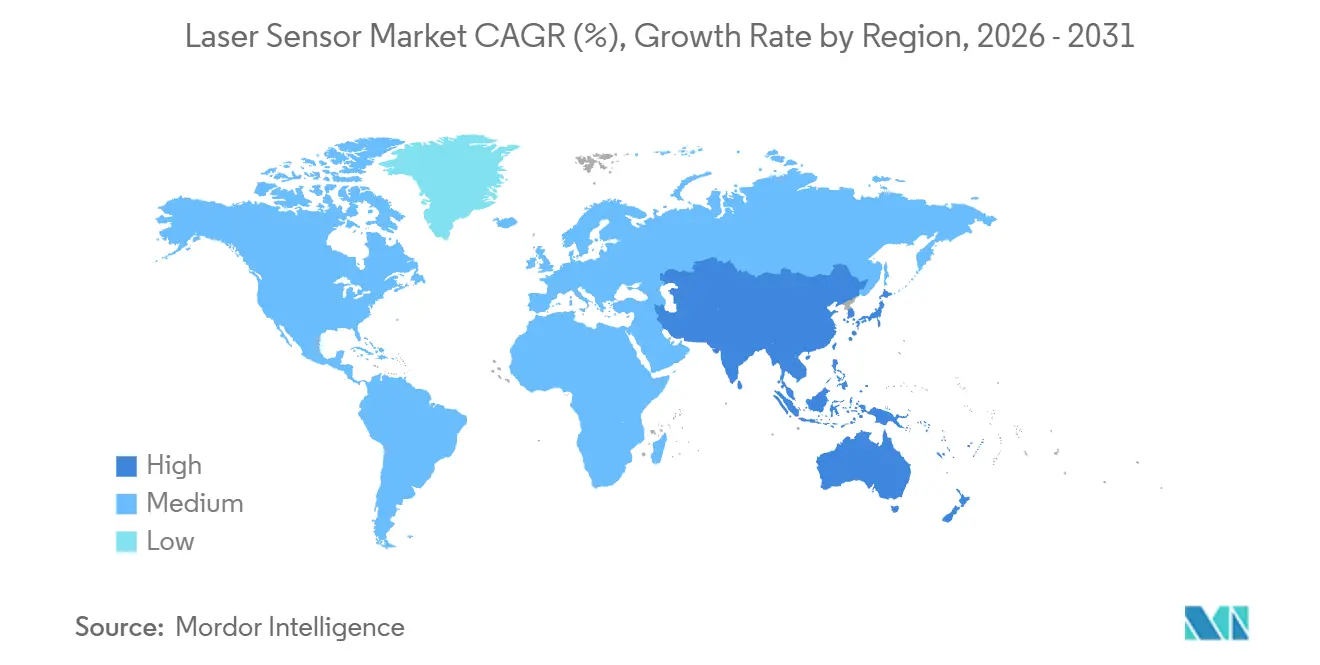
| Fastest Growing Market | Asia Pacific |
| Largest Market | North America |
| Market Concentration | Medium |
Major Players *Disclaimer: Major Players sorted in no particular order Image © ���ϲ�����. Reuse requires attribution under CC BY 4.0. | |
Laser Sensor Market Analysis by ���ϲ�����
The laser sensor market size is expected to grow from USD 0.83 billion in 2025 to USD 0.91 billion in 2026 and is forecast to reach USD 1.51 billion by 2031 at a 10.53% CAGR over 2026-2031. Robust demand stems from precision-critical use cases where mechanical gauges risk contamination and vision systems cannot match the sub-micron repeatability offered by triangulation and time-of-flight devices. Electric-vehicle cell stacking, advanced semiconductor packaging, and warehouse automation are the three most influential adoption vectors, each exerting measurable pull on capital budgets as cycle-time and yield targets tighten. Hardware upgrades now routinely pair edge analytics with multi-axis laser displacement heads, curbing data latency while satisfying ISO 10360 and FDA 21 CFR Part 11 traceability mandates. Supply-side resilience is improving after indium-phosphide epitaxy shortages in 2025, yet vendors still hedge risk by qualifying gallium-nitride emitters for mid-power arrays.
Key Report Takeaways
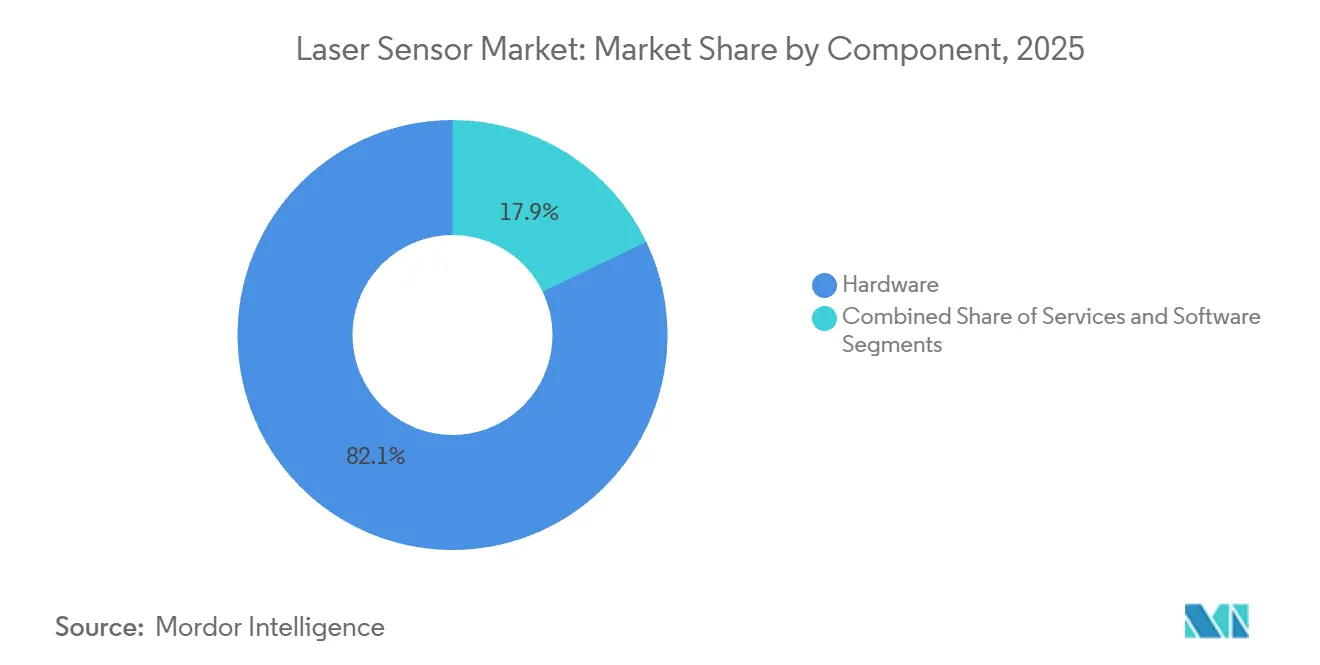
- By component, hardware led with 82.13% market share in 2025, while services are advancing at an 11.54% CAGR through 2031, the fastest in the landscape.
- By sensor type, distance and range devices dominated with 30.25% of the laser sensor market share in 2025, whereas profiling and line sensors are projected to expand at 11.71% CAGR to 2031.
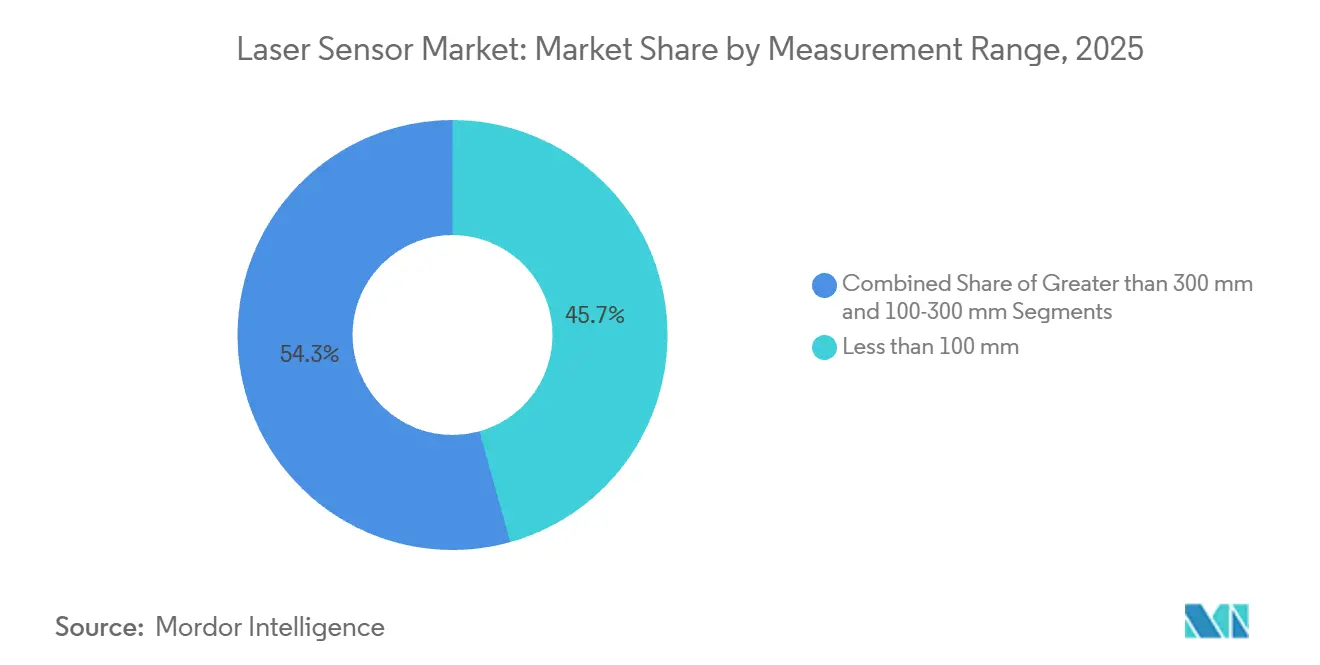
- By measurement range, short-range units under 100 millimeters captured 45.67% of share in 2025, and long-range models above 300 millimeters are expected to grow at an 11.82% pace through 2031.
- By power output, the 101-to-500-milliwatt band held 31.89% in 2025, and sensors above 500 milliwatts are on course for an 11.42% CAGR to 2031.
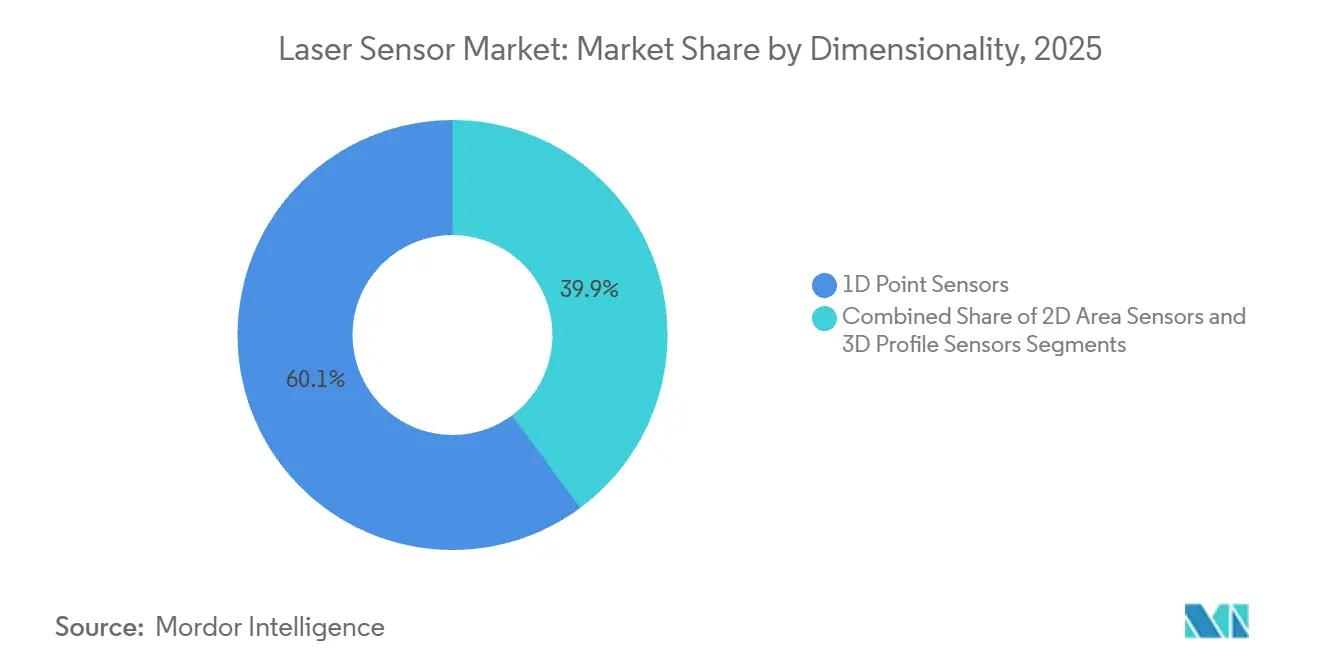
- By dimensionality, 1-D point devices retained a 60.13% share in 2025, while 3-D profilers are set to grow at an 11.12% rate over the forecast.
- By end-user, automotive and mobility commanded 26.83% of market share in 2025, but logistics, warehousing, and robotics is expanding fastest at 12.23% through 2031.
- By geography, North America accounted for 39.82% of share in 2025, and Asia-Pacific is forecast to post the quickest 12.01% CAGR between 2026-2031.
Note: Market size and forecast figures in this report are generated using ���ϲ�����’s proprietary estimation framework, updated with the latest available data and insights as of January 2026.
Global Laser Sensor Market Trends and Insights
Drivers Impact Analysis*
| DRIVER | (~) % IMPACT ON CAGR FORECAST | GEOGRAPHIC RELEVANCE | IMPACT TIMELINE |
|---|---|---|---|
| Precision-Gap Closure in EV Battery Assembly Accelerates Laser Displacement Sensor Uptake | +2.1% | China, Germany, United States | Medium term (2-4 years) |
| Expansion of 3D AOI in Semiconductor Packaging Spurs 3D Line Sensor Demand | +1.8% | Taiwan, South Korea, Japan, United States | Short term (≤ 2 years) |
| Migration from Ultrasonic to Laser Range Sensors in Smart Warehouses | +1.6% | North America, Europe, India, Southeast Asia | Medium term (2-4 years) |
| Falling Solid-State LiDAR Costs Enable ToF Sensors in European AGVs | +1.4% | Germany, France, Netherlands, North America | Short term (≤ 2 years) |
| Photonics-Integrated Displacement Sensors for Flexible OLED Inspection | +1.2% | South Korea, China | Long term (≥ 4 years) |
| Quantum-Cascade Laser Metrology in Additive Manufacturing | +1.0% | United States, Germany | Long term (≥ 4 years) |
| Source: ���ϲ����� | |||


Precision-Gap Closure in EV Battery Assembly Accelerates Laser Displacement Sensor Uptake
Wider adoption of electric vehicles forced cell-to-pack assembly tolerances beneath the 50-micron threshold in 2025. Blue-violet confocal sensors now reach 0.5-micron repeatability, displacing mechanical gauges that risk foil damage. Tesla’s Berlin plant cut rework by 12% after installing inline profilers, and Chinese lithium-ion giants cascading GB/T 36276 compliance have multiplied demand further. Vendors embed edge analytics to close feedback loops within 50 milliseconds, reducing server traffic by 70% and securing design wins across Europe and Asia. Subsidy programs in China, Germany, and the United States sustain momentum, keeping laser sensor market demand elevated.[1]Ministry of Industry and Information Technology, “Industrial Metrology Infrastructure Funding 2025,” miit.gov.cn
Expansion of 3-D AOI in Semiconductor Packaging Spurs 3-D Line Sensor Demand
Chiplet, fan-out wafer-level, and hybrid bonding nodes call for co-planarity control within ±10 microns, a regime unachievable for 2-D AOI at economical takt times. Three-dimensional laser line sensors projecting structured light at 10 kHz now deliver 0.1-micron z-resolution in <200 milliseconds per substrate. TSMC deployed more than 300 units in 2025, citing an 8-point yield boost. Europe’s Chips Act links subsidies to CpK above 1.67, effectively institutionalizing inline laser metrology, while Japan’s METI has earmarked JPY 200 billion (USD 1.4 billion) for domestic toolsets. These mandates collectively accelerate laser sensor market penetration in packaging fabs.
Migration from Ultrasonic to Laser Range Sensors in Smart Warehouses
Autonomous mobile robots moving at >2 m s-¹ expose the 50-millisecond latency of ultrasonic modules, prompting a shift to 905-nanometer time-of-flight lasers that respond in 10 milliseconds. Amazon retrofitted 15,000 Proteus AMRs in 2025, trimming aisle dwell by 18% and property damage by 22%. Regulatory impetus is mounting; Germany’s updated DGUV 100-500 now specifies <100-millisecond obstacle detection, translating into de-facto laser requirements in mixed-mode zones. Falling average selling prices below USD 200 per unit in 2026 cemented the cost-of-ownership logic, reinforcing the laser sensor market trajectory in logistics hubs across North America, Europe, and India.[2]Deutsche Gesetzliche Unfallversicherung, “DGUV Regulation 100-500 Update 2025,” dguv.de
Falling Solid-State LiDAR Costs Enable ToF Sensors in European AGVs
Optical phased-array and flash LiDAR modules halved from USD 1,200 in 2024 to USD 600 in 2026 as automotive ADAS volumes scaled. European AGV builders, bound by IEC 61508 redundancy clauses, now specify solid-state LiDAR layers alongside 2-D scanners. KION shipped 2,400 such vehicles in 2025, recording a 31% reduction in high-bay mis-picks. Silicon-photonics integration on 300-mm wafers curbs labor hours from four to less than one, while France’s ADEME incentives of EUR 50 million (USD 54 million) accelerate adoption in cold-chain and pharma sites. The convergence of safety code and cost deflation boosts the laser sensor market outlook for high-mix material-handling settings.
Restraints Impact Analysis*
| Restraint | (~) % Impact on CAGR Forecast | Geographic Relevance | Impact Timeline |
|---|---|---|---|
| Price Pressure from CMOS ToF Camera Alternatives | -0.8% | Global, acute in consumer robotics and smart homes | Short term (≤ 2 years) |
| Regulatory Constraints on Class 3B and 4 Power Emissions | -0.6% | Europe, North America | Medium term (2-4 years) |
| Limited InP Epitaxy Capacity for High-Power VCSEL Arrays | -0.5% | United Kingdom, United States | Short term (≤ 2 years) |
| Edge-Compute Thermal Load Limits Sensor Fusion in Autonomous Drones | -0.4% | North America, Europe | Long term (≥ 4 years) |
| Source: ���ϲ����� | |||
Price Pressure from CMOS ToF Camera Alternatives
Depth-map cameras delivering 640×480 resolution at <USD 50 threaten laser distance sensors priced more than USD 80 in consumer robotics. ToF attach rates reached 68% of new vacuum robots in 2025. Suppliers counter by bundling on-sensor object-classification firmware, but price elasticity favors cameras in cost-driven segments. Industrial niches still shield lasers thanks to sunlight immunity and sub-millimeter accuracy, yet year-on-year entry-level ASP compression of 8-10% narrows this moat. The dynamic trims 0.8 points from the projected laser sensor market CAGR, especially in Asia-Pacific’s appliance hubs.
Regulatory Constraints on Class 3B and Class 4 Power Emissions
IEC 60825-1 obliges installations above 5 mW to deploy interlocks, shutters, and beam attenuators, adding USD 200-500 per sensor. European factories adhering to the Machinery Directive often default to Class 1-2 devices, precluding high-power profilers on open lines. Roughly 34% of SICK’s catalogue required redesign in 2025 to align with updated DGUV rules, delaying launches by up to six months. While Asia-Pacific enforcement varies, multinationals exporting to the region still apply global compliance policies, dampening short-term revenue upside. The extra cost drag subtracts another 0.6 points from laser sensor market expansion in regulated geographies.[3]U.S. Food and Drug Administration, “Laser Safety Regulations,” fda.gov
*Our updated forecasts treat driver/restraint impacts as directional, not additive. The revised impact forecasts reflect baseline growth, mix effects, and variable interactions.
Segment Analysis
By Component: Services Monetize the Installed Base
Hardware represented 82.13% of the share in 2025, driven by one-off capital purchases of multi-axis profilers that each list between USD 60,000 and USD 120,000. A growing aftermarket for traceable calibration, predictive maintenance APIs, and sensor-fusion software now captures recurring budgets as factories tie metrology assets to MES platforms, pushing services to an 11.54% CAGR. Major vendors publicized double-digit service revenue lifts in 2026, confirming that contracts guaranteeing ±10-micron accuracy across aerospace jigs command premium pricing. Subscription layers typically run three to five years, embedding vendor lock-in while smoothing earnings volatility.
Software is the connective tissue; point-cloud libraries, SPC dashboards, and AI classifiers turn raw range data into actionable insights, lifting lifetime value well beyond hardware margin. Cognex’s 2025 license, enabling interoperability with third-party lasers at USD 1,200 per seat, illustrates the trend. Meanwhile, emerging markets still allocate more capex to devices than to annual fees, sustaining hardware volume even as ASPs decline 6% each year for entry-level distance units. The combined dynamic positions services as the highest-growth pocket inside the broader laser sensor market.


By Sensor Type: Profilers Win in High-Velocity Logistics
Distance and range devices retained a 30.25% share in 2025, entrenched in fill-level, ground-clearance, and crane anti-collision tasks. Profiling and line sensors, however, are charting a CAGR of 11.71% through 2031 as parcel hubs, body-in-white lines, and tire plants intensify contour-mapping requirements. Amazon’s roll-out of 8,000 profilers cut mis-sorts by 14% in one year, validating the switch. Displacement and triangulation sensors remain critical where sub-micron scrutiny outranks speed, such as wafer bump height checks.
Price erosion and CMOS camera creep siphon volume from basic distance segments, but industrial buyers stay loyal where lasers beat cameras on glare rejection, range, and motion blur immunity. Profilers also integrate natively with AI edge modules, awarding them an early mover edge in autonomous picking and dimensioning. This advantage keeps profiling at the vanguard of laser sensor market size gains across warehousing and automotive.
By Measurement Range: Long-Range Growth Tracks Construction Digitization
Short-range units below 100 mm delivered 45.67% of the share in 2025, reflecting dominance in electronics assembly and precision machining. Medium-range devices serve packaging and automotive stamping checks, balancing the field of view with resolution. Long-range scanners above 300 mm are projected to grow 11.82% as BIM mandates require as-built verification and mining firms embrace volumetric reconciliation. FARO’s handheld 350-meter system illustrates how portability shrinks survey time by 80%, catalyzing adoption among bridge and tunnel contractors.
Short-range sensors continue to shrink in footprint; a 12 mm × 20 mm module now fits smartphone stacks, opening consumer channels. Medium-range segments face substitution from photogrammetry where surfaces are matte and line rates forgiving, but retain an edge in high-speed lines. Long-range gains benefit the overall laser sensor market size outlook by expanding total addressable surveying hours across civil infrastructure.
By Power Output: Balancing Eye Safety and Performance
The 101-500 mW slice accounted for 31.89% of the share in 2025, providing enough headroom for reflective or angled surfaces without triggering Class 3B overhead in many closed systems. Low-power Class 1-2 modules dominate consumer robotics, where BOM ceilings sit under USD 30, while industrial workhorses cluster in the 1-100 mW window. High-power sensors above 500 mW, posting an 11.42% CAGR, underpin forge alignment, hot-rolling thickness control, and glass probing at 800 °C plus.
Risk assessments under IEC 60825 and the Machinery Directive often steer open production floors toward lower classes, yet enclosed robotic cells or fiber-coupled optics allow high-power beams in mission-critical metallurgy. Diffractive optics that distribute energy across a wider spot help some suppliers skirt Class 3B thresholds while preserving the signal. Such innovations sustain high-power growth, albeit within stringent design constraints that temper broader laser sensor market share escalation.
By Dimensionality: 3-D Profilers Capture Yield-Critical Steps
One-dimensional point devices held 60.13% share in 2025, serving web-edge guides and tank-level checks at up to 1,000 parts per minute. Two-dimensional area scanners map floor plans for AMR navigation, while 3-D profilometers, growing at a 11.12% CAGR, address challenges in co-planarity, paint depth, and bread crust uniformity. A single undetected 5-micron step in a USD 500 chiplet module can unleash USD 10,000 in field failures, sharpening the cost-avoidance case for 3-D profilers.
Point sensors remain irreplaceable where scalar distance suffices and unit economics rule. Area scanners see tailwinds from e-fulfillment, yet lack height context for many QC loops. Profilers, meanwhile, harmonize with AI edge acceleration, extracting defect classes in ≤200 ms, making them the fastest-growing segment of laser sensor market demand in electronics, food, and automotive paint shops.
By End-User Industry: Logistics Tops Growth League Tables
Automotive and mobility delivered 26.83% of share in 2025, anchored in battery metrology, underbody gap checks, and color-coat validation. Yet logistics, warehousing, and robotics claim the speed crown with a 12.23% CAGR, propelled by USD 30 billion of warehouse-automation outlays in 2025 alone. Laser-equipped AMRs trim order-to-ship windows from 48 h to 24 h in India’s metros, reinforcing urgency among 3PLs and retailers.
Electronics manufacturing continues to specify laser displacement for solder paste and camera module alignment, while aerospace leverages trackers to shave fuselage jig cycles by double digits. Healthcare retains a high-value niche because FDA quality-system rules demand traceable, non-contact inspection of implant geometries. Construction and mining adopt long-range LiDAR for as-built confirmation and stockpile reconciliation, injecting fresh volume into the laser sensor market.
Geography Analysis
North America held 39.82% of the share in 2025 thanks to electric-vehicle programs, aerospace quality charters, and USD 12 billion in U.S. warehouse-automation spend. FDA 21 CFR Part 11 bolsters traceable metrology in pharmaceuticals, while Canadian aerospace lines in Quebec and Ontario trimmed jig times by double digits after switching to laser trackers. Mexico’s near-shoring boom added 18 million ft² of plant floor in 2025, many with laser-guided welding cells to satisfy OEM tolerances.
Asia-Pacific is the fastest-growing region at a 12.01% CAGR because China, Japan, and South Korea inject subsidies into smart-factory retrofits and chip packaging lines. China’s MIIT earmarked CNY 15 billion (USD 2.1 billion) for metrology upgrades, and Japan’s JPY 200 billion (USD 1.4 billion) allotment for 3-D inspection tooling lowers entry barriers for domestic fabs. India’s 45 million ft² of new Grade-A warehouse space in 2025 banks on laser-equipped AMRs for 24-hour delivery promises, extending the laser sensor market’s footprint across South Asia.
Europe grows more slowly as IEC 60825 and the Machinery Directive restrict high-power profiler deployment on open lines. Germany still accounts for 62% of regional demand, leveraging automotive and machine-tool sectors. France’s ADEME grants of EUR 50 million (USD 54 million) speed LiDAR adoption in cold-chain sites, and the U.K. aerospace corridor captures savings from composite layup defect detection. The Middle East and Africa see early traction through Saudi Arabia’s NEOM construction mega-project, while South America benefits from Brazilian automotive tool-ups despite macro volatility.

Competitive Landscape
The laser sensor market is moderately fragmented, with Keyence, SICK, OMRON, Micro-Epsilon, IFM Electronic, and others. Keyence leverages a catalog exceeding 800 SKUs and a direct-sales force to dominate design-in awards, whereas SmartRay focuses strictly on tire and lumber 3-D profiling. USPTO granted 127 laser-sensor patents in 2025, 34% covering solid-state steering and 22% focusing on on-sensor analytics that slash bandwidth by up to 80%.
Start-ups exploiting silicon-photonics integration promise 40% cost savings and sub-USD 100 pricing for industrial-grade emitters, tempting OEMs with dual-sourcing strategies. Incumbents respond through acquisitions and ecosystem plays; Hexagon bought BIM software firm Vercator to lock hardware into multi-year SaaS workflows, and Cognex offers deep-learning on-device classification that commands a 20-30% premium. Switching costs remain high in automotive paint and aerospace trim lines, where full validation can take up to a year, cushioning incumbent share.
Compliance expertise is a durable moat; vendors holding IEC 61508 SIL ratings or FDA 510(k) clearances navigate regulated tenders more easily than un-certified rivals. At the same time, white-space remains abundant; pharmaceutical tablet inspection and fresh-produce sorting together exceed USD 200 million in addressable spend where lasers still lag vision. These asymmetries underpin a steady rhythm of niche entrants and tuck-in deals, sustaining innovation while preventing any single firm from locking down the laser sensor market.
Laser Sensor Industry Leaders
Keyence Corporation
SICK AG
OMRON Corporation
Baumer Electric AG
Micro-Epsilon Messtechnik GmbH and Co. KG
- *Disclaimer: Major Players sorted in no particular order

Recent Industry Developments
- February 2026: Keyence launched the LK-H3000 ultra-high-speed displacement line, sampling 1.6 million points per second for EV electrode alignment feedback.
- January 2026: SICK earmarked EUR 45 million (USD 48 million) to triple German output of 3-D profilers and solid-state LiDAR modules.
- December 2025: Trimble acquired Vercator for USD 87 million, marrying mobile scanning hardware with real-time as-built analytics.
- November 2025: Hexagon partnered with NVIDIA to embed AI classification on Jetson Orin modules in aerospace composite scanners.


Global Laser Sensor Market Report Scope
A laser sensor is essentially a measurement-value recorder that uses laser technology to convert the measured physical value into an analog electrical signal. The market study comprises hardware, software, and services, and the vendors provide solutions to various end-users, including electronics manufacturing, aviation, construction, automotive, and others.
The Laser Sensor Market Report is Segmented by Component (Hardware, Software, and Services), Sensor Type (Distance/Range, Displacement, Profiling/Line, Vibration and Energy, Triangulation, and Other Types), Measurement Range (Less than 100 mm, 100-300 mm, and Greater than 300 mm), Power Output (Less than 1 mW, 1-100 mW, 101-500 mW, and Greater than 500 mW), Dimensionality (1D Point, 2D Area, and 3D Profile), End-user Industry (Electronics, Automotive, Aerospace, Construction, Healthcare, Food and Beverage, Logistics, and Other Industries), and Geography (North America, South America, Europe, Asia-Pacific, and Middle East and Africa). The Market Forecasts are Provided in Terms of Value (USD).
| Hardware |
| Software |
| Services |
| Distance / Range Sensors |
| Displacement Sensors |
| Profiling / Line Sensors |
| Vibration and Energy Sensors |
| Triangulation Sensors |
| Other Sensor Types |
| Less than 100 mm (Short-Range) |
| 100-300 mm (Medium-Range) |
| Greater than 300 mm (Long-Range) |
| Less than 1 MW |
| 1-100 MW |
| 101-500 MW |
| Greater than 500 MW |
| 1D Point Sensors |
| 2D Area Sensors |
| 3D Profile Sensors |
| Electronics Manufacturing |
| Automotive and Mobility |
| Aerospace and Aviation |
| Building and Construction |
| Healthcare and Medical Devices |
| Food and Beverage Processing |
| Logistics, Warehousing and Robotics |
| Other End-user Industries |
| North America | United States | |
| Canada | ||
| Mexico | ||
| South America | Brazil | |
| Argentina | ||
| Rest of South America | ||
| Europe | Germany | |
| United Kingdom | ||
| France | ||
| Italy | ||
| Rest of Europe | ||
| Asia-Pacific | China | |
| Japan | ||
| South Korea | ||
| Australia | ||
| India | ||
| Rest of Asia-Pacific | ||
| Middle East and Africa | Middle East | Saudi Arabia |
| United Arab Emirates | ||
| Turkey | ||
| Rest of Middle East | ||
| Africa | South Africa | |
| Egypt | ||
| Rest of Africa | ||
| By Component | Hardware | ||
| Software | |||
| Services | |||
| By Sensor Type | Distance / Range Sensors | ||
| Displacement Sensors | |||
| Profiling / Line Sensors | |||
| Vibration and Energy Sensors | |||
| Triangulation Sensors | |||
| Other Sensor Types | |||
| By Measurement Range | Less than 100 mm (Short-Range) | ||
| 100-300 mm (Medium-Range) | |||
| Greater than 300 mm (Long-Range) | |||
| By Power Output | Less than 1 MW | ||
| 1-100 MW | |||
| 101-500 MW | |||
| Greater than 500 MW | |||
| By Dimensionality | 1D Point Sensors | ||
| 2D Area Sensors | |||
| 3D Profile Sensors | |||
| By End-user Industry | Electronics Manufacturing | ||
| Automotive and Mobility | |||
| Aerospace and Aviation | |||
| Building and Construction | |||
| Healthcare and Medical Devices | |||
| Food and Beverage Processing | |||
| Logistics, Warehousing and Robotics | |||
| Other End-user Industries | |||
| By Geography | North America | United States | |
| Canada | |||
| Mexico | |||
| South America | Brazil | ||
| Argentina | |||
| Rest of South America | |||
| Europe | Germany | ||
| United Kingdom | |||
| France | |||
| Italy | |||
| Rest of Europe | |||
| Asia-Pacific | China | ||
| Japan | |||
| South Korea | |||
| Australia | |||
| India | |||
| Rest of Asia-Pacific | |||
| Middle East and Africa | Middle East | Saudi Arabia | |
| United Arab Emirates | |||
| Turkey | |||
| Rest of Middle East | |||
| Africa | South Africa | ||
| Egypt | |||
| Rest of Africa | |||


Key Questions Answered in the Report
How quickly is the laser sensor market expected to grow between 2026 and 2031?
It is projected to expand at a 10.53% CAGR, reaching USD 1.51 billion by 2031.
Which end-user segment is forecast to post the strongest revenue growth through 2031?
Logistics, warehousing, and robotics is set to lead with a 12.23% CAGR as automated guided vehicles and AMRs proliferate.
What geographic area offers the highest growth potential for laser sensor suppliers?
Asia-Pacific is the fastest-growing region, rising at 12.01% CAGR due to smart-factory subsidies in China, Japan, and South Korea.
Why are profiling and line sensors gaining share over basic distance units?
Warehouses and automotive plants need full contour data for real-time QC and dimensioning, driving profiling sensors to an 11.71% CAGR.
What is the main pricing threat to entry-level laser distance sensors?
Sub-USD 50 CMOS time-of-flight cameras now meet many accuracy needs in consumer and light-robotics products, compressing laser ASPs by 8-10% each year.
How are suppliers boosting recurring revenue beyond hardware sales?
Vendors bundle calibration contracts, predictive-maintenance subscriptions, and sensor-fusion software, pushing services toward an 11.54% CAGR.
Page last updated on:


