Indonesia E-Commerce Logistics Market Size and Share
Market Overview
| Study Period | 2020 - 2031 |
|---|---|
| Forecast Data Period | 2026 - 2031 |
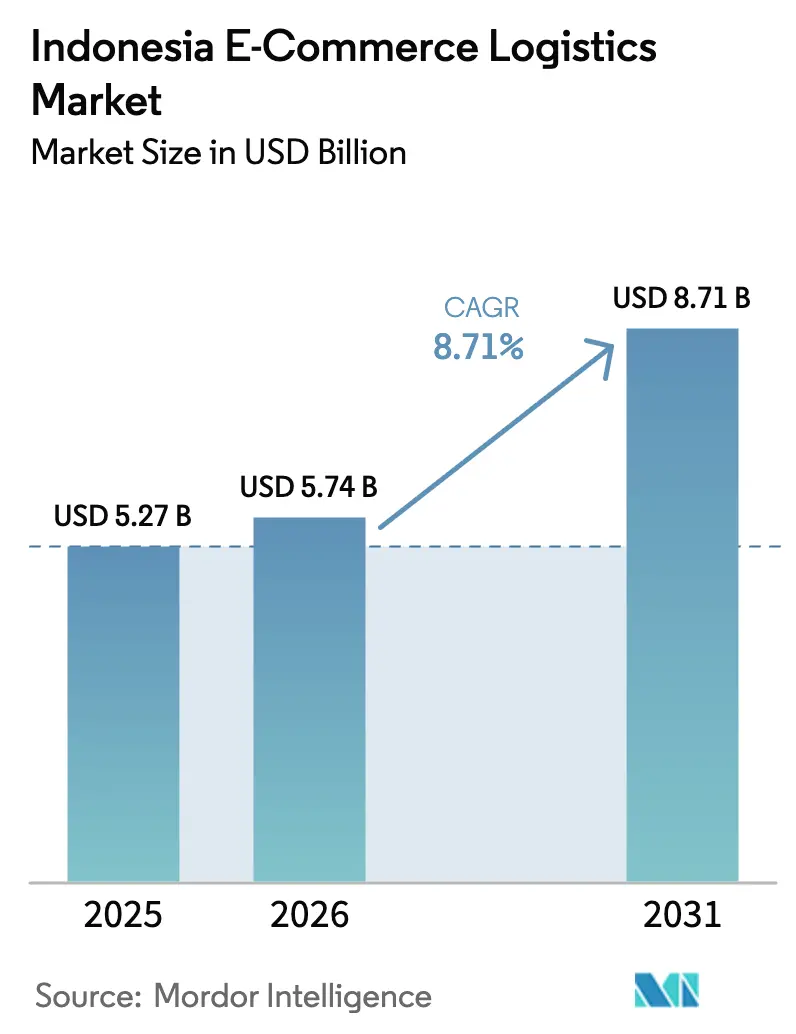
| Base Year Market Size (2025) | USD 5.27 Billion |
| Market Size (2026) | USD 5.74 Billion |
| Market Size (2031) | USD 8.71 Billion |
| Growth Rate (2026 - 2031) | 8.71% CAGR |
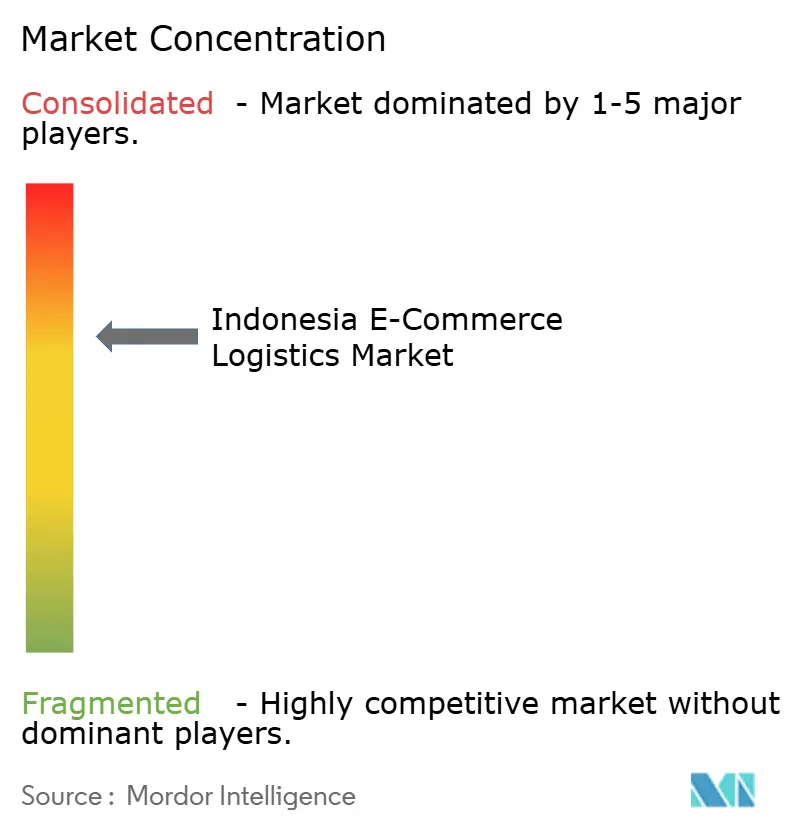
| Market Concentration | Medium |
Major Players *Disclaimer: Major Players sorted in no particular order Image © ���ϲ�����. Reuse requires attribution under CC BY 4.0. | |
Indonesia E-Commerce Logistics Market Analysis by ���ϲ�����
The Indonesia e-commerce logistics market size is expected to grow from USD 5.27 billion in 2025 to USD 5.74 billion in 2026 and is forecasted to reach USD 8.71 billion by 2031, at 8.71% CAGR over 2026-2031.
Live-streaming commerce, platform-captive delivery networks, and cold-chain build-outs are reshaping competitive dynamics, while regulatory mandates for electronic proof of delivery (e-POD) are tightening compliance requirements. Platform-owned fleets already cover nearly two-fifths of marketplace parcels, and government carbon-credit incentives accelerate electric-vehicle (EV) adoption, lowering long-run operating costs. At the same time, urban congestion and fuel-price volatility intensify cost pressures, prompting providers to deploy micro-fulfillment hubs and two-wheeler fleets for final-kilometer delivery. Growth opportunities center on value-added services, cold-chain capacity, tier-2 city rollout, and cross-border enablement for artisan exporters, all of which underpin steady expansion of the Indonesia e-commerce logistics market.
Key Report Takeaways
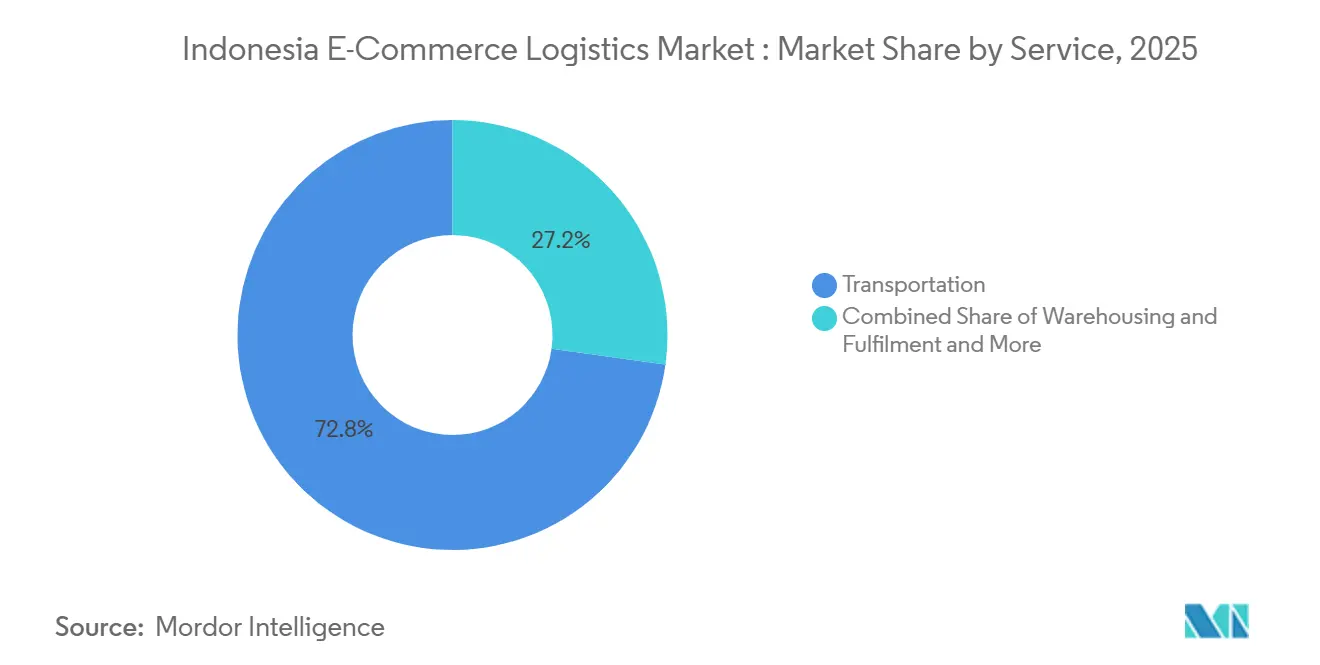
- By service, transportation captured 72.78% of the Indonesia e-commerce logistics market share in 2025, while value-added services are forecast to expand at a 10.39% CAGR to 2031.
- By business model, the B2C segment accounted for 75.23% of the Indonesia e-commerce logistics market size in 2025, whereas C2C logistics recorded the highest projected CAGR of 13.40% through 2031.
- By destination, domestic shipments accounted for 86.90% of the Indonesia e-commerce logistics market size in 2025; cross-border logistics is advancing at a 9.39% CAGR to 2031.
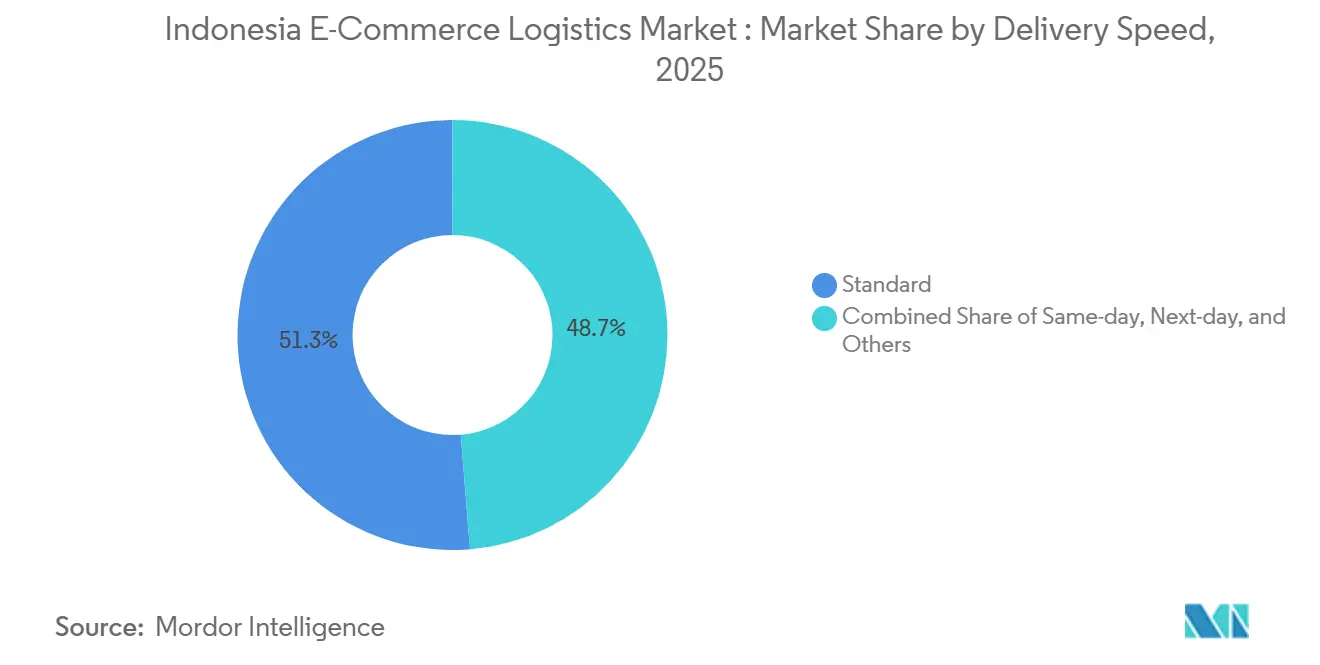
- By delivery speed, standard services maintained 51.28% share of the Indonesia e-commerce logistics market share in 2025, yet same-day delivery is progressing at a 9.12% CAGR over the forecast period.
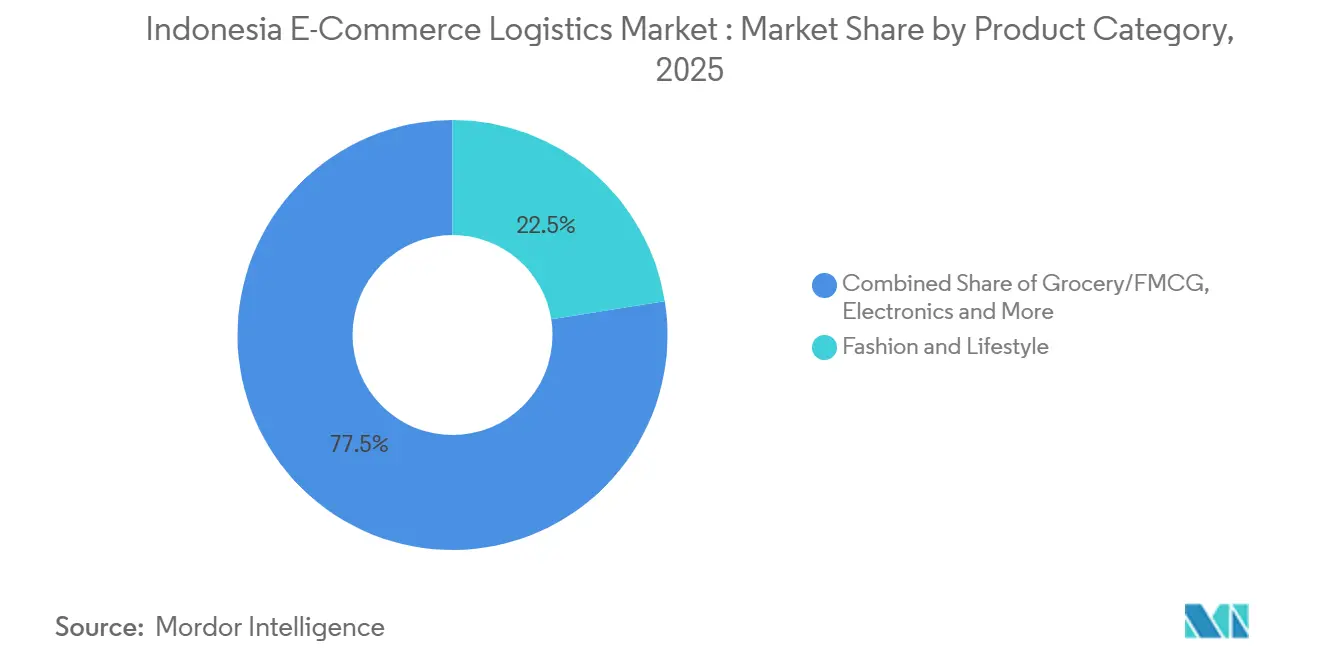
- By product category, grocery/FMCG logistics is set to grow at a market-leading 10.49% CAGR, outpacing fashion & lifestyle volumes that contributed 22.52% in 2025.
- By city tier, tier-2 locations posted the fastest trajectory, with an 11.45% CAGR outlook, while tier-1 cities accounted for 58.77% of overall activity in 2025.
- By region, West Java commanded an 18.20% share in 2025, and East Java is on track for a 10.87% CAGR, positioning Surabaya as the primary eastern consolidation hub.
Note: Market size and forecast figures in this report are generated using ���ϲ�����’s proprietary estimation framework, updated with the latest available data and insights as of 2026.
Indonesia E-Commerce Logistics Market Trends and Insights
Drivers Impact Analysis*
| Driver | (~) % Impact on CAGR Forecast | Geographic Relevance | Impact Timeline |
|---|---|---|---|
| Live-stream & social-commerce boom drives higher parcel frequency | +2.3% | National focus on Jakarta, Bandung, Surabaya, plus tier-2 rollouts | Short term (≤ 2 years) |
| Platform-owned captive logistics arms extend next-hour reach | +1.9% | Metro Jakarta, Surabaya, Bandung, Medan; tier-2 expansion pipeline | Medium term (2-4 years) |
| Cold-chain surge from online grocery, vaccines & pharma e-tail | +1.6% | Urban centers and provincial capitals with healthcare nodes | Medium term (2-4 years) |
| Nation-wide e-POD mandate cuts return losses | +1.2% | Country-wide, with urban fraud hot-spots prioritized | Short term (≤ 2 years) |
| Carbon-credit incentives accelerate EV fleets | +1.4% | Java corridor and major cities with charging build-outs | Long term (≥ 4 years) |
| 5G private networks in mega-fulfillment hubs enable real-time robotics | +1.1% | Industrial zones in West Java, East Java, and Banten | Medium term (2-4 years) |
| Source: ���ϲ����� | |||
Live-Stream & Social-Commerce Boom Drives Higher Parcel Frequency
Live-stream shopping compresses buying decisions, leading to more frequent, smaller-ticket orders that lift parcel counts per customer. TikTok Shop’s December 2024 return, driven by a USD 1.5 billion partnership with Tokopedia, reached 3.2 million daily checkouts by March 2025. Users are placing 4.7 orders monthly, more than double traditional browsing activity, challenging logistics providers to process higher volumes without commensurate revenue per piece. Parcel density is higher in neighborhoods where influencers are headquartered, enabling route optimization but requiring flexible, on-demand pickups from home-based sellers. Rising compliance oversight under the Ministry of Trade transparency rules rewards established carriers with robust digital documentation. In aggregate, live-stream commerce adds an estimated 2.3 percentage points to the forecast CAGR of the Indonesia e-commerce logistics market.
Platform-Owned Captive Logistics Arms Extend Next-Hour Reach
Marketplaces internalize delivery to secure service quality and margin. Shopee Express already serves 487 cities and accounts for 41% of Shopee parcels, offering two-hour windows in 12 metros[1].Shopee, Lazada Build Own Logistics Networks in Indonesia, Bloomberg, bloomberg.com Lazada eLogistics operates 73 automated hubs processing 850,000 packages daily. Proprietary networks leverage demand visibility and inventory data to pre-position goods close to buyers, enabling predictive routing that supports next-hour commitments across dense corridors. However, the capital burden and draft marketplace regulations that require neutral access for third-party couriers could narrow their advantage. The shift pushes mid-tier independents toward niche capabilities, such as cold-chain or cross-border expertise, and is expected to lift the growth of the Indonesia e-commerce logistics market by roughly 1.9 percentage points during 2026-2031.
Cold-Chain Surge From Online Grocery, Vaccines & Pharma E-Tail
Quick-commerce grocery platforms and legalized online pharma sales expand chilled-parcel requirements. Lion Parcel invested IDR 250 billion (USD 16 million) in temperature-controlled vehicles while J&T Express added 82 refrigerated hubs in 2025. Ministry of Health Regulation 20/2024 allows courier drug delivery, provided operators meet GDP standards, creating high entry barriers that favor established cold-chain specialists. Vaccine programs increasingly tap private networks for last-mile reach, ensuring stable baseline volumes. Power reliability gaps in smaller cities necessitate backup generators, increasing capital requirements while still incentivizing growth, as margins on chilled shipments remain premium. Overall, cold-chain momentum adds 1.6 percentage points to the sector’s CAGR.
Nation-Wide E-POD Mandate Cuts Return Losses
Mandatory electronic proof-of-delivery (e-POD), effective Q3 2026, will target annual fraud losses of IDR 2.1 trillion (USD 130 million) and require GPS-stamped confirmation and digital signatures[2]Kemkominfo Dorong Implementasi e-POD Logistik Nasional, Ministry of Communication and Informatics, kominfo.go.id . Large carriers face a one-off investment of USD 15-25 million in mobile apps and backend systems, yet benefit from lower false ‘not-received’ claims, improved cash flow, and granular driver analytics. Smaller couriers risk compliance costs that may spur consolidation. The regulation is projected to add about 1.2 percentage points to market CAGR by improving profitability and consumer trust.
Restraints Impact Analysis*
| Restraint | (~) % Impact on CAGR Forecast | Geographic Relevance | Impact Timeline |
|---|---|---|---|
| Urban congestion & low-emission zones slow last-mile drop density | -1.3% | Jakarta, Surabaya, Bandung, plus additional metros | Short term (≤ 2 years) |
| Fuel-price volatility after subsidy reforms inflates delivery costs | -1.1% | Nationwide, acute on inter-island routes | Short term (≤ 2 years) |
| Upcoming compulsory e-invoices add MSME compliance delays | -0.9% | National, small merchants, and regional couriers | Medium term (2-4 years) |
| Lack of battery-recycling capacity hampers EV scalability | -0.7% | Java corridor and cities pursuing EV fleets | Long term (≥ 4 years) |
| Source: ���ϲ����� | |||
Urban Congestion & Low-Emission Zones Slow Last-Mile Drop Density
Jakarta peak-hour speeds fell to 11 km/h in 2025, reducing driver productivity and compelling fleet expansion to preserve service levels[3]Jakarta Traffic Congestion Analysis 2025, Jakarta Smart City, smartcity.jakarta.go.id.. Proposed low-emission zones will bar older diesel vans during daytime in core districts, disrupting 68% of existing routes. Surabaya and Bandung pilots impose similar access rules, burdening operators of aging fleets. Micro-fulfillment hubs and two-wheeler couriers partially offset congestion yet require expensive urban real estate. Altogether, regulatory and traffic headwinds are estimated to trim 1.3 percentage points from the CAGR of the Indonesia E-commerce Logistics market in the near term.
Fuel-Price Volatility After Subsidy Reforms Inflates Delivery Costs
Diesel rose 28% to IDR 8,700 (USD 0.54) per liter in January 2025, adding roughly 10-12% to overall logistics costs since fuel comprises more than one-third of operating expenses. Market-based pricing introduces volatility, complicates contract bidding, and encourages quarterly surcharges. Inter-island shipping faces heightened exposure, prompting some traffic to shift to air freight or delaying discretionary purchases. Elevated fuel costs also accelerate EV payback calculations, though infrastructure gaps slow fleet turnover. Net impact is a 1.1 percentage-point drag on forecast growth.
*Our updated forecasts treat driver/restraint impacts as directional, not additive. The revised impact forecasts reflect baseline growth, mix effects, and variable interactions.
Segment Analysis
By Service: Value-Added Services Expand Premium Differentiation
Transportation retained 72.78% of 2025 revenue, yet value-added modules are projected to grow at a 10.39% CAGR, widening their slice of the Indonesia e-commerce logistics market share. Merchants now view branded packaging, kitting, and returns orchestration as core to customer retention. Authentication and pre-delivery inspection reduced return rates for fashion and electronics by up to 25%. At the same time, the road-based backbone benefits from new toll corridors, such as the 117-kilometer Semarang-Demak expressway that cuts Central Java transit times by 35%[4]Patimban Access Toll Road Completion 2025, Ministry of Public Works, pu.go.id. . Sea freight continues to link the archipelago, though low sailing frequencies east of Java preserve multi-day windows.
Warehousing absorbs surging inventory as platforms decentralize stock. Modern Grade-A supply grew markedly across the industrial belts of Jakarta, Surabaya, and Bandung, supporting same-day delivery. Even without rail expansion, multi-modal nodes integrate air cargo uplift where wide-body conversions bolstered dedicated capacity by 22% in 2025. Strategic interplay between core transport and wrap-around services therefore sets the pace for value creation inside the Indonesia e-commerce logistics market.


By Business Model: C2C Momentum Reshapes Networks
B2C channels maintained a leading 75.23% share in the Indonesia e-commerce logistics market size in 2025. However, C2C parcels are forecast to grow 13.40% annually, resulting in outsized parcel counts relative to ticket value. Peer-to-peer marketplaces, live-stream influencers, and resale apps collectively registered 127 million trades in 2025, demanding residential pickups, lightweight packaging, and escrow-anchored returns. Dropship models blur traditional lines, forcing carriers to harmonize B2C service levels with C2C variability.
Large marketplaces continue to wield scale leverage, pressuring courier tariffs yet enabling collaborative forecasting that improves route fill rates. Meanwhile, enterprises digitize procurement workflows, prompting steady B2B logistics demand for just-in-time restocks and system integration. The Indonesia e-commerce logistics market size linked to C2C therefore broadens overall service portfolios and accelerates the adoption of mobile point-of-sale tools for informal merchants.
By Destination: Cross-Border Access Broadens Export Reach
Domestic traffic accounted for 86.90% of 2025 parcels of Indonesia e-commerce logistics market share. Cross-border parcels still account for a minor share but are projected to grow at a 9.39% CAGR, buoyed by streamlined clearance for shipments under USD 1,500 after PMK 4/2025. Government initiatives under the National Logistics Ecosystem (NLE) ease documentation bottlenecks and reduce inter-agency hand-offs that historically slowed island-to-island flows.
Consequently, providers are elevating service reliability with 94% on-time ratios on Java corridors. Indonesian artisans tap Etsy and Amazon Handmade while inbound flows from China fuel fast-fashion restocks. Competent customs brokers and compliance advisors, therefore, form lucrative niches within the Indonesian e-commerce logistics industry.
By Delivery Speed: Same-Day Premium Gains Urban Tractio
Standard 3-5-day services still accounted for 51.28% of revenue in 2025, balancing costs and customer expectations. Same-day delivery, however, is forecast to grow at a 9.12% CAGR through 2031 in Indonesia e-commerce logistics market size, anchored by quick-commerce models that charge 3-5 times the standard tariff for immediate gratification. Micro-fulfillment dark stores aligned with AI demand-forecast engines now achieve 85% first-attempt success in Jakarta and Surabaya.
Next-day serves as a middle ground, leveraging hub-and-spoke line-haul combined with city-sort mini-hubs. Deliveries that take more than 5 days tend to involve bulky furniture or deliveries to remote islands; providers address service-level anxiety through milestone alerts and guaranteed slots. Across these tiers, data-driven fleet scheduling and locker networks underpin profitability improvements for the Indonesia e-commerce logistics market.
By Product Category: Grocery/FMCG Fuels Cold-Chain Build-Out
Fashion & lifestyle accounted for 22.5% of the Indonesia e-commerce logistics market share in 2025, propelled by social media trends that generate high returns and thereby sizeable reverse logistics flows. Grocery and FMCG parcels are set to grow at a 10.49% CAGR through 2031, reflecting the rising acceptance of online baskets for fresh produce, frozen food, and household staples. Cold-chain vehicle fleets and GDP-grade depots, such as Lion Parcel’s new Tangerang site, will strengthen compliance and expand the geographic reach. Subscription staples like rice and diapers improve volume predictability, lifting load factors.
Electronics and appliances necessitate white-glove handling and insurance coverage, while furniture orders require scheduled assembly crews, adding complexity that increases average revenue per order inside the Indonesia e-commerce logistics market.
By City Tier: Tier-2 Cities Lead Growth Wave
Tier-1 metros-Jakarta, Surabaya, Bandung, and Medan-accounted for 58.8% of Indonesia e-commerce logistics market in 2025 volumes, thanks to their dense populations and high purchasing power. Yet expansion headroom is tapering as infrastructure matures and competition keeps margins thin.
Tier-2 cities such as Semarang, Palembang, and Balikpapan are forecast to grow at a 11.45% CAGR on the back of 73% digital wallet penetration and industrial park development. Warehouse rents remain 45-60% below Jakarta averages, supporting regional fulfillment hubs that improve delivery times and cost efficiency. Successful players calibrate service offerings to each tier’s density and affordability thresholds, enabling the Indonesia e-commerce logistics market to sustain double-digit growth outside primary conurbations.
Geography Analysis
West Java’s 18.2% market share in Indonesia e-commerce logistics market in 2025 stems from its manufacturing density and adjacency to Jakarta’s 11.2 million high-spend consumers. New toll access to Patimban port reduces door-to-port transit times, enabling same-day repositioning of import containers and supporting hub-and-spoke deliveries to Bandung, Bekasi, and Bogor. Rapid urbanization, however, inflates land values above USD 4.20 per square meter per month, spurring a shift of large cross-docks to the Karawang and Cikampek fringes.
East Java posts the swiftest advance with a 10.87% CAGR outlook. Surabaya anchors eastern archipelago flows; Tanjung Perak port’s throughput jumped 18% in 2025 on inbound e-commerce goods and outbound agro-industrial exports. Highway builds like Probowangi slash coast-to-coast trips, letting carriers promise next-day reach across the province’s 38.8 million residents. Multinationals installing regional plants further deepen B2B demand that feeds the Indonesia e-commerce logistics market.
Central Java’s Semarang hub leverages the new Semarang-Demak toll to connect northern towns and eastern seaports. Jakarta, despite space and traffic constraints, remains the highest-value destination, propelling micro-fulfillment embedded in residential towers and motorbike couriers weaving through congestion. Banten gains from Soekarno-Hatta air-cargo links plus the future Patimban deep-sea terminal, inserting itself as an intermodal gateway. The remaining provinces, Sumatra, Kalimantan, Sulawesi, and Papua, offer long-term upside but require patient capital to overcome low drop densities and elevated inter-island freight costs.
Competitive Landscape
The field is medium-fragmented between large tech-enabled generalists and focused specialists. Shopee Express, Lazada eLogistics, and Tokopedia-allied networks carried 38% of marketplace parcels in 2025, cornering scale efficiencies and pushing standard-parcel margins lower. Independent giants such as J&T Express and SiCepat counter by accelerating EV rollouts and expanding their temperature-controlled fleets to serve the grocery, pharma, and electronics segments.
Mid-tier couriers face consolidation pressure as e-POD compliance and EV capex stretch balance sheets. Niche providers prosper in areas such as pharmaceutical cold chain, reverse logistics optimization, and cross-border customs brokerage. Technology is a decisive separator: AI route engines, automated sortation, and blockchain traceability now set the baseline expectations, as evidenced by TIKI’s 2025 secure-electronics tracking pilot.
Opportunities lie in battery-swapping infrastructure, e-POD software for MSME fleets, and regional sortation hubs aimed at tier-2 growth corridors. Super-apps GoSend and Grab Express exploit existing rider networks to blend on-demand food and parcel delivery. Regulatory guardrails, courier licensing, fair-access rules for captive platforms, and carbon-trading thresholds shape strategy choices, favoring operators with compliance credentials and capital depth.
Indonesia E-Commerce Logistics Industry Leaders
JNE Express
J&T Express
SiCepat Ekspres
Ninja Xpress
Lion Parcel
- *Disclaimer: Major Players sorted in no particular order

Recent Industry Developments
- February 2026: FedEx secured Halal Logistics Certification in Indonesia, enhancing service reliability for businesses requiring halal-compliant supply chain handling and strengthening local value-added logistics offerings.
- January 2026: J&T Express announced it had surpassed 30 billion parcels shipped in 2025, with Indonesia contributing an over 60% YoY increase, underscoring expanded operations and demand in Southeast Asia.
- November 2025: Pos Indonesia and SiCepat Ekspres officially began an integrated logistics service initiative to expand reach and improve delivery performance across networks.
- July 2025: Lion Parcel emphasised expanding its agent partner network to improve accessibility in urban and remote areas, driven by growing e-commerce parcel demand.


Indonesia E-Commerce Logistics Market Report Scope
| Transportation | Road |
| Rail | |
| Air | |
| Sea | |
| Warehousing & Fulfilment | |
| Value-Added Services (Labelling, Packaging, Kitting) |
| B2C |
| B2B |
| C2C |
| Domestic |
| Cross-border (international) |
| Same-day (less than 24 h) |
| Next-day (24–48 h) |
| Standard (3-5 days) |
| Others (more than 5 days) |
| Foods & Beverages |
| Personal & Household Care |
| Fashion & Lifestyle (accessories, apparel, footwear) |
| Furniture |
| Consumer Electronics & Household Appliances |
| Other Products |
| Tier 1 |
| Tier 2 |
| Tier 3 and Below |
| Central Java |
| East Java |
| West Java |
| Jakarta |
| Banten |
| Rest of Provinces |
| By Service | Transportation | Road |
| Rail | ||
| Air | ||
| Sea | ||
| Warehousing & Fulfilment | ||
| Value-Added Services (Labelling, Packaging, Kitting) | ||
| By Business Model | B2C | |
| B2B | ||
| C2C | ||
| By Destination | Domestic | |
| Cross-border (international) | ||
| By Delivery Speed | Same-day (less than 24 h) | |
| Next-day (24–48 h) | ||
| Standard (3-5 days) | ||
| Others (more than 5 days) | ||
| By Product Category | Foods & Beverages | |
| Personal & Household Care | ||
| Fashion & Lifestyle (accessories, apparel, footwear) | ||
| Furniture | ||
| Consumer Electronics & Household Appliances | ||
| Other Products | ||
| By City Tier | Tier 1 | |
| Tier 2 | ||
| Tier 3 and Below | ||
| By Provinces | Central Java | |
| East Java | ||
| West Java | ||
| Jakarta | ||
| Banten | ||
| Rest of Provinces |


Key Questions Answered in the Report
How large will Indonesia’s e-commerce parcel logistics spend be by 2031?
The Indonesia E-commerce Logistics market size is projected to reach USD 8.71 billion by 2031, up from USD 5.74 billion in 2026.
Which service line is expanding fastest inside parcel logistics?
Value-added services such as kitting, branded packaging, and returns management are forecast to grow at a 10.39% CAGR through 2031.
Why are electric vehicles gaining traction among Indonesian couriers?
Carbon-credit incentives, fuel-price volatility, and 0% luxury tax on commercial EVs cut the total cost of ownership, supporting payback within about four years
Which Indonesian province offers the strongest logistics growth outlook?
East Java is expected to post a 10.87% CAGR as Surabaya becomes the eastern archipelago’s consolidation hub and port throughput climbs.
How will the e-POD regulation affect parcel operators?
From Q3 2026, all couriers must capture GPS-stamped digital signatures, which reduces fraud losses but requires sizeable IT and device investments.
What drives the rise of same-day delivery options?
Urban consumers pay premiums for immediacy, and micro-fulfillment centers plus AI routing enable profitable same-day models, especially in tier-1 metros.
Page last updated on:


