Genomic Biomarkers Market Size and Share
Market Overview
| Study Period | 2020 - 2031 |
|---|---|
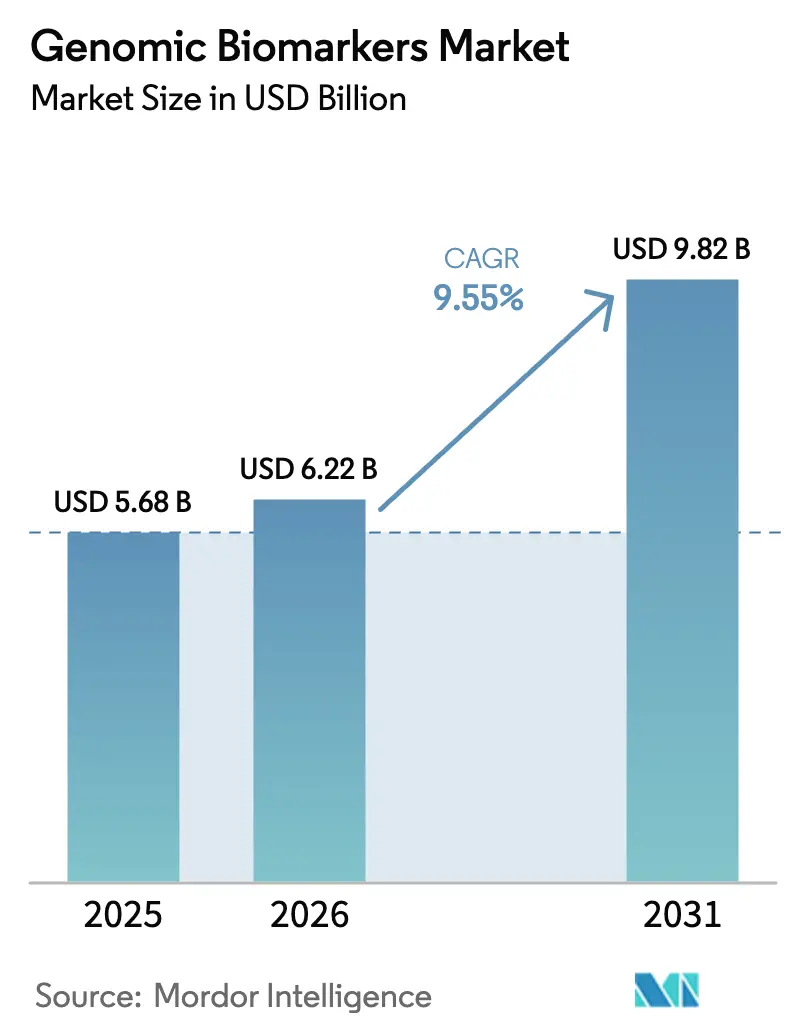
| Market Size (2026) | USD 6.22 Billion |
| Market Size (2031) | USD 9.82 Billion |
| Growth Rate (2026 - 2031) | 9.55% CAGR |
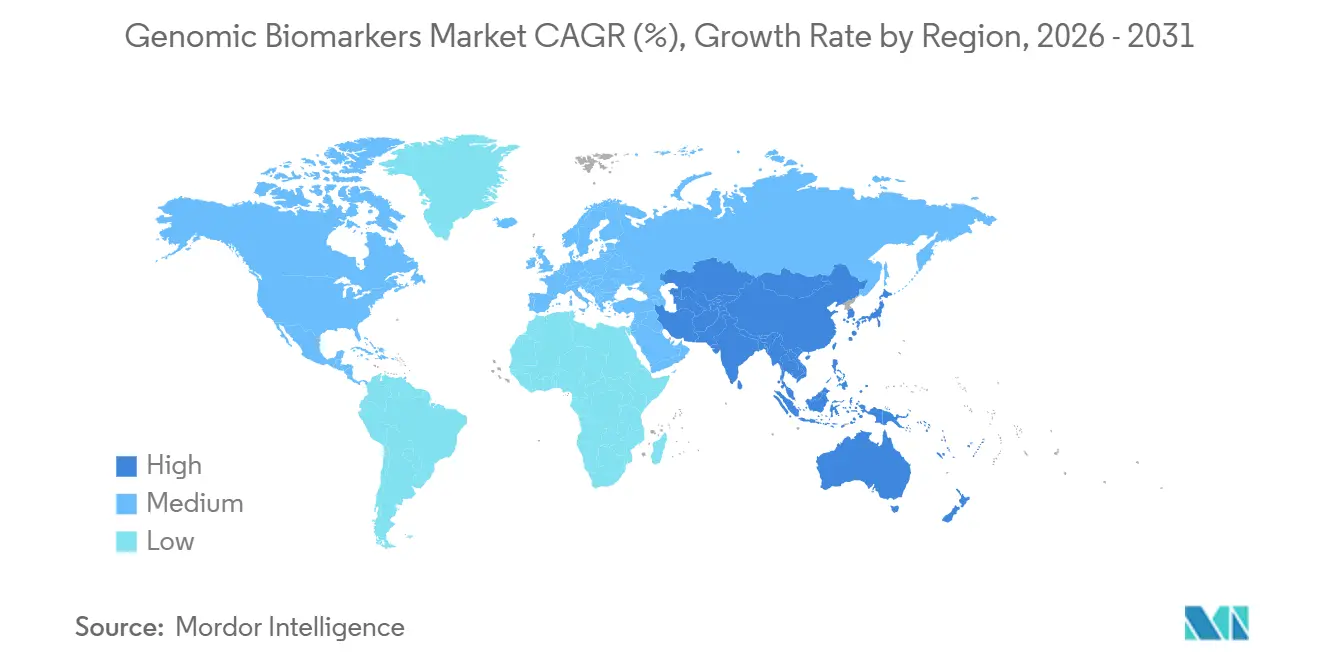
| Fastest Growing Market | Asia Pacific |
| Largest Market | North America |
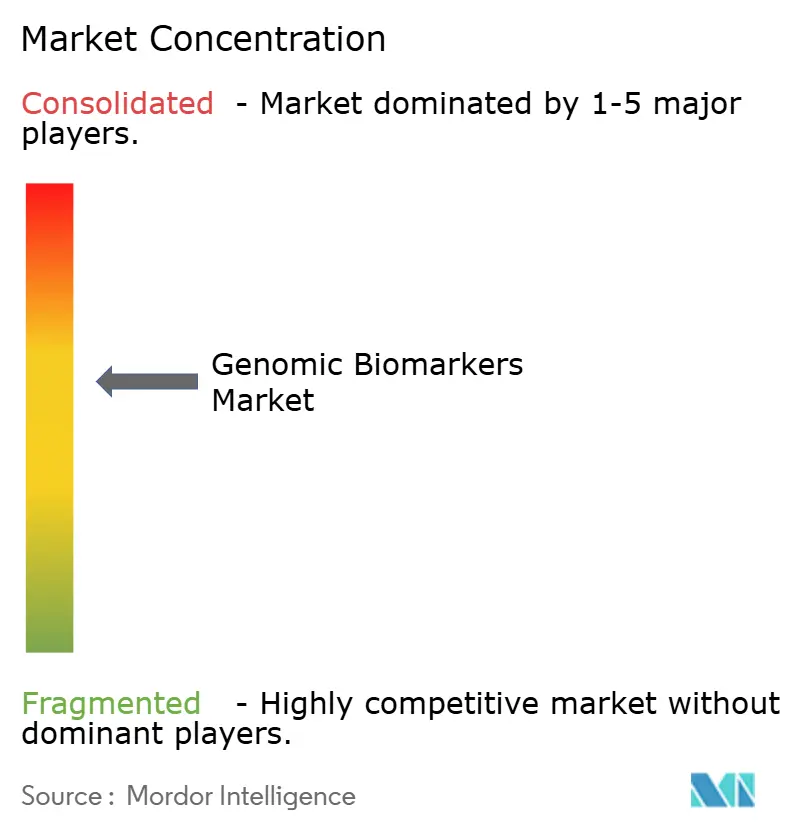
| Market Concentration | Medium |
Major Players *Disclaimer: Major Players sorted in no particular order Image © ���ϲ�����. Reuse requires attribution under CC BY 4.0. | |
Genomic Biomarkers Market Analysis by ���ϲ�����
The Genomic Biomarkers Market size is projected to be USD 5.68 billion in 2025, USD 6.22 billion in 2026, and reach USD 9.82 billion by 2031, growing at a CAGR of 9.55% from 2026 to 2031.
Sustained expansion reflects a pivot from symptom-driven testing to proactive risk stratification as sequencing costs drop below USD 200 per whole genome, cloud-based federated learning unlocks rare-disease insights, and Fortune 500 employers add genetic benefits to self-funded plans. Oncology still anchors revenue, yet cardiovascular panels are advancing fastest as polygenic risk scores become routine in primary care. Diagnostic laboratories dominate today, but pharmaceutical sponsors are adopting genomic endpoints in adaptive Phase II trials, tightening links between biomarker discovery and drug development. NGS remains the workhorse technology; however, PCR assays are resurging in point-of-care pharmacogenomics, while Asia-Pacific national genome programs accelerate demand beyond traditional strongholds.
Key Report Takeaways
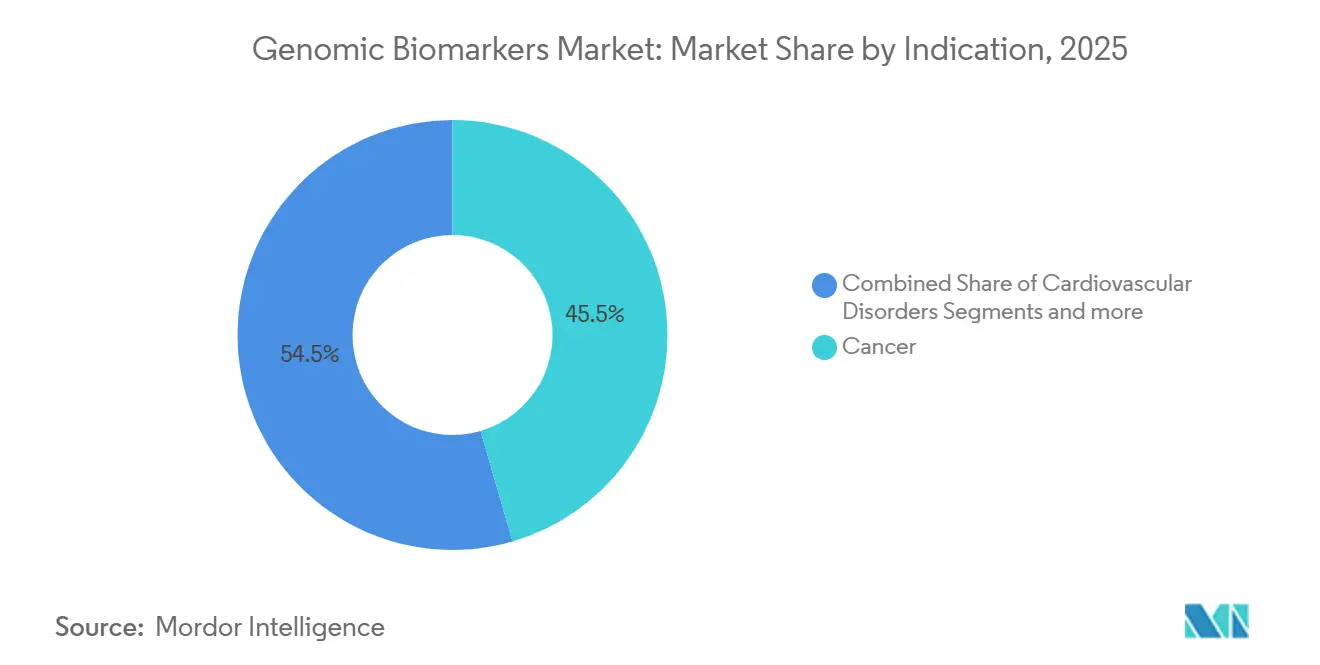
- By indication, oncology led with 45.55% revenue share in 2025, while cardiovascular genomic panels are projected to expand at a 13.85% CAGR through 2031.
- By end user, diagnostic laboratories held 38.53% of 2025 revenue, whereas pharmaceutical and biotechnology companies are on track for a 12.75% CAGR to 2031.
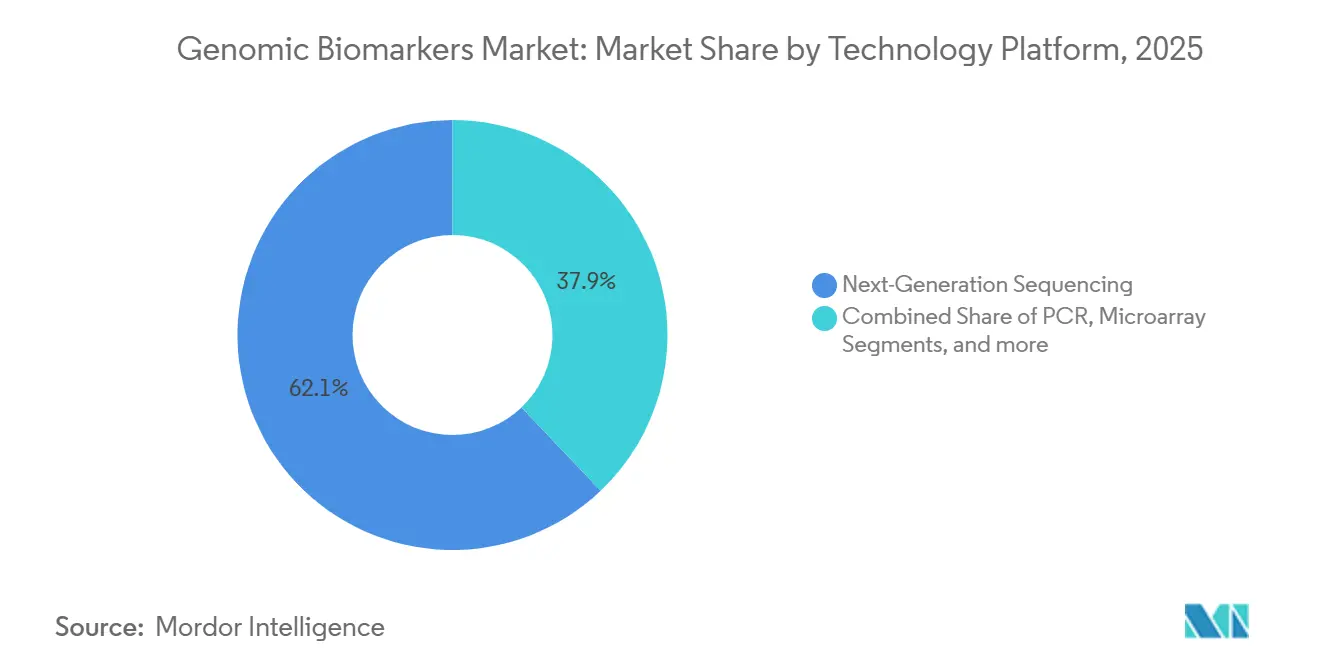
- By technology, NGS platforms captured 62.15% of 2025 revenue, and PCR-based assays are forecast to grow at an 11.82% CAGR.
- By biomarker type, predictive biomarkers accounted for 54.52% of 2025 revenue, while prognostic biomarkers are advancing at an 11.12% CAGR.
- By geography, North America commanded 38.55% genomic biomarkers market share in 2025, and Asia-Pacific is poised for an 11.72% CAGR through 2031.
Note: Market size and forecast figures in this report are generated using ���ϲ�����’s proprietary estimation framework, updated with the latest available data and insights as of January 2026.
Global Genomic Biomarkers Market Trends and Insights
Drivers Impact Analysis
| Driver | (~) % Impact on CAGR Forecast | Geographic Relevance | Impact Timeline |
|---|---|---|---|
| Rising prevalence of chronic & lifestyle diseases | +1.8% | Global, with acute burden in North America, Europe, and urban Asia-Pacific | Medium term (2-4 years) |
| Breakthroughs in NGS, multi-omics & AI bioinformatics | +2.1% | Global, led by North America and Europe; rapid adoption in China, South Korea | Short term (≤2 years) |
| Mainstreaming of precision-medicine reimbursement models | +1.5% | North America, Western Europe; pilot programs in Australia, Japan | Medium term (2-4 years) |
| National population genomic-screening programmes | +1.3% | UK, US, China, India, Japan, Saudi Arabia | Long term (≥4 years) |
| Employer-sponsored genetic-benefit plans in self-insured firms | +0.9% | North America, with early adoption in Singapore, UAE | Short term (≤2 years) |
| Federated cloud learning accelerating rare-disease biomarker discovery | +1.0% | Global, with infrastructure concentrated in North America, Europe | Medium term (2-4 years) |
| Source: ���ϲ����� | |||
Rising Prevalence of Chronic and Lifestyle Diseases
Cancer, cardiovascular disorders, and metabolic syndromes collectively drive demand for earlier detection and individualized treatment planning. Noncommunicable diseases caused 74% of global deaths in 2024, with cancer responsible for nearly 10 million fatalities[1]World Health Organization, “Noncommunicable Diseases Fact Sheet,” WHO, WHO.INT. The American Cancer Society projects more than 2 million new U.S. cancer diagnoses in 2026, reinforcing sustained need for tumor profiling and liquid biopsy monitoring. Polygenic risk scores now flag asymptomatic adults at elevated risk of coronary artery disease decades before onset, enabling preventive statin therapy and lifestyle modification. Widening use of such tools extends the genomic biomarkers market beyond specialty oncology into primary care and population health. As screening broadens, recurring surveillance tests replace one-off diagnostics, strengthening long-term revenue visibility for service providers.
Breakthroughs in NGS, Multi-Omics and AI Bioinformatics
Sequencing throughput has doubled every 18 months since 2020, and Illumina’s NovaSeq X Plus now delivers 16 Tb per run at sub-USD 200 whole genome cost[2]Illumina Marketing Team, “NovaSeq X Plus Sequencing System,” Illumina, ILLUMINA.COM . Oxford Nanopore adaptive sampling reduces turnaround to under 12 hours in acute settings. Deep learning pipelines trained on diverse cohorts achieve 94% sensitivity and 98% specificity for pathogenic variant calls, 11 percentage points above legacy software. In 2025, the FDA cleared the first multi-omic assay that improved progression-free survival by 23% versus PD-L1 alone, signaling regulatory support for integrative biomarkers. Collectively, these advances compress analysis time, boost accuracy, and unlock clinically actionable signals that expand the genomic biomarkers market.
Mainstreaming of Precision-Medicine Reimbursement Models
CMS removed prior authorization for large comprehensive genomic profiling panels in 2024. Commercial payers such as UnitedHealthcare follow with outcome-based contracts that reimburse liquid biopsy tests only when results alter therapy choices. The UK NHS cut adverse drug reactions by 31% after embedding pharmacogenomic testing for common drugs into routine prescribing. Japan became the first nation to reimburse polygenic risk scores for cardiovascular prevention in asymptomatic adults in 2025. These policies shorten payback periods for laboratories and drive test-ordering behavior in mainstream clinical settings.
National Population Genomic-Screening Programs
The UK Our Future Health study enrolled its two-millionth participant in 2025, creating the world’s largest prospective genomic cohort. The U.S. All of Us program has produced 500,000 whole genomes, 80% from historically underrepresented groups. China’s National Population Health Science Data Center integrated 1.2 million genomes with EHRs, discovering novel biomarkers for hepatocellular and nasopharyngeal cancers. India’s Genome India cataloged 55 million variants, 22% novel, underscoring discovery potential in diverse populations. Large-scale screening expands reference databases, improves algorithm performance in non-European ancestries, and fuels demand for confirmatory clinical testing.
Restraints Impact Analysis
| Restraint | (~) % Impact on CAGR Forecast | Geographic Relevance | Impact Timeline |
|---|---|---|---|
| High test cost & uncertain third-party reimbursement | -1.2% | Global, acute in emerging markets and US self-pay segment | Medium term (2-4 years) |
| Stringent & fragmented regulatory approval pathways | -0.8% | Europe (IVDR), Asia-Pacific (country-specific), Latin America | Long term (≥4 years) |
| Algorithmic bias in polygenic-risk scores for non-European populations | -0.6% | Asia-Pacific, Middle East and Africa, South America, with spillover to diverse US populations | Medium term (2-4 years) |
| Scarcity of validated digital-plus-genomic composite biomarkers | -0.4% | Global, with early impact in North America and Western Europe preventive care programs | Long term (≥4 years) |
| Source: ���ϲ����� | |||
High Test Cost and Uncertain Third-Party Reimbursement
Comprehensive genomic profiling remains priced between USD 3,000 and USD 5,800, limiting access for uninsured patients and for public systems in low- and middle-income countries. Grail’s USD 949 multi-cancer early detection test lacks Medicare coverage, confining sales to executive wellness packages that touch fewer than 2% of eligible U.S. adults. Private insurers deny roughly 18% of prior authorizations for serial liquid biopsy monitoring, pushing patients toward lengthy appeals or out-of-pocket payment. In emerging markets, absent reimbursement narrows adoption to major cancer centers, widening urban–rural inequities. Quarterly minimal residual disease tests can cost more than USD 20,000 over five years, a burden few payers will shoulder.
Stringent and Fragmented Regulatory Approval Pathways
Europe’s IVDR obliges third-party conformity assessments for many lab-developed tests, creating a review backlog exceeding 300 assays and delaying launches by up to three years. The FDA now requests prospective validation for AI tools that learn iteratively, prolonging clearance of adaptive algorithms. Japan requires separate approvals per indication, stretching timelines to twice those in the United States. China added local-population validity studies in 2025, adding USD 2–5 million to development cost. Such divergence raises compliance expense, slows global scale-up, and hinders timely patient access.
Segment Analysis
By Indication: Oncology Strength With Cardiovascular Upswing
Oncology generated 45.55% of 2025 revenue, underpinned by guideline-mandated genomic profiling that links EGFR, KRAS, and HER2 status to targeted therapy selection[3]National Comprehensive Cancer Network, “NCCN Guidelines for Comprehensive Genomic Profiling,” NCCN.ORG. Serial minimal residual disease liquid biopsies extend revenue per oncology patient over post-surgery surveillance windows. Cardiovascular applications, though starting from a smaller base, show the fastest momentum with a 13.85% CAGR as risk scores enter annual wellness visits.
Neurologic, renal, and autoimmune indications add diversification. Pharmacogenomic panels shorten the six-week trial-and-error cycle in depression management, while early genomic identification of polycystic kidney disease triggers ACE inhibitor therapy that delays renal decline. As these use cases mature, the genomic biomarkers market size for non-oncology diseases will outpace historical averages, although oncology should still anchor half of total demand through 2031.


By End User: Laboratory Scale Meets Pharma Acceleration
Diagnostic laboratories held 38.53% of 2025 revenue, leveraging CLIA and CAP credentials and economies of scale that lower per-test costs by 30%. Hospitals, particularly academic centers, run rapid-turnaround assays for acute leukemia, meeting sub-72-hour decision windows.
Pharma and biotech represent the fastest-growing channel at 12.75% CAGR as 68% of 2024 FDA oncology drug approvals required biomarker-stratified enrollment. CROs extend testing to home-based clinical trial models, and community practices integrate result feeds directly into EHRs for real-world evidence capture. These dynamics fortify volume growth across multiple care settings, further broadening the genomic biomarkers market.
By Technology Platform: NGS Dominance, PCR Revival
NGS contributed 62.15% of 2025 revenue, thanks to multiplexed, ultra-sensitive detection and an installed base exceeding 20,000 Illumina sequencers. Long-read platforms from PacBio and Oxford Nanopore add structural variant resolution, edging into clinical workflows.
PCR assays, however, are rebounding with an 11.82% CAGR as point-of-care instruments deliver pharmacogenomic results in under 90 minutes. Digital PCR detects mutant alleles at 0.01% frequency, surpassing NGS sensitivity for minimal residual disease. The genomic biomarkers market share for microarrays remains stable in large-scale genotyping due to sub-USD 30 per-sample pricing. Hybrid workflows that combine NGS discovery with PCR reflex testing are now permitted under 2025 FDA guidance, aligning turnaround time with clinical urgency.
By Biomarker Type: Predictive Leaders, Prognostic Gainers
Predictive biomarkers held 54.52% of 2025 revenue, supported by companion diagnostics that gate reimbursement for targeted therapies. EGFR mutation testing preserves 7.4-month progression-free survival advantage when matched with osimertinib.
Prognostic assays, growing at 11.12% CAGR, guide therapy intensity by quantifying residual disease or recurrence risk. Oncotype DX and MammaPrint together exceed 150,000 annual U.S. tests, now reimbursed by Medicare. Polygenic scores for atrial fibrillation quadruple risk stratification accuracy, guiding primary prevention with anticoagulants. Regulatory draft guidance converges predictive and prognostic definitions into a single “clinical-utility biomarker,” likely streamlining future submissions.
Geography Analysis
North America accounted for 38.55% of 2025 revenue, anchored by more than 3,500 CLIA-certified molecular labs and early consumer normalization of genomic data through the All of Us portal. Public reimbursement for large gene panels and prolific private investment sustain the region’s leadership. Canada’s provincial cancer programs now reimburse comprehensive profiling for most metastatic cases, boosting national volumes.
Europe remains a substantial contributor, with Germany’s EUR 500 million National Genome Strategy earmarking sequencing centers in all federal states. The NHS Genomic Medicine Service completes roughly 100,000 genomes annually, trimming rare-disease diagnostic time to under one year. Despite IVDR-related delays, France, Italy, and Spain continue to expand BRCA and hereditary cancer testing penetration.
Asia-Pacific is projected to post the fastest growth at 11.72% CAGR through 2031 as China’s Precision Medicine Initiative deploys 50 sequencing hubs and integrates pharmacogenomics into the national formulary. India targets 1 million genomes by 2030, while Japan reimburses polygenic scores in annual health checks for 5 million citizens by 2028. Australia and South Korea add further momentum with national genome frameworks and population sequencing initiatives. Emerging programs in the UAE, Saudi Arabia, South Africa, and Brazil grow from a smaller base yet signal widespread global adoption, collectively enlarging genomic biomarkers market size across developing regions.

Competitive Landscape
The top suppliers—Thermo Fisher Scientific, Roche, QIAGEN, and others—collectively accounted for a substantial share of global revenue in 2025 but did not exceed dominant-player thresholds, leaving room for regional labs and specialized liquid biopsy firms. Illumina’s 2024 acquisition of Grail created an end-to-end sequencing-plus-diagnostics platform, while Thermo Fisher introduced the Genexus benchtop system that reduces hands-on time to two hours.
Guardant Health has moved upstream into therapeutic trials, leveraging a databank of 150,000 genomic profiles to guide ctDNA-based treatment intensification. Quest Diagnostics and Labcorp both expanded AI variant-interpretation capabilities through acquisitions, sharpening competitive positioning in clinical interpretation. Element Biosciences, BGI, and Oxford Nanopore compete on reagent pricing and long-read accuracy, creating price discipline across the genomic biomarkers industry.
Regulatory shifts encourage data-rich real-world evidence submissions, lowering barriers for mid-tier innovators. New entrants target pharmacogenomics outside oncology where testing penetration remains under 5%, and regional labs fill mid-priced panel gaps for insured populations in emerging economies. This bifurcated landscape keeps competitive intensity high and margins variable across test categories, reinforcing the need for continuous pipeline refresh and service differentiation.
Genomic Biomarkers Industry Leaders
Thermo Fisher Scientific Inc.
F. Hoffmann-La Roche Ltd
Myriad Genetics Inc
Eurofins Scientific
QIAGEN
- *Disclaimer: Major Players sorted in no particular order

Recent Industry Developments
- May 2025: Illumina won Japanese MHLW clearance for TruSight Oncology Comprehensive, covering more than 500 genes in a single assay.
- February 2025: Guardant Health’s Shield blood test received FDA Breakthrough Device designation for colorectal cancer screening.


Research Methodology Framework and Report Scope
Market Definitions and Key Coverage
Our study defines the genomic biomarkers market as the global revenue generated from DNA- and RNA-based assays, kits, reagents, and software that identify, quantify, or monitor genetic variations used for risk assessment, diagnosis, prognosis, therapy selection, and treatment response tracking across all human diseases.
Scope Exclusion: Tools built solely for proteomic or metabolomic biomarkers, veterinary tests, and pure research sequencing services are excluded.
Segmentation Overview
- By Indication
- Cancer
- Cardiovascular Disorders
- Neurological Disorders
- Renal Disorders
- Auto-Immune & Inflammatory Diseases
- Others
- By End User
- Diagnostic Laboratories
- Hospitals
- Pharmaceutical & Biotechnology Companies
- Others
- By Technology Platform
- Next-Generation Sequencing
- PCR
- Microarray
- Others
- By Biomarker Type
- Predictive Biomarker
- Prognostic Biomarker
- By Geography
- North America
- United States
- Canada
- Mexico
- Europe
- Germany
- United Kingdom
- France
- Italy
- Spain
- Rest of Europe
- Asia-Pacific
- China
- India
- Japan
- Australia
- South Korea
- Rest of Asia-Pacific
- Middle East and Africa
- GCC
- South Africa
- Rest of Middle East and Africa
- South America
- Brazil
- Argentina
- Rest of South America
- North America
Detailed Research Methodology and Data Validation
Primary Research
Mordor analysts interviewed laboratory directors, molecular pathologists, and executives at reagent makers across North America, Europe, and Asia-Pacific. These conversations confirmed average selling prices, emerging clinical-utility evidence, and regional reimbursement thresholds, letting us refine assumptions surfaced during the desk phase.
Desk Research
The team began with open datasets from agencies such as the WHO, OECD health statistics, and the NIH Genetic Testing Registry, which map test volumes and reimbursement codes. Trade associations like the American Clinical Laboratory Association and the European Society of Human Genetics supplied estimates on laboratory adoption rates, while customs shipment data clarified cross-border kit flows. Company filings, investor decks, and peer-reviewed journals on next-generation sequencing cost curves rounded out the secondary base. Paid datasets, including D&B Hoovers for company revenues and Questel for patent counts, helped benchmark supplier footprints. The sources cited here are illustrative; many additional references informed data gathering and validation.
Market-Sizing & Forecasting
A combined top-down, bottom-up model underpins sizing. We first reconstructed the addressable demand pool from national test-procedure claims and sequencing output, then corroborated totals with sampled supplier roll-ups (volume × ASP) to adjust for point-of-care and research spillover. Key variables like annual NGS cost per gigabase, oncology incidence, test-utilization rates, liquid-biopsy penetration, and guideline updates drive our multivariate-regression forecast. Scenario analysis addresses shifts in reimbursement and technology maturation, and data gaps in low-income regions are bridged through regional proxy indicators validated via expert calls.
Data Validation & Update Cycle
Outputs pass variance checks against historical growth bands, patent-filing trends, and quarterly revenue releases. Senior reviewers examine anomalies before sign-off. The model refreshes each year, with interim tweaks when material events, such as major regulatory approvals and step-change pricing, surface, ensuring clients receive the most current view.
Why Our Genomic Biomarkers Baseline Commands Reliability
Published estimates often diverge because firms choose different biomarker scopes, price assumptions, and refresh cadences.
Key gap drivers include whether non-genomic biomarker revenues are blended, the aggressiveness of ASP erosion curves, and how patient-testing volumes are projected in emerging markets. Mordor's disciplined scope and yearly refresh keep our numbers defensible, whereas some publishers rely on one-time surveys or broader biomarker baskets.
Benchmark comparison
| Market Size | Anonymized source | Primary gap driver |
|---|---|---|
| USD 5.68 B (2025) | ���ϲ����� | - |
| USD 5.67 B (2024) | Global Consultancy A | Uses static ASPs and limited primary validation |
| USD 22.63 B (2025) | Regional Consultancy B | Combines proteomic, metabolomic, and genomic segments, inflating totals |
| USD 7.59 B (2022) | Industry Association C | Applies universal CAGR to outdated base year without adjusting for sequencing cost decline |
The comparison shows that, by isolating true genomic revenues, aligning prices with real-world contracts, and updating annually, ���ϲ����� delivers a balanced, transparent baseline that decision-makers can trace back to clear variables and repeatable steps.


Key Questions Answered in the Report
What is the current size of the genomic biomarkers market?
The genomic biomarkers market size stood at USD 5.68 billion in 2025 and is on track to reach USD 6.22 billion in 2026.
How fast is the market expected to grow?
Between 2026 and 2031 the market is forecast to expand at a 9.55% CAGR, lifting value to USD 9.82 billion.
Which application segment is expanding quickest?
Cardiovascular genomic panels are projected to post the highest growth, advancing at a 13.85% CAGR through 2031.
Why is Asia-Pacific considered the fastest-growing region?
Large national genome initiatives in China, India, and Japan, combined with expanding reimbursement, support an 11.72% CAGR to 2031.
What restrains broader adoption of genomic tests?
High test prices and fragmented regulatory pathways slow uptake, especially in markets without universal reimbursement.
Page last updated on:


