Game-Based Learning Market Size and Share
Market Overview
| Study Period | 2020 - 2031 |
|---|---|
| Market Size (2026) | USD 34.90 Billion |
| Market Size (2031) | USD 80.22 Billion |
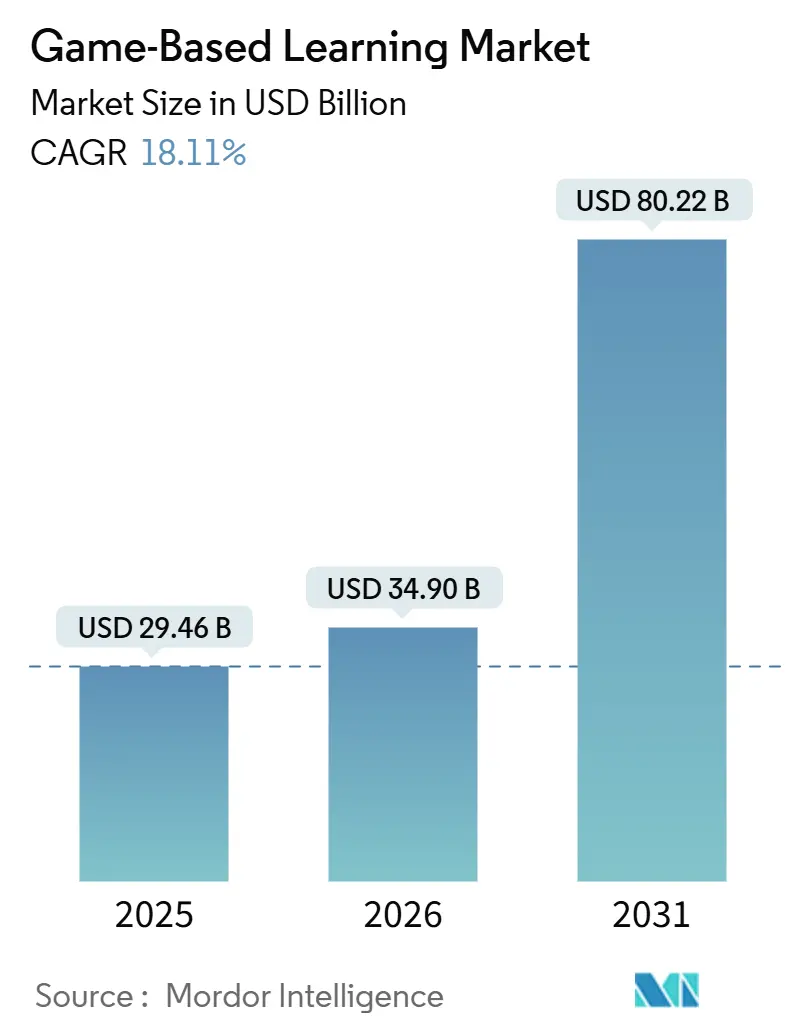
| Growth Rate (2026 - 2031) | 18.11% CAGR |
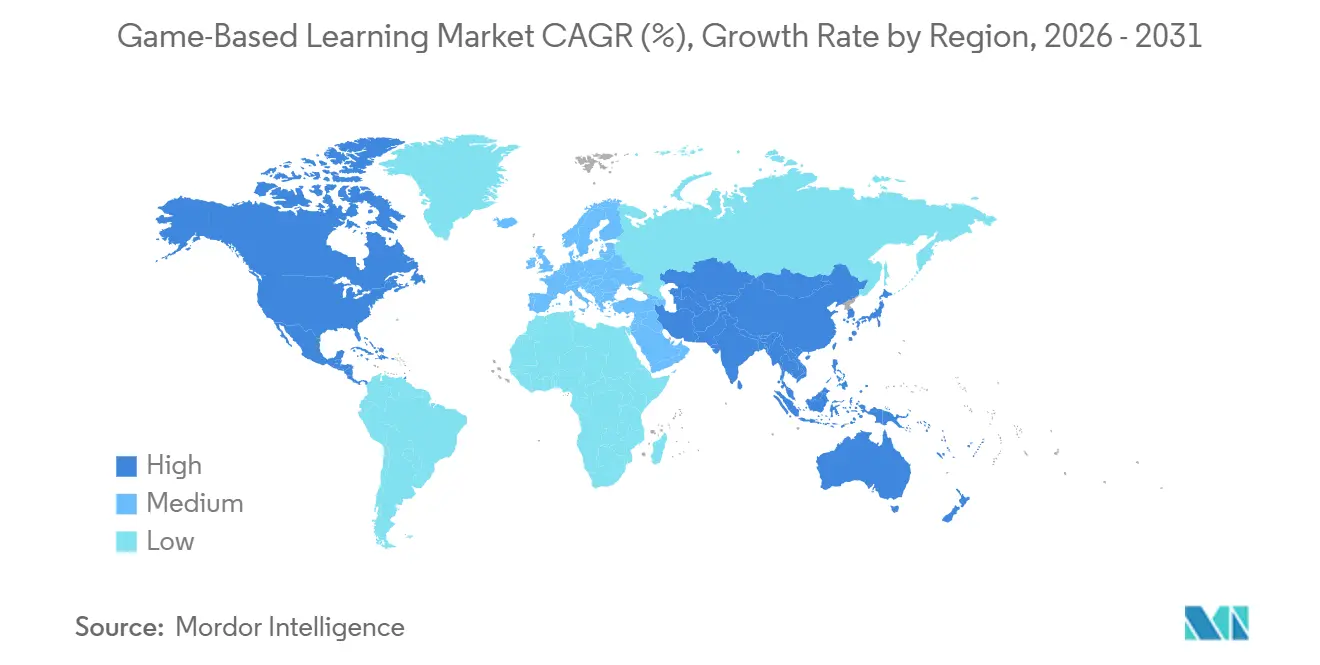
| Fastest Growing Market | Asia Pacific |
| Largest Market | North America |
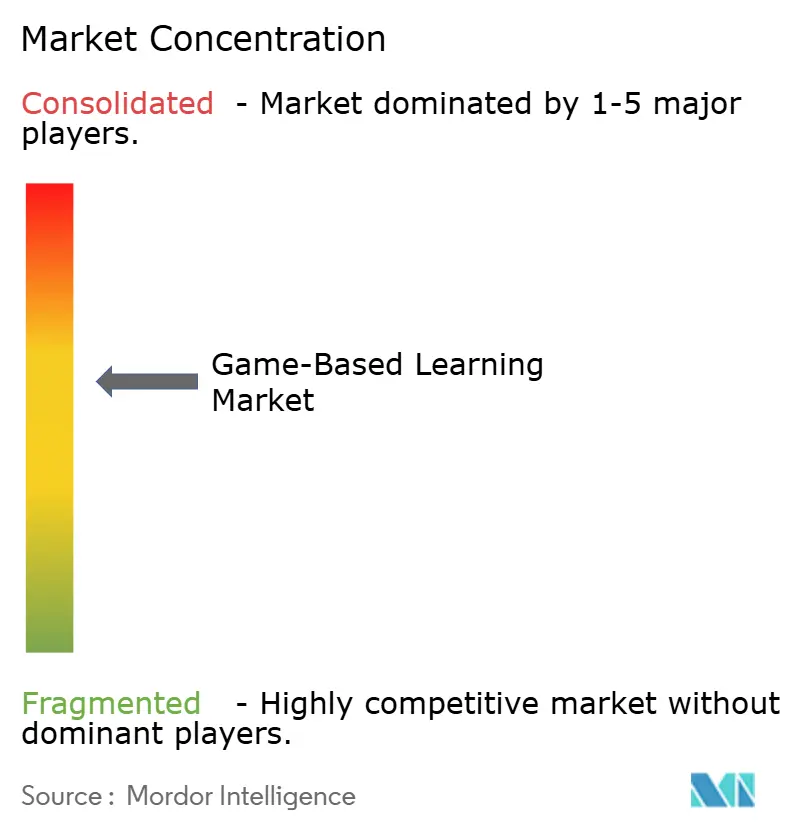
| Market Concentration | Medium |
Major Players *Disclaimer: Major Players sorted in no particular order Image © ���ϲ�����. Reuse requires attribution under CC BY 4.0. | |
Game-Based Learning Market Analysis by ���ϲ�����
The game-based learning market size is expected to increase from USD 29.46 billion in 2025 to USD 34.90 billion in 2026 and reach USD 80.22 billion by 2031, growing at a CAGR of 18.11% over 2026-2031. Rapid adoption of generative-AI authoring tools, 5G-enabled edge streaming, and neuro-adaptive feedback loops has shortened production cycles, allowing vendors to refresh content in days rather than months. Enterprises now treat interactive modules as risk-mitigation assets that lower repeat-violation rates, while schools view them as scalable substitutes for hardware-intensive labs. Pricing of AR and VR headsets below USD 500 is broadening access, and cloud templates from hyperscale providers have removed most infrastructure barriers. Competitive intensity is therefore shifting from content ownership to platform agility, with scale advantages accruing to publishers that automate localization and compliance workflows.
Key Report Takeaways
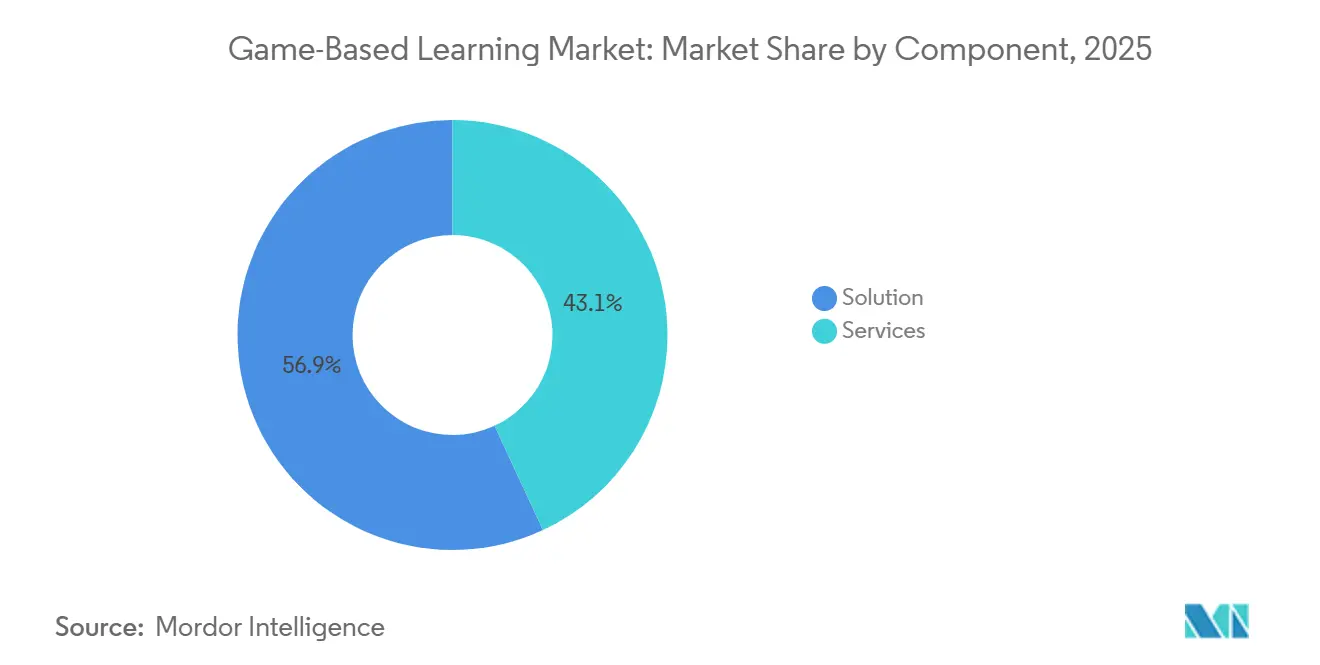
- By component, solutions led with 56.91% revenue share in 2025, whereas services are projected to expand at a 19.40% CAGR through 2031.
- By platform type, online delivery accounted for 64.32% of the game-based learning market share in 2025 and is advancing at an 18.65% CAGR.
- By deployment mode, on-premises installations accounted for 58.37% of the game-based learning market in 2025, while cloud deployments are forecast to grow at 19.99% through 2031.
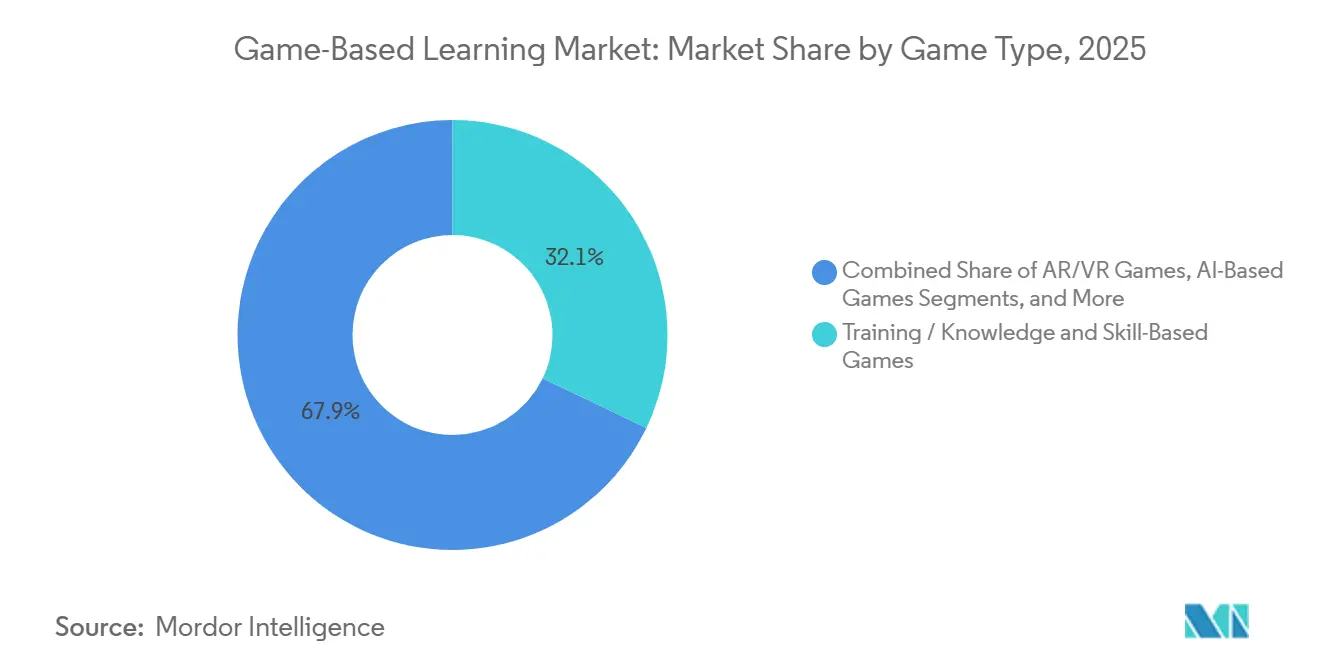
- By game type, knowledge- and skill-based formats held a 32.11% share in 2025; AR and VR titles are the fastest-growing category, with a 21.42% CAGR.
- By end-user industry, education institutions retained a 44.93% share in 2025, but enterprises recorded the highest projected CAGR at 20.32% to 2031.
- By geography, North America commanded 38.27% revenue share in 2025, whereas Asia-Pacific is poised to expand at a 22.86% CAGR through 2031.
Note: Market size and forecast figures in this report are generated using ���ϲ�����’s proprietary estimation framework, updated with the latest available data and insights as of January 2026.
Global Game-Based Learning Market Trends and Insights
Drivers Impact Analysis
| Driver | (~) % Impact on CAGR Forecast | Geographic Relevance | Impact Timeline |
|---|---|---|---|
| AI-Ready Authoring Tools Slash Content-Creation Time | +3.8% | Global, with early adoption in North America and Europe | Short term (≤ 2 years) |
| Smartphone-First Emerging-Market Learners Expand TAM | +4.2% | Asia-Pacific core, spillover to Middle East and Africa | Medium term (2-4 years) |
| Corporate Compliance Mandates Gamified Micro-Training | +3.5% | North America and EU, driven by regulatory frameworks | Medium term (2-4 years) |
| 5G and Edge Streaming Eliminate Device-Spec Limits | +2.9% | Global, accelerated in Asia-Pacific and Middle East | Long term (≥ 4 years) |
| Investments by Big-Tech Education Funds | +2.1% | Global, concentrated in North America and China | Medium term (2-4 years) |
| Neuro-Adaptive Games Boost Measurable Learning ROI | +1.6% | North America and Europe, pilot deployments in APAC | Long term (≥ 4 years) |
| Source: ���ϲ����� | |||
AI-Ready Authoring Tools Slash Content-Creation Time
Generative-AI suites have cut module development windows from 12-16 weeks to under 10 days, enabling publishers to refresh curricula when regulations or skill gaps emerge.[1]Microsoft Corporation, “Microsoft Expands Copilot-Powered Education Tools,” microsoft.com Budget savings of 50-60% are being redeployed into user acquisition and analytics upgrades. Democratized authoring is broadening the vendor base, yet quality-assurance workflows remain underdeveloped, compelling institutions to add manual review layers. Over the next two years, platforms blending large-language-model scripting with human vetting are positioned to win accelerated contracts in healthcare and financial services compliance.
Smartphone-First Emerging-Market Learners Expand TAM
India surpassed 750 million active smartphones in 2025, with data costs below USD 0.10 per gigabyte, creating the world’s largest mobile-native learner cohort. Similar dynamics in Indonesia and Nigeria are steering product design toward thumb-driven interfaces, 3-5-minute game loops, and offline-mode caching. Vendors that optimize for low-bandwidth asset delivery and carrier billing are opening markets that skipped the PC era entirely. This driver is expected to keep the game-based learning market on a steep adoption curve across Asia-Pacific, the Middle East, and Africa through 2029.
Corporate Compliance Mandates Gamified Micro-Training
As data privacy and workplace conduct regulations become increasingly stringent, budget control has shifted from Learning & Development (L&D) units to compliance officers. These officers now prioritize scenario-based training modules that meticulously document decision trees, ensuring comprehensive audit trails.[2]Telecom Regulatory Authority of India, “Indian Telecom Statistics 2025,” trai.gov.in Source: Federal Trade Commission, “Amazon Alexa Privacy Settlement,” ftc.gov Organizations that have adopted this approach early report significant improvements: completion rates increase by 40-50% and assessment scores rise by 30% compared to traditional slide-deck-based training methods. These results strongly validate the return on investment (ROI) claims associated with scenario-based training. Furthermore, vendors offering advanced features, such as real-time dashboards and seamless ERP system integration, are securing multi-year, outcome-based contracts. This growing preference for enterprise-grade solutions is creating higher entry barriers for consumer-grade applications that lack robust enterprise integration capabilities.
5G and Edge Streaming Eliminate Device-Spec Limits
New 5G grids, achieving latency reductions to under 20 milliseconds, enable cloud-rendered AR and VR simulations to stream seamlessly to mid-tier devices, significantly enhancing accessibility and user experience. Medical schools in Saudi Arabia and the UAE have reported a 40-50% reduction in total cost of ownership by substituting traditional on-premise VR labs with pixel-streamed versions, which also offer greater scalability and flexibility. With the densification of network coverage, performance bottlenecks are transitioning from device GPUs to telecom partnerships, prompting content publishers to gravitate towards bundled agreements with carriers to ensure optimized performance and seamless delivery of services.
Restraint Impact Analysis
| Restraint | (~) % Impact on CAGR Forecast | Geographic Relevance | Impact Timeline |
|---|---|---|---|
| Fragmented Pedagogy Standards Hinder Cross-Border Sales | -2.3% | Global, acute in Europe and the Asia-Pacific | Medium term (2-4 years) |
| Parental Data-Privacy Pushback | -1.8% | North America and the EU, emerging in the Asia-Pacific | Short term (≤ 2 years) |
| Shortage of Instructional Game Designers | -1.5% | Global, most severe in North America and Europe | Medium term (2-4 years) |
| Volatile App-Store Policies Cut Discoverability | -1.2% | Global, concentrated impact on mobile-first publishers | Short term (≤ 2 years) |
| Source: ���ϲ����� | |||
Fragmented Pedagogy Standards Hinder Cross-Border Sales
Due to inconsistent adoption of LTI and xAPI, publishers are compelled to uphold distinct content pipelines across North America, Europe, and Asia-Pacific. This fragmentation creates operational inefficiencies, as publishers must allocate additional resources to manage and maintain these separate pipelines. Varied assessment frameworks, such as Common Core, National Curriculum, and CBSE, further complicate the landscape by necessitating tailored item banks. These bespoke requirements significantly inflate localization budgets and delay rollout timelines, making it challenging for publishers to achieve streamlined operations. Often, smaller studios revert to strategies focused on a single region, as they lack the resources to navigate the complexities of compliance across multiple markets. By doing so, they inadvertently surrender market share to multinationals that are better equipped to absorb compliance costs and maintain a competitive edge. Without a consensus among standards bodies on unified schemas, the game-based learning market is likely to grapple with protracted sales cycles and operational inefficiencies beyond its home territories, hindering its overall growth potential.
Parental Data-Privacy Pushback
Due to COPPA and GDPR restrictions on behavioral-telemetry collection, platforms are now forced to weigh the benefits of rich personalization against the need for simplified consent flows. These regulations significantly limit the ability of platforms to collect and utilize user data, which is critical for the functioning of adaptive algorithms. The USD 5.8 million settlement with Discord has further heightened caution among school districts, leading many to blacklist apps that do not incorporate end-to-end encryption. This trend reflects a growing emphasis on data privacy and security within the education sector. While vendors are now crafting architectures with built-in privacy features to address these concerns, the costly and complex process of retrofitting older codebases is causing significant delays in feature releases. Consequently, adoption rates in the K-12 segment are expected to remain muted over the next two years, as stakeholders prioritize compliance and security over rapid technological advancements.
Segment Analysis
By Component: Services Gain as Studios Outsource Design
In 2025, services made up 43.09% of total revenue, and they're on track to grow at a robust 19.40% CAGR as businesses increasingly outsource curriculum mapping and analytics. The market for game-based learning services is expanding significantly. This growth is driven by software commoditization, which is squeezing licensing margins, while a scarcity of skilled designers continues to sustain high service prices. A growing number of Fortune 500 companies are shifting towards outcome-based contracts. This strategic move not only transfers performance risks to vendors but also links payments directly to project completion rates, ensuring accountability and measurable outcomes.
Outsourcing is also playing a critical role in accelerating localization efforts. Specialist studios are highly proficient at translating English modules into 10 languages within just weeks, all while ensuring the content resonates culturally with diverse audiences. These studios go a step further by integrating with LMS APIs to provide real-time dashboards within ERP suites. This engineering capability is a significant challenge for many in-house L&D teams, which often lack the necessary resources and expertise. As a result, the game-based learning market is increasingly favoring hybrid models. In these models, software subscriptions are frequently bundled with service hours, marking a shift away from the traditional stand-alone licenses. This approach not only enhances value for buyers but also aligns with the evolving needs of enterprises seeking comprehensive solutions.
By Platform Type: Online Dominance Reflects Mobile-First Shift
In 2025, online platforms commanded a significant 64.32% market share and are projected to grow at an impressive 18.65% CAGR. This robust growth is largely attributed to the adoption of low-friction browser engines that effectively bypass traditional app stores, enabling seamless user experiences. This trend aligns closely with the smartphone-centric behaviors observed among users in emerging economies, where mobile devices dominate internet usage. While hybrid online-offline models continue to play a vital role in regions with inconsistent 4G coverage, their overall revenue contribution is showing signs of stabilization, indicating a shift in market dynamics.
Offline packages, although still relevant in defense and high-security corporate sectors, face challenges due to their reliance on manual patch distribution, which delays upgrades and reduces operational efficiency. In contrast, online vendors are leveraging advanced technologies such as real-time cloud analytics, automatic version switching, and A/B testing to maintain a competitive edge. These capabilities allow for continuous improvement and adaptability, which are critical in today’s fast-paced market environment. Consequently, the game-based learning market is undergoing a gradual but noticeable transition from traditional boxed licenses to modern, always-updated SaaS dashboards, reflecting the growing preference for flexible and scalable solutions.
By Deployment Mode: Cloud Surges as Schools Shed Infrastructure
In 2025, on-premise architectures held a dominant 58.37% share, largely due to legacy procurement practices and the continued reliance on traditional systems. However, cloud deployments experienced significant growth, capturing a notable 19.99% share, as districts increasingly adopted zero-maintenance scaling to streamline operations and reduce overhead costs. AWS Educate's pre-configured server templates provide a substantial advantage, slashing total ownership costs by up to 40%. This cost efficiency, combined with ease of deployment, makes it an attractive option for mid-sized universities looking to optimize their IT infrastructure.
Global rollouts face considerable challenges due to regional data-sovereignty laws, which require vendors to distribute user data across various regional clusters to ensure compliance. Despite these complications, many buyers find the benefits of automatic patching and elastic compute capabilities to be far more compelling than the difficulties posed by compliance requirements. As subscription renewals approach, a notable shift is observed: many on-premise clients are transitioning to a hybrid cloud model. This approach allows them to safeguard their previous investments while leveraging the scalability and flexibility of cloud solutions. This ongoing migration trend is driving the game-based learning market firmly onto a cloud-first innovation trajectory, ensuring sustained growth and technological advancements in the forecast period.
By Game Type: AR and VR Surge as Hardware Costs Plummet
In 2025, knowledge and skill-based titles held a 32.11% market share, reflecting their strong presence in the market. Meanwhile, AR and VR experiences surged, boasting a 21.42% CAGR, largely fueled by the increasing availability of sub-USD 500 headsets. These affordable devices have made immersive technologies more accessible to a broader audience, driving adoption across various sectors. Medical schools piloting these technologies report a notable 25% uptick in spatial-reasoning scores, further strengthening budget justifications and showcasing the potential of AR and VR in educational applications.
Though motion-sickness concerns limit session durations, a modular content design approach helps alleviate user fatigue by breaking down learning into manageable segments. Furthermore, AI-driven adaptivity is set to enhance these immersive experiences by customizing the pace of learning and offering scaffolded hints tailored to individual users. With telecom operators subsidizing headsets to promote 5G usage, the game-based learning market, closely linked to AR and VR, is poised for significant growth. This synergy between advanced technologies and market strategies is expected to drive innovation and expand the adoption of AR and VR in the coming years.
Note: Segment shares of all individual segments available upon report purchase
By End-User Industry: Enterprises Accelerate as Onboarding Costs Spike
In 2025, education commanded a significant 44.93% share of the revenue, highlighting its dominant position in the market. However, enterprise adoption is experiencing rapid growth, with a compound annual growth rate (CAGR) of 20.32%. Companies are increasingly linking gamified onboarding processes to reduced attrition rates, showcasing the effectiveness of game-based learning in improving employee retention. Meanwhile, both the retail and logistics sectors are achieving a time-to-productivity that is up to 30% faster, making the return on investment (ROI) highly transparent and measurable for CFOs, thereby driving further adoption in these industries.
Government agencies are leveraging simulation drills to prepare for public health emergencies, demonstrating the versatility of game-based learning applications beyond traditional education and corporate environments. On the consumer side, purchases remain predominantly price-sensitive and are largely concentrated in North America and Europe, reflecting regional preferences and economic factors. Additionally, integration with HR suites, particularly with platforms like Workday and SAP SuccessFactors, has become a standard feature requirement for enterprise users. This growing demand for seamless integration is steering the game-based learning market toward adopting enterprise-grade security measures and robust data governance standards. These standards, which were previously uncommon in educational software, are now becoming essential to meet the evolving needs of enterprise clients.
Geography Analysis
North America controlled 38.27% revenue in 2025, buoyed by USD 1.7 billion in Title IV technology streams and dense EdTech ecosystems. Corporate upskilling budgets now outpace K-12 spends, shifting vendor focus toward compliance and leadership modules. Buyers insist on LTI integration with Canvas and Blackboard, a hurdle for smaller studios, propelling consolidation toward platforms capable of single sign-on security.
Asia-Pacific is forecast to expand at a 22.86% CAGR through 2031, powered by India’s USD 1.2 billion digital-pedagogy mandate and China’s pivot from tutoring centers to self-paced apps. Carrier billing and low-bandwidth optimization are decisive success factors, with telcos bundling learning subscriptions into data plans. Linguistic diversity splinters content libraries, favoring studios that automate localization with AI-generated voice-over and on-screen text.
Europe holds just under one-fifth of 2025 revenue. GDPR compliance, 12-18-month procurement cycles, and sovereign-cloud requirements for slow adoption. However, the Digital Education Action Plan is unlocking EUR 200 million (USD 214 million) for pilots, nudging ministries toward cloud-native solutions. Middle East programs under Saudi Vision 2030 pour funds into immersive labs, yet teacher-enablement lags equipment rollout. South America and Africa remain primarily consumer-driven, dependent on NGO sponsorships and freemium pricing. Overall, regional divergence keeps the game-based learning market fragmented, demanding localized go-to-market playbooks.
Competitive Landscape
The top 10 vendors claimed roughly 40-45% combined share in 2025, putting the market in a moderate-concentration bracket. Consumer segments exhibit winner-take-most dynamics, illustrated by Duolingo’s 113.1 million monthly users and Kahoot’s 520 million cumulative participants. Nevertheless, enterprise buyers emphasize interoperability over brand, letting niche studios secure sizeable contracts by embedding game mechanics inside existing LMS dashboards.
Three business models dominate: horizontal engines such as Roblox and Unity sell authoring and distribution toolkits, vertical specialists like Age of Learning own age-specific content, and cloud providers such as AWS monetize usage-based analytics.[3]AWS, “AWS Educate Game-Server Templates,” aws.amazon.com Patent filings reveal an arms race in neuro-adaptive loops that rely on biometric inputs, but privacy regulations could blunt data advantages, redirecting R&D toward on-device inference.
White-space opportunities persist in refugee language training, gig-economy upskilling, and highly regulated sectors. Studios capable of automating cross-border localization and compliance are poised to outpace rivals dependent on creative talent pipelines alone. As acquisition costs rise inside app stores, platforms with built-in social networks and proprietary storefronts gain defensible distribution, reinforcing the network effects underpinning the game-based learning market.
Game-Based Learning Industry Leaders
Kahoot
Duolingo
Cisco Systems
Microsoft Corporation
Google Inc.
- *Disclaimer: Major Players sorted in no particular order
Recent Industry Developments
- December 2025: Epic Games released Unreal Engine 5.4 featuring pixel-streaming for mid-tier smartphones, targeting medical and aviation simulations.
- October 2025: Roblox expanded corporate education partners to Walmart and Chipotle, lifting enterprise bookings 45% year-over-year.
- August 2025: Meta cut Quest 3 pricing to USD 499 and partnered with 200 universities on VR anatomy labs.
- June 2025: Microsoft pledged USD 4 billion to widen Elevate K-12, adding Copilot-powered lesson builders in Teams.
Research Methodology Framework and Report Scope
Market Definitions and Key Coverage
Our study views the global game-based learning market as all revenue generated by digital games and interactive simulations whose primary aim is measurable knowledge transfer or skill building across academic, corporate, and public-sector settings. Experiences must embed learning objectives, feedback loops, and assessment mechanics to be counted.
We purposely exclude casual entertainment titles, promotional gamification layers with no instructional content, and console games that lack formal learning outcomes.
Segmentation Overview
- By Component
- Solutions
- Services
- By Platform Type
- Online
- Offline
- By Deployment Mode
- Cloud
- On-Premise
- By Game Type
- AR / VR Games
- AI-Based Games
- Location-Based Games
- Knowledge and Skill-Based Games
- Language-Learning Games
- Rest of Game Types
- By End-User Industry
- Education
- Enterprises
- Government
- Consumer
- Other End-User Industries
- By Geography
- North America
- United States
- Canada
- Mexico
- South America
- Brazil
- Argentina
- Rest of South America
- Europe
- Germany
- United Kingdom
- France
- Italy
- Spain
- Rest of Europe
- Asia Pacific
- China
- Japan
- South Korea
- India
- Australia
- New Zealand
- Rest of Asia-Pacific
- Middle East and Africa
- Middle East
- United Arab Emirates
- Saudi Arabia
- Turkey
- Rest of Middle East
- Africa
- South Africa
- Nigeria
- Kenya
- Rest of Africa
- Middle East
- North America
Detailed Research Methodology and Data Validation
Primary Research
Our team interviewed curriculum directors, corporate learning managers, and independent instructional designers in North America, Europe, and Asia Pacific. These conversations revealed average annual spend per learner, emerging AR/VR pricing models, and realistic rollout timelines, letting us close gaps spotted during desk work and align assumptions with practitioner reality.
Desk Research
Mordor analysts first gathered baseline figures from open datasets such as UNESCO Institute for Statistics, World Bank EdStats, and the International Telecommunication Union. They then layered insights from trade bodies like EDUCAUSE, IMS Global, and regional EdTech associations. Company filings mapped in D&B Hoovers, peer-reviewed papers via Google Scholar, and patent trends accessed through Questel clarified competitive intensity and product pipelines. Additional context came from parliamentary budget papers and respected technology press. The sources named are illustrative; many others informed data collection, validation, and clarification.
Market-Sizing & Forecasting
The model starts with a top-down construct that reconciles global K-12 enrollments, tertiary student counts, and enterprise L&D budgets with observed penetration rates for paid learning games. Supplier roll-ups and sampled average-selling-price × volume checks provide a bottom-up reasonableness test. Key variables include smartphone penetration, cloud-gaming latency benchmarks, headset shipment growth, national digital-education outlays, and renewal rates for compliance modules. Multivariate regression, stress-tested through expert consensus, extends each driver to 2030, while scenario analysis handles policy shocks and currency swings.
Data Validation & Update Cycle
Outputs face variance checks against historical spend, peer ratios, and macro indicators before a senior reviewer signs off. Reports refresh every twelve months, with interim revisions when funding policies, major mergers, or technology price shifts materially alter base assumptions.
Why Mordor's Game-Based Learning Baseline Stands Reliable
Published estimates differ because firms select varying scopes, variables, and refresh cadences.
By excluding non-instructional games, validating inputs two ways, and revisiting the model yearly, ���ϲ����� anchors a dependable midpoint that decision-makers can trust.
Benchmark comparison
| Market Size | Anonymized source | Primary gap driver |
|---|---|---|
| USD 29.46 B (2025) | ���ϲ����� | - |
| USD 6.23 B (2025) | Global Consultancy A | Counts only software licenses, omits services revenue and Asia Pacific spending |
| USD 19.55 B (2024) | Industry Journal B | Relies on historical trend extrapolation without primary validation and applies outdated currency rates |
These contrasts show that Mordor's disciplined variable selection and dual validation loops deliver a balanced, transparent baseline that stands up under scrutiny.
Key Questions Answered in the Report
How fast is global revenue expected to grow between 2026 and 2031?
The game-based learning market is projected to grow at an 18.11% CAGR, lifting value from USD 34.90 billion in 2026 to USD 80.22 billion by 2031.
Which segment is expanding quickest by component?
Services are forecast to grow at 19.40% annually as enterprises outsource instructional-design and analytics expertise.
Why are AR and VR formats attracting fresh investment?
Headset pricing below USD 500 and 5G pixel-streaming have made immersive simulations affordable, driving a 21.42% CAGR for AR and VR titles.
What makes Asia-Pacific the most attractive regional opportunity?
Smartphone penetration above 750 million users and government funding mandates for digital pedagogy give Asia-Pacific a projected 22.86% CAGR to 2031.


