Europe Waste Management Market Size and Share
Market Overview
| Study Period | 2020 - 2031 |
|---|---|
| Forecast Data Period | 2026 - 2031 |
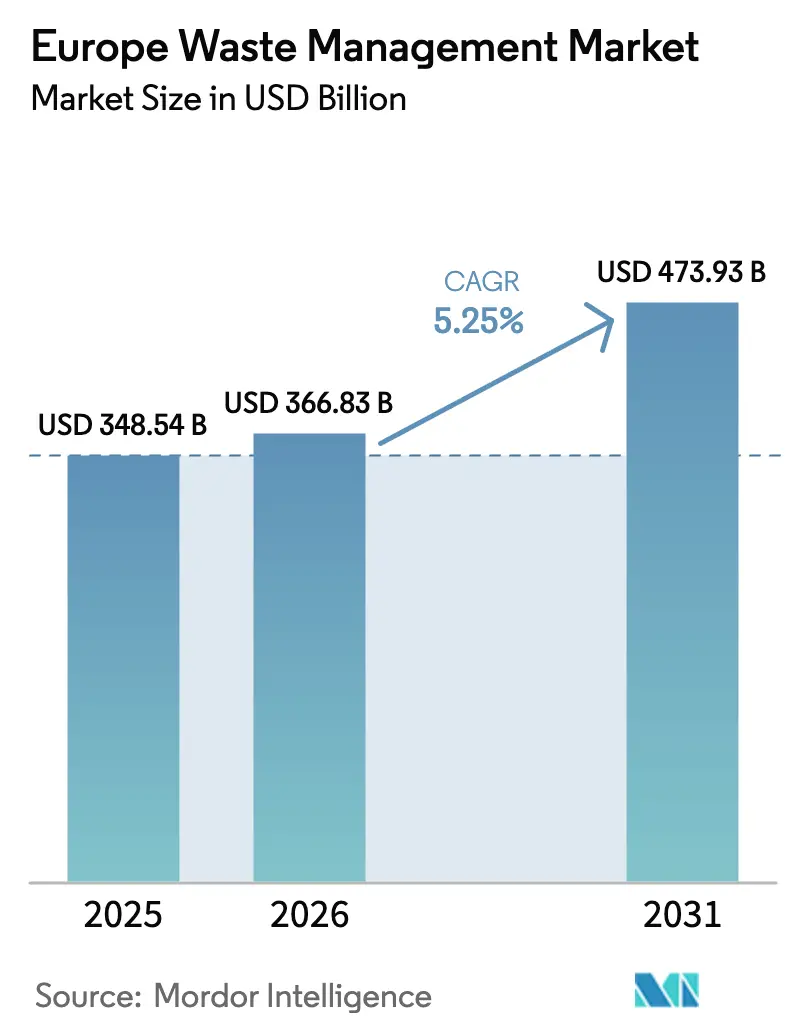
| Base Year Market Size (2025) | USD 348.54 Billion |
| Market Size (2026) | USD 366.83 Billion |
| Market Size (2031) | USD 473.93 Billion |
| Growth Rate (2026 - 2031) | 5.25% CAGR |
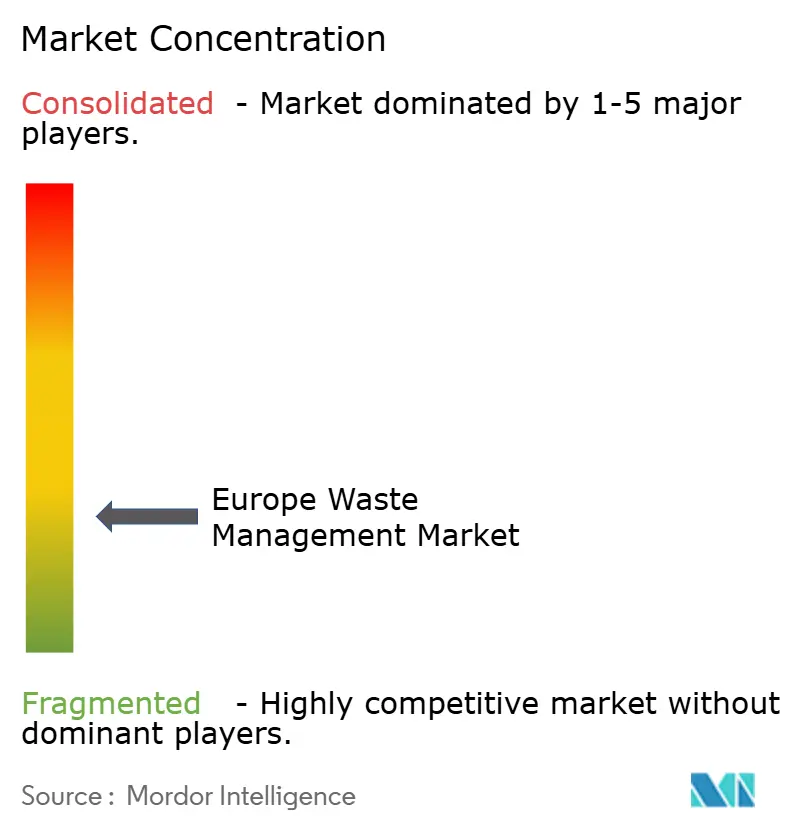
| Market Concentration | Low |
Major Players *Disclaimer: Major Players sorted in no particular order Image © ���ϲ�����. Reuse requires attribution under CC BY 4.0. | |
Europe Waste Management Market Analysis by ���ϲ�����
The Europe waste management market size was valued at USD 348.54 billion in 2025 and is estimated to grow from USD 366.83 billion in 2026 to reach USD 473.93 billion by 2031, at a CAGR of 5.25% during the forecast period (2026-2031). Urbanization, mandatory EU diversion targets, and higher Extended Producer Responsibility (EPR) fees are steering volumes away from landfills and into advanced recycling and energy-recovery channels. Municipalities are rewriting service contracts to prioritize diversion metrics, while private operators deploy AI-enabled sorters and battery-ready collection routes to capture premium margins. Energy price swings and a slump in recycled-polymer pricing compressed margins in 2024-2025, yet rising Scope 3 reporting obligations keep demand for traceable, closed-loop solutions buoyant. Large cross-border players have responded by consolidating contracts, divesting low-margin assets, and investing in specialty recycling, setting the stage for a structurally higher profit pool as circular-economy mandates tighten.
Key Report Takeaways
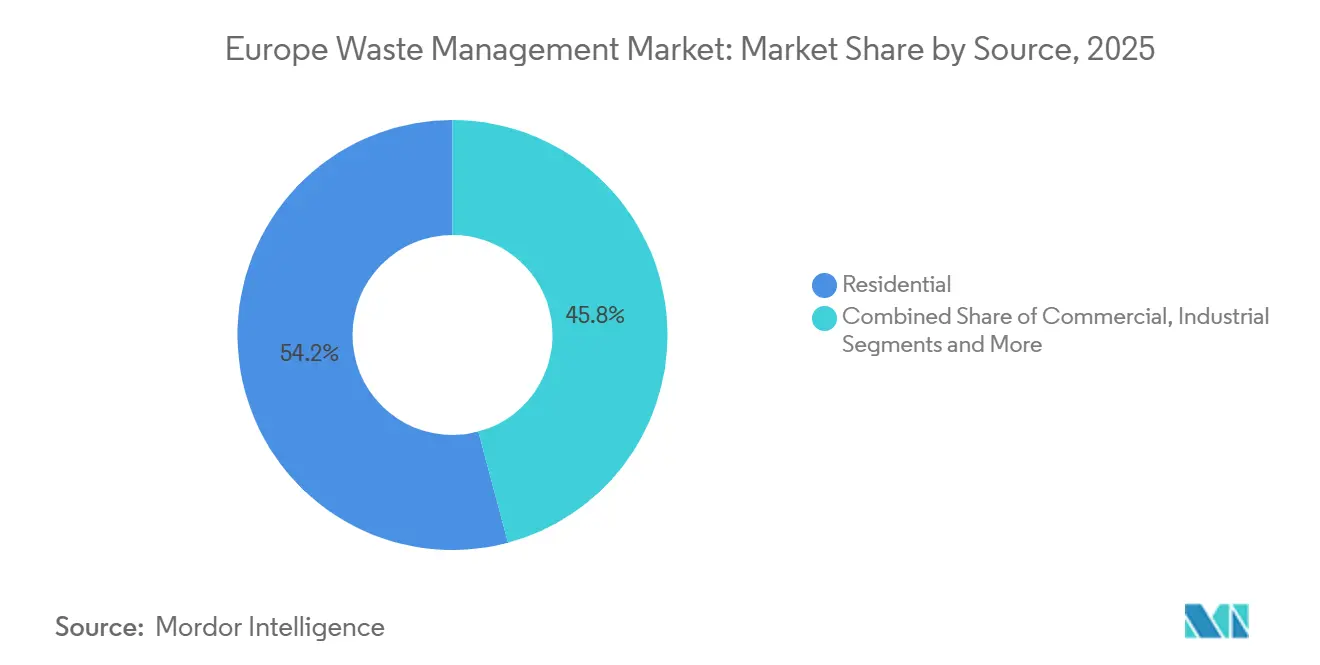
- By source, residential streams held 54.15% of the Europe waste management market share in 2025. Commercial streams are projected to post the fastest 6.81% CAGR through 2031.
- By service, disposal and treatment captured 45.8% of the Europe waste management market size in 2025, while recycling and resource recovery represent the fastest-growing service at 6.91% CAGR.
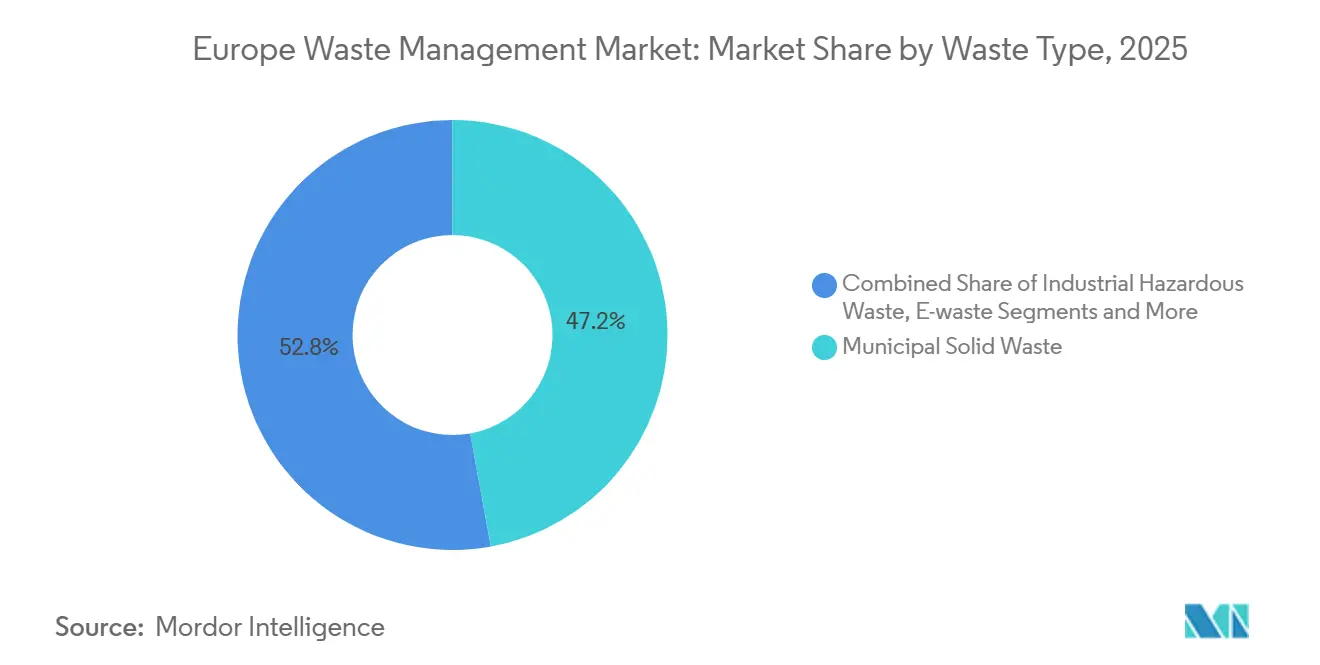
- By waste type, municipal solid waste led with 47.15% of the European waste management market share in 2025. e-waste is forecast to expand at a 5.98% CAGR to 2031.
- By Geography, Germany accounted for 23.5% of regional revenues of the Europe waste management market size in 2025, whereas Spain is the fastest-growing geography at 5.99% CAGR.
Note: Market size and forecast figures in this report are generated using ���ϲ�����’s proprietary estimation framework, updated with the latest available data and insights as of 2026.
Europe Waste Management Market Trends and Insights
Drivers Impact Analysis*
| Drivers | (~) % Impact on CAGR Forecast | Geographic Relevance | Impact Timeline |
|---|---|---|---|
| EU 65% recycling & less than 10% landfill mandate (CEAP 2.0) | +1.2% | Pan-European, with enforcement variability in Southern and Eastern member states | Medium term (2-4 years) |
| Escalating EPR fees for single-use plastics | +0.9% | Belgium, Netherlands, France, Germany (highest fee structures) | Short term (≤2 years) |
| Mandatory separate biowaste collection by 2026 | +0.8% | All EU27, with infrastructure gaps in Romania, Bulgaria, Greece | Short term (≤2 years) |
| CSRD Scope-3 reporting fueling closed-loop contracts | +0.7% | Germany, France, Netherlands, United Kingdom (large corporate concentrations) | Medium term (2-4 years) |
| EV battery end-of-life surge spurring recycling hubs | +0.5% | Germany, Belgium, Norway, France (automotive manufacturing clusters) | Long term (≥4 years) |
| CCUS retrofits on WtE enabling negative-emission credits | +0.3% | Netherlands, United Kingdom, Sweden (advanced WtE infrastructure) | Long term (≥4 years) |
| Source: ���ϲ����� | |||
EU 65% Recycling & Less Than 10% Landfill Mandate (CEAP 2.0)
The revised Waste Framework Directive lifts municipal-solid-waste recycling to 65% by 2030 and caps landfilling below 10%, yet Europe’s 2022 average sat at only 44%.[1]Eurostat, “Municipal Waste Statistics 2025,” ec.europa.euCompliance gaps funnel capital toward optical sorters, deposit-return machines, and reverse-logistics centers in lagging regions. Packaging-specific targets under the Packaging and Packaging Waste Regulation tighten pressure on plastics and metals, forcing contract renegotiations that reward diversion over tonnage. Incentive alignment is accelerating private-sector investment, adding a measurable lift to forecast CAGR. The mandate effectively redraws revenue pools toward higher-margin recycling while shrinking landfill gate-fee income.
Escalating EPR Fees for Single-Use Plastics
Producer fees swing from USD 225.5 ton in Malta to USD 1,441 ton in Belgium, a spread that pushes packaging designers toward one-format Europe-wide solutions. Germany, France, and the Netherlands sit near USD 648-982 t; combined with the United Kingdom’s USD 254 t plastics tax, these levies raise demand for post-consumer resin. Only a handful of states offer eco-design bonuses, so most brands design for the toughest fee regime to avoid penalties. Higher costs squeeze margins but simultaneously grow recycled-content demand, lifting the CAGR. Fee hikes also finance MRF upgrades, closing the loop on funding.
Mandatory Separate Biowaste Collection by 2026
Despite the January 2026 mandate requiring separate food and garden waste collection, many Eastern and Southern regions still lack adequate digestion and composting capacity. Early adopters in Germany and the Netherlands already monetize biogas and fertilizer-grade digestate, proving the business case. Lower biowaste gate fees pressure margins, so operators pair the service with power-sale agreements that hedge energy swings. Farm-to-Fork strategy goals to cut retail food waste by 10% intensify feedstock flows, while a 2026 PFAS ban in food packaging improves compost quality. The regulation fills processing lines quickly, driving a measurable increase in near-term growth.
CSRD Scope-3 Reporting Fueling Closed-Loop Contracts
Roughly 50,000 companies now disclose waste-linked Scope 3 emissions under the Corporate Sustainability Reporting Directive. Multinationals lock in multi-year offtake deals that guarantee traceable recycled content, and Veolia, as well as Suez, charge premiums for blockchain-verified “closed-loop” bundles. CFOs view documented diversion as a hedge against future landfill taxes, so budgets migrate from standard disposal toward certified recovery. Smaller collectors lacking digital audit trails lose share, while AI-enabled tracking becomes table stakes in tenders. The transparency shift injects an additional tailwind into industry growth.
Restraints Impact Analysis*
| Restraints | (~) % Impact on CAGR Forecast | Geographic Relevance | Impact Timeline |
|---|---|---|---|
| Recycled polymer price slump harming collection economics | -0.7% | Pan-European, acute in Belgium, Netherlands, United Kingdom | Short term (≤2 years) |
| Energy price volatility compressing MRF & WtE margins | -0.6% | United Kingdom, Germany, Netherlands (high energy-intensity operations) | Short term (≤2 years) |
| Protracted permitting for chemical-recycling plants | -0.4% | Germany, France, Italy (stringent environmental impact assessments) | Medium term (2-4 years) |
| Rare-earth catalyst shortages limiting pyrolysis scale-up | -0.2% | Germany, France (advanced recycling clusters) | Long term (≥4 years) |
| Source: ���ϲ����� | |||
Recycled-Polymer Price Slump Harming Collection Economics
The price of sorted PET flakes fell significantly, driving a revenue drop for plastics recyclers. Around 300 kilotons per year capacity shut down, and municipal collectors now face budget gaps when bale proceeds cannot offset service costs. Packaging and Packaging Waste Regulation (PPWR) recycled-content mandates move to 2030, leaving demand soft. The slump erodes short-term market growth until pricing rebounds.
Energy Price Volatility Compressing MRF and WtE Margins
Material-recovery facilities and waste-to-energy units consume large volumes of electricity and gas. Wholesale energy prices doubled in 2022 and then retreated in 2025, squeezing operators that hedge poorly. Twence in the Netherlands drew 60% of its USD 160.16 million 2024 revenue from power and heat sales, so profitability swings with each price shift. Germany added a CO₂ levy on incineration in January 2024, and the United Kingdom will follow with an emissions-trading extension in 2026, further raising costs. Many operators intend to lift gate fees over 2026-2027, yet price-sensitive municipalities may divert residual streams back to landfill when fees spike.
*Our updated forecasts treat driver/restraint impacts as directional, not additive. The revised impact forecasts reflect baseline growth, mix effects, and variable interactions.
Segment Analysis
By Source: Residential Streams Dominate While Commercial Waste Scales Quickly
Residential collections commanded 54.15% of the waste management market share in 2025, sustained by universal curbside programs and pay-as-you-throw rollouts in most EU cities. The commercial stream covering retail, hospitality, and offices is the fastest-growing slice of the waste management market, advancing at a 6.81% CAGR through 2031 as companies reopen workplaces and wrap closed-loop services into lease agreements.
Separate organic bins, reverse-vending machines in grocery chains, and parcel-ready cardboard lines have raised diversion rates in dense urban cores, but service gaps remain in rural municipalities where collection costs per tonne stay elevated. Retailers now embed real-time fill-level sensors that let operators dispatch vehicles only when containers reach 80% capacity, trimming fuel costs and shrinking Scope 3 footprints. Facilities managers at large business parks increasingly bundle recycling, food-waste pickups, and e-waste take-back under a single invoice, deepening wallet share for integrated providers such as Veolia and Suez. Between 2026 and 2031, the waste management market size attributable to commercial sources is set to climb steadily as brand owners chase verified recycling credits for CSRD compliance.


By Service Type: Recycling Surges Ahead of Traditional Disposal
Disposal and treatment activities, such as landfill, incineration, and chemical stabilization, held a 45.8% slice of the waste management market share in 2025. Recycling and resource-recovery services, however, are outpacing the segment with a 6.91% CAGR, signaling a structural pivot in the waste management market toward high-value secondary materials.
Landfill taxes now average USD 160.21 per tonne in the United Kingdom, while Germany’s January 2024 incineration levy further erodes WtE margins. These rising costs move volumes toward material recovery facilities retrofitted with near-infrared optics and AI arms that push purity above 98%. Operators such as Renewi and Biffa have begun selling “design-for-recycling” audits that lock clients into long-term bale-offtake contracts, stabilizing revenues when commodity prices slide. At the same time, anaerobic digestion plants processing newly segregated organics monetize both gate fees and renewable-gas certificates, adding an incremental revenue stream to the waste management industry.
By Waste Type: Municipal Solid Waste Leads, E-Waste Accelerates
Municipal solid waste (MSW) accounted for 47.15% of total volumes in 2025, giving it the largest contribution to the waste management market size. E-waste ranks as the fastest-growing category with a 5.98% CAGR through 2031, propelled by the EU’s 65% collection target under the WEEE Directive and rising demand for critical metals such as cobalt and palladium.[2]European Commission, “Waste Electrical and Electronic Equipment (WEEE),” europa.eu
Umicore’s Hoboken plant already processes batteries and circuit boards, delivering premium black-mass output that feeds new cathode lines, while Hydrovolt’s Norwegian hub supports Northern European OEMs. Informal dismantling hubs and export leakage into non-OECD markets still siphon away potential feedstock, prompting Brussels to tighten the Waste Shipment Regulation from 2026. MSW streams continue to shrink as packaging-light product designs and deposit-return schemes gain ground, yet the segment remains the bedrock of municipal service contracts, underpinning the core revenue pool for the waste management market.
Geography Analysis
Germany anchored 23.5% of the regional waste management market share in 2025, underpinned by its dual-system sorting model, a nationwide bottle-deposit regime, and more than 16,000 civic recycling centers. Its 69% recycling rate already beats the 2030 EU target, and steady upgrades to optical sorters keep contamination below 5%.[3]Eurostat, “Waste Database 2025,” ec.europa.eu Spain, by contrast, is projected to post the fastest 5.99% CAGR to 2031 as autonomous communities retrofit material-recovery facilities and roll out door-to-door biowaste bins ahead of the 2026 deadline. Regional pay-as-you-throw pilots in Catalonia trimmed residual volumes by up to 30%, unlocking capacity for higher-margin speciality recycling.
The United Kingdom, operating outside the EU but mirroring many directives, extended its Emissions Trading Scheme to energy-from-waste sites from 2026, adding roughly USD 60.96 per tonne in carbon costs from 2028.[4]Suez UK, “ETS Extension Briefing 2025,” suez.co.uk This move is expected to divert marginal loads toward mechanical-biological treatment and glass cullet plants, cushioning landfill usage. France maintains a robust but costly bonus-malus EPR framework that nudges converters toward mono-material packs; however, partial recovery of local collection expenses has slowed MRF upgrades in smaller départements.
Italy’s North-South divide remains visible, with Lombardy touching 70% recycling while Calabria drifts below 40%. Cohesion-fund money now favors Southern and Eastern Europe, where Romania’s 14% recycling baseline presents the biggest upside. Meanwhile, the BENELUX bloc punches above its weight on chemical-recycling pilots, though USD 1,441-per-tonne EPR fees in Belgium strain brand-owner budgets. Although Nordic countries generate a high volume of waste per capita, they lead the market in district-heating integration by exporting residual calorific waste to plants across the border.
Competitive Landscape
Competition inside the European waste management market is fragmented. Veolia’s 2022 takeover of selected Suez assets triggered EU antitrust divestitures but still allowed the group to knit a pan-regional platform that wins multi-city concessions and long tenors. These giants now install AI vision systems that push bale purity from 92% to 98%, meeting strict PPWR thresholds and enabling premium offtake contracts.
Mid-tier players are reshaping portfolios to chase higher EBITDA margins. Renewi exited France for USD 104.5 million in July 2025 and reinvested the proceeds into Benelux plastics sorting, while Biffa signed a USD 152.4 million London commercial-waste contract that mandates a full electric-truck rollout. PreZero’s USD 88 million Polish acquisition adds 200,000 t of sorting headroom in Central Europe, positioning the firm ahead of PPWR milestones. Vertical integration accelerates, with Remondis co-funding a BASF pyrolysis venture to lock in downstream polymer margins.
Digital challengers such as Circularity-as-a-Service platforms aggregate SME waste streams and use spot pricing to lure customers away from legacy brokers. Incumbents respond with IoT-fitted bins that log fullness data and emission factors, satisfying CSRD auditors and fending off disintermediation. Permitting bottlenecks for chemical recycling and scarce rare-earth catalysts, however, curb first-mover advantages, making balance-sheet depth a key differentiator in the waste management industry over the next decade.
Europe Waste Management Industry Leaders
Veolia
Suez
Remondis
FCC Environment
PreZero
- *Disclaimer: Major Players sorted in no particular order

Recent Industry Developments
- February 2026: Veolia announced a USD 165 million investment to build a hazardous-waste incinerator in North Rhine-Westphalia with 50,000 t annual capacity, targeting industrial clients facing stricter landfill rules.
- January 2026: Biffa secured a 10-year USD 152.4 million contract with the Greater London Authority covering commercial-waste pickups across 12 boroughs, deploying electric refuse trucks and AI route software.
- December 2025: PreZero acquired a 60% stake in a Polish MRF operator for USD 88 million, adding 200,000 t of sorting headroom ahead of PPWR deadlines.
- November 2025: Remondis partnered with BASF to pilot a 15,000 tons per year chemical-recycling line in Ludwigshafen, Germany, with commissioning slated for Q3 2026.


Europe Waste Management Market Report Scope
| Residential |
| Commercial (retail, office, etc.) |
| Industrial |
| Medical (Health and Pharmaceutical) |
| Construction & Demolition |
| Others (institutional, agricultural, etc) |
| Collection, Transportation, Sorting & Segregation | |
| Disposal / Treatment | Landfill |
| Recycling & Resource Recovery | |
| Incineration & Waste-to-Energy | |
| Others (Chemical Treatment, Composting, etc.) | |
| Others (Consulting, Audit & Training, etc.) |
| Municipal Solid Waste |
| Industrial Hazardous Waste |
| E-waste |
| Plastic Waste |
| Biomedical Waste |
| Construction & Demolition Waste |
| Agricultural Waste |
| Other Specialized Waste (radio active, etc) |
| United Kingdom |
| Germany |
| France |
| Italy |
| Spain |
| BENELUX (Belgium, Netherlands, and Luxembourg) |
| NORDICS (Denmark, Finland, Iceland, Norway, and Sweden) |
| Rest of Europe |
| By Source | Residential | |
| Commercial (retail, office, etc.) | ||
| Industrial | ||
| Medical (Health and Pharmaceutical) | ||
| Construction & Demolition | ||
| Others (institutional, agricultural, etc) | ||
| By Service Type | Collection, Transportation, Sorting & Segregation | |
| Disposal / Treatment | Landfill | |
| Recycling & Resource Recovery | ||
| Incineration & Waste-to-Energy | ||
| Others (Chemical Treatment, Composting, etc.) | ||
| Others (Consulting, Audit & Training, etc.) | ||
| By Waste Type | Municipal Solid Waste | |
| Industrial Hazardous Waste | ||
| E-waste | ||
| Plastic Waste | ||
| Biomedical Waste | ||
| Construction & Demolition Waste | ||
| Agricultural Waste | ||
| Other Specialized Waste (radio active, etc) | ||
| By Geography | United Kingdom | |
| Germany | ||
| France | ||
| Italy | ||
| Spain | ||
| BENELUX (Belgium, Netherlands, and Luxembourg) | ||
| NORDICS (Denmark, Finland, Iceland, Norway, and Sweden) | ||
| Rest of Europe | ||


Key Questions Answered in the Report
How large is the European waste management market in 2026?
The sector stands at USD 366.83 billion in 2026 and is tracking toward USD 473.93 billion by 2031 at a 5.25% CAGR.
What segment generates the most revenue today?
Residential collections hold the top position with 54.15% of 2025 revenue, supported by universal curbside programs.
Which waste type is growing the fastest through 2031?
E-waste leads with a 5.98% CAGR, driven by WEEE targets and demand for recycled critical metals.
Which country contributes the most to regional revenue?
Germany accounts for 23.5% of 2025 market revenue thanks to mature deposit schemes and high recycling rates.
What is the impact of rising EPR fees on plastics?
Fees have climbed as high as USD 1,441 t in Belgium, prompting companies to redesign packaging for recyclability and boosting demand for recycled resin.
How are energy-from-waste operators addressing new ETS costs?
Many plan to install carbon-capture units or raise gate fees; in the UK the added carbon cost is projected at roughly USD 60.96 t from 2028.
Page last updated on:


