Electric Service Companies (ESCOs) Market Size and Share
Market Overview
| Study Period | 2020 - 2031 |
|---|---|
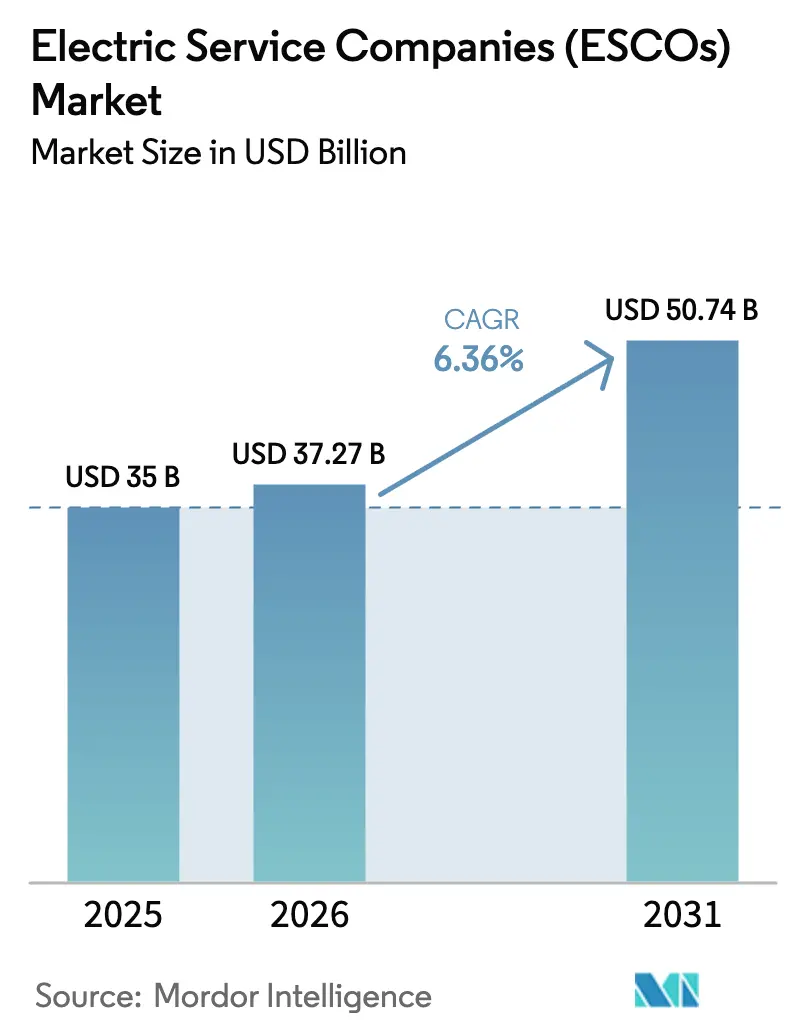
| Market Size (2026) | USD 37.27 Billion |
| Market Size (2031) | USD 50.74 Billion |
| Growth Rate (2026 - 2031) | 6.36% CAGR |
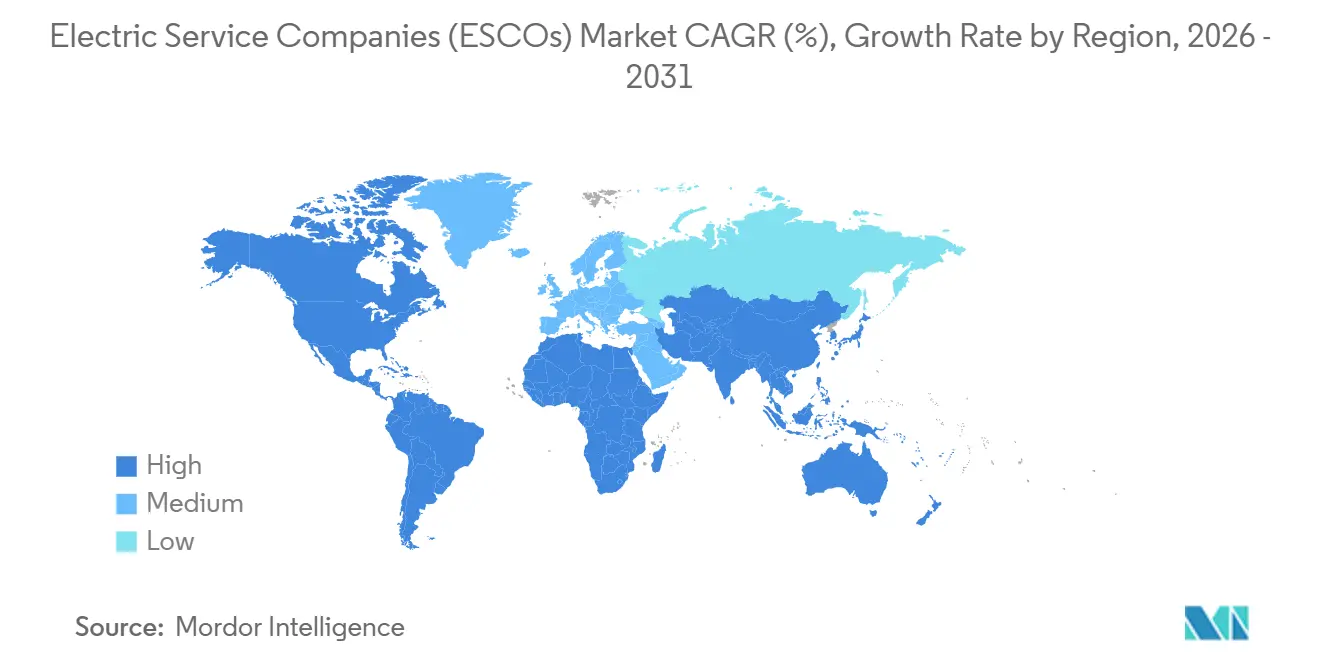
| Fastest Growing Market | Asia Pacific |
| Largest Market | North America |
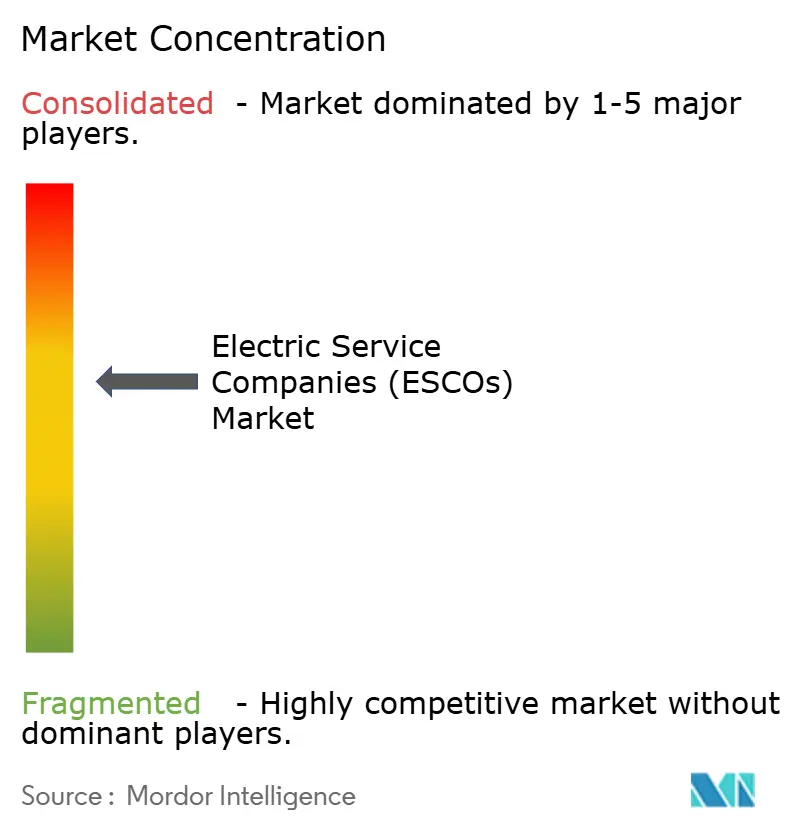
| Market Concentration | Medium |
Major Players *Disclaimer: Major Players sorted in no particular order Image © ���ϲ�����. Reuse requires attribution under CC BY 4.0. | |
Electric Service Companies (ESCOs) Market Analysis by ���ϲ�����
The Electric service companies (ESCOs) market size is projected to be USD 35 billion in 2025, USD 37.27 billion in 2026, and reach USD 50.74 billion by 2031, growing at a CAGR of 6.36% from 2026 to 2031. The uptick stems from public and private buyers moving away from capital-heavy equipment purchases toward performance-based service contracts that hand engineering and financing risk to specialized providers. Large enterprises continued to anchor spending because multi-site portfolios justify bespoke contracting, yet subscription Energy-as-a-Service (EaaS) options are unlocking demand among credit-constrained small and medium enterprises. Zero-carbon mandates across North America, Europe, and Asia-Pacific are widening retrofit pipelines, while fleet electrification creates new cross-selling opportunities for depot charging, battery storage, and demand-response software. Competition is moderate, with the top 10 firms holding about 40% to 45% combined revenue, leaving runway for software-native entrants that bundle analytics with modular hardware.
Key Report Takeaways
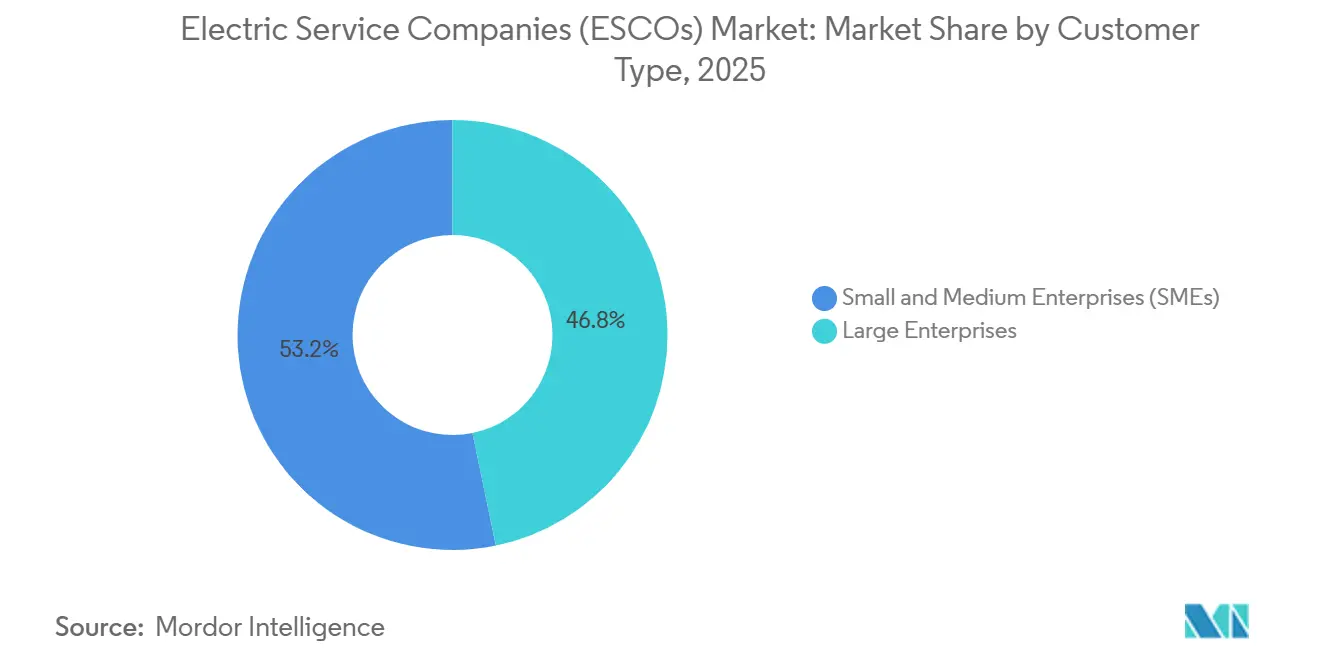
- By customer type, large enterprises accounted for 46.78% of the Electric service companies (ESCOs) market share in 2025, while small and medium enterprises are expanding at a 9.45% CAGR through 2031.
- By service model, energy performance contracting led with 52.14% revenue share in 2025, whereas Energy-as-a-Service subscriptions are the fastest grower at 7.60% CAGR.
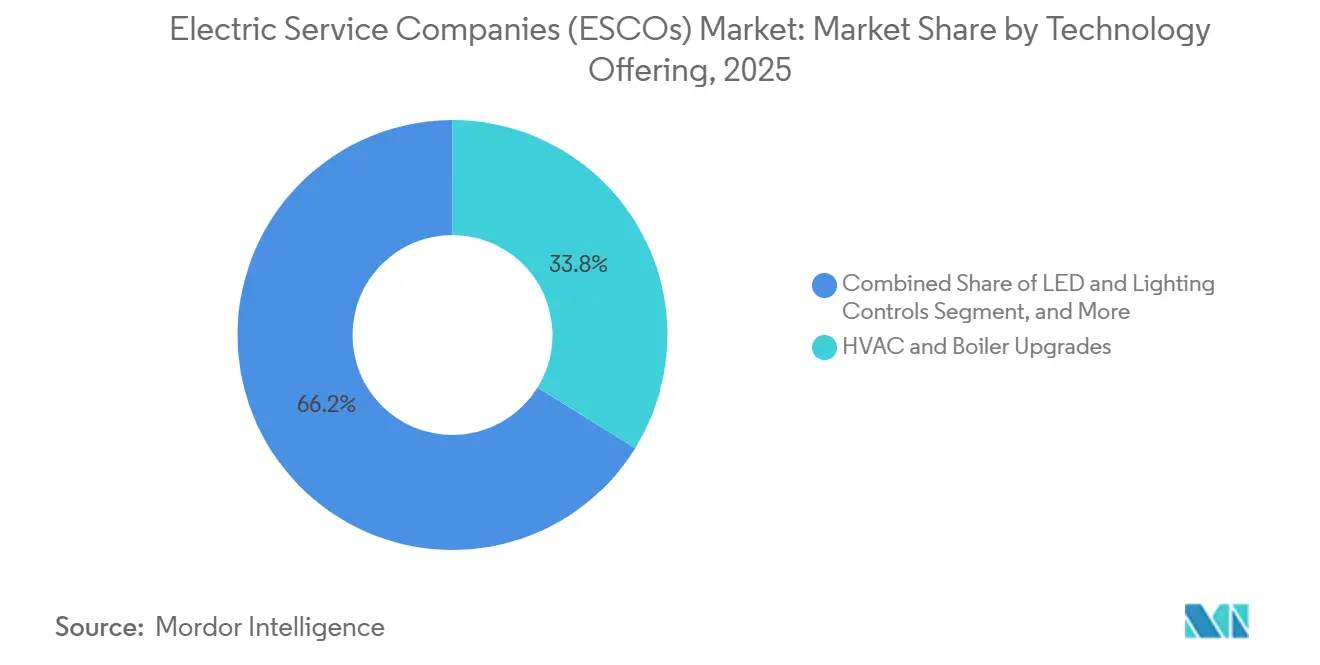
- By technology, HVAC and boiler upgrades commanded 33.82% of 2025 spending, yet EV charging infrastructure is forecast to rise at an 8.14% CAGR to 2031.
- By end-user, public and institutional facilities held 57.94% revenue in 2025, while industrial sites are on track for an 8.31% CAGR through 2031.
- By geography, North America dominated with 36.41% 2025 revenue, and Asia-Pacific is set to register a 9.88% CAGR during 2026-2031.
Note: Market size and forecast figures in this report are generated using ���ϲ�����’s proprietary estimation framework, updated with the latest available data and insights as of January 2026.
Global Electric Service Companies (ESCOs) Market Trends and Insights
Drivers Impact Analysis*
| Driver | (~) % Impact on CAGR Forecast | Geographic Relevance | Impact Timeline |
|---|---|---|---|
| Rapid shift to renewable-backed performance contracts | +1.2% | Global, with a concentration in North America and Europe | Medium term (2-4 years) |
| Government-funded zero-carbon retrofit mandates | +1.0% | Europe, North America, Asia-Pacific (China, Japan, South Korea) | Long term (≥ 4 years) |
| Electrification of commercial fleets and depots | +0.8% | North America, Europe, Asia-Pacific urban centers | Medium term (2-4 years) |
| Grid-interactive buildings incentives | +0.7% | North America (FERC Order 2222 states), Europe (EU flexibility markets) | Short term (≤ 2 years) |
| Real-time carbon-pricing APIs drive contract innovation | +0.5% | Global, early adoption in United Kingdom, California, Singapore | Short term (≤ 2 years) |
| AI-optimized Energy-as-a-Service micro-PPA bundles | +0.6% | Global, with pilot deployments in North America and Asia-Pacific | Medium term (2-4 years) |
| Source: ���ϲ����� | |||
Rapid Shift to Renewable-Backed Performance Contracts
In 2025, Ameresco noted a significant rise in the integration of solar-plus-storage components in new U.S. federal contracts, with the percentage increasing to 62% from 38% in 2023.[1]Ameresco Investor Relations, “News Releases,” investors.ameresco.com This trend highlights the growing adoption of renewable energy solutions in federal projects. Bundling on-site solar arrays with battery storage, combined with guaranteed savings, is fundamentally reshaping risk allocation in the energy sector. This approach not only provides building owners with a reliable hedge against grid volatility but also supports them in meeting their Scope 2 emissions reduction targets, which are critical for sustainability goals. The impending step-down of the U.S. Investment Tax Credit is further driving the acceleration of project timelines, as stakeholders aim to maximize the financial benefits before the credit diminishes. Furthermore, the introduction of virtual-power-plant software is creating additional opportunities by diversifying revenue streams. This software enables the monetization of demand-response, adding a third revenue source and enhancing the overall financial viability of solar-plus-storage projects.
Government-Funded Zero-Carbon Retrofit Mandates
Public-sector climate pledges are increasingly transforming into binding tenders, supported by substantial dedicated capital pools. Under its Renovation Wave initiative, the European Union has allocated EUR 150 billion (USD 169 billion) specifically for public-building upgrades.[2]European Commission, “Renovation Wave,” europa.euThis initiative requires member states to refurbish 3% of their total floor area annually, aiming to enhance energy efficiency and reduce carbon emissions across the region. Meanwhile, in the United States, the Inflation Reduction Act has established a USD 27 billion revolving loan fund. This fund extends acceptable payback windows, thereby encouraging greater participation and driving project volume toward incumbents already qualified and listed on government procurement platforms. These measures reflect a growing commitment by public-sector entities to address climate change through actionable and enforceable strategies.
Electrification of Commercial Fleets and Depots
Turnkey depot-charging contracts combine Level 2 and DC fast chargers with utility interconnection, demand-charge management, and solar canopies, offering a comprehensive solution for fleet electrification. In 2025, UPS entered into a strategic partnership with Schneider Electric to deploy 8,500 chargers at 350 sites across North America. This initiative, structured under a 15-year Energy-as-a-Service (EaaS) agreement, enabled UPS to avoid an upfront capital expenditure of USD 420 million, significantly reducing financial barriers to electrification. Furthermore, vehicle-to-grid (V2G) capabilities integrated into these chargers create a consistent revenue stream from ancillary services. This revenue is shared between energy service companies (ESCOs) and fleet owners, fostering a collaborative approach to monetizing grid-support functionalities.
Grid-Interactive Buildings Incentives
In 2024, U.S. FERC Order 2222 significantly expanded opportunities for smart buildings by allowing them to participate in capacity and ancillary-services markets.[3]Federal Energy Regulatory Commission, “Order No. 2222,” ferc.gov This regulatory change has enabled aggregated distributed energy resources to earn wholesale payments, creating new revenue streams for building operators. Johnson Controls revealed that in 2025, 28% of its automation projects incorporated demand-response enrollment, which not only boosted earnings by approximately USD 12 per kW each year but also significantly reduced payback periods by a notable 18 months. This development highlights the growing integration of smart technologies in energy management and their potential to enhance financial returns while supporting grid stability.
Restraints Impact Analysis*
| Restraint | (~) % Impact on CAGR Forecast | Geographic Relevance | Impact Timeline |
|---|---|---|---|
| Rising interest-rate environment inflates EPC payback periods | -0.9% | Global, acute in North America and Europe | Short term (≤ 2 years) |
| Supply-chain bottlenecks for high-efficiency transformers | -0.6% | Global, severe in Asia-Pacific and North America | Medium term (2-4 years) |
| Building owner data-privacy pushback on real-time metering | -0.4% | Europe (GDPR jurisdictions), California (CCPA) | Medium term (2-4 years) |
| Insurance exclusions on performance shortfall for DER assets | -0.3% | Global, emerging in North America and Australia | Long term (≥ 4 years) |
| Source: ���ϲ����� | |||
Rising Interest-Rate Environment Inflates EPC Payback Periods
As the U.S. Federal Reserve maintained its policy band at 4.25%-4.50% through H1 2026, the weighted average cost of capital for ESCO climbed to 6.2% in 2025. This increase in the cost of capital significantly impacted financial calculations and project feasibility assessments. Consequently, Ameresco experienced an extension in its average payback period, which grew from 11.4 years in 2023 to 13.7 years in 2025. This prolonged payback period created challenges for stakeholders, leading some municipalities to postpone their planned projects, as they reassessed the financial viability and long-term benefits of these investments.
Supply-Chain Bottlenecks for High-Efficiency Transformers
In North America, delays in transformer production are significantly impacting the timeline for solar and battery interconnections, causing postponements of up to 52 weeks. This prolonged delay is creating challenges for stakeholders in the renewable energy sector. To address this issue, Siemens is proactively stockpiling transformer units to mitigate the associated risks and ensure smoother operations. However, despite these efforts, the company continues to face financial setbacks due to liquidated-damage clauses, which are negatively affecting their profit margins.
*Our forecasts treat driver/restraint impacts as directional, not additive. The impact forecasts reflect baseline growth, mix effects, and variable interactions.
Segment Analysis
By Customer Type: SMEs Accelerate Subscription Adoption
Between 2026 and 2031, small and medium enterprises are projected to achieve a robust CAGR of 9.45%, reflecting their growing role in the Electric Service Companies (ESCOs) market. In 2025, large enterprises maintained a dominant position, capturing a significant 46.78% share of the ESCOs market. This divergence in growth patterns can be attributed to the increasing adoption of Energy-as-a-Service (EaaS) platforms. These platforms eliminate the need for traditional credit checks, thereby enabling SMEs to access affordable energy packages priced below USD 5,000 per month. A notable example of this trend is Schneider Electric's EcoStruxure subscription, which is specifically designed for SMEs. This subscription achieved an impressive 34% attach rate among users whose annual electricity expenditure was under USD 200,000, highlighting its appeal to cost-conscious businesses.
SMEs are increasingly favoring operating-expense contracts, as these qualify for off-balance-sheet treatment under the ASC 842 accounting standard. This approach allows SMEs to manage their energy costs more effectively without impacting their balance sheets. On the other hand, large enterprises often choose to self-finance their energy upgrades, enabling them to take advantage of tax depreciation benefits. In Europe, regional buying groups are playing a pivotal role in the market by aggregating dozens of SMEs under master EaaS agreements. This strategy not only enhances the scale of operations but also significantly improves the negotiating power of these SMEs, allowing them to secure better terms and pricing for their energy needs.


By Service Model: EPC Dominance Faces EaaS Disruption
In 2025, energy performance contracting dominated the market with a significant 52.14% revenue share, showcasing its strong position in the industry. However, EaaS (Energy-as-a-Service) subscriptions are experiencing a robust annual growth rate of 7.60%, indicating a shift in client preferences toward more flexible and scalable solutions. Clients are increasingly favoring predictable billing structures, which help them avoid the complexities and disputes often associated with measurement-and-verification processes in guaranteed-savings agreements. This trend highlights the growing demand for transparency and simplicity in energy service contracts. In a notable move, Honeywell introduced a carbon-indexed product that ties payments directly to verified emission reductions, offering a unique solution that aligns seamlessly with corporate ESG (Environmental, Social, and Governance) metrics. This innovation reflects the increasing emphasis on sustainability and measurable environmental impact within the corporate sector.
Siemens is pioneering a hybrid approach with its EaaS-plus model, which combines a fixed base fee with profit-sharing mechanisms, effectively challenging and redefining traditional categorizations in the energy services market. This innovative structure provides clients with both stability and the potential for shared financial benefits, making it an attractive option for businesses seeking customized solutions. Meanwhile, operation-and-maintenance-only contracts have carved out a niche in the market, specifically catering to assets that have moved beyond their initial guarantee periods. These contracts address the ongoing needs of aging infrastructure, ensuring continued efficiency and performance while offering a cost-effective solution for asset management.
By Technology Offering: EV Charging Surges Amid Electrification
In 2025, HVAC and boiler upgrades accounted for 33.82% of expenditures, highlighting their significant share in the market. Meanwhile, EV charging infrastructure is projected to grow at the fastest rate, boasting an impressive 8.14% CAGR through 2031. Depot projects are increasingly bundling chargers, solar canopies, and batteries into cohesive packages, effectively capitalizing on available rebates and tax credits to enhance their value proposition. Additionally, building-management systems are gaining traction in the market, particularly as BACnet and Project Haystack continue to play a pivotal role in reducing integration costs and improving operational efficiency.
Driven by federal sustainability mandates, on-site renewables and storage now constitute 38% of Ameresco’s project backlog, reflecting the growing emphasis on clean energy solutions. Furthermore, vehicle-to-grid-ready chargers are paving the way for hybrid flexibility products, which are designed to bridge both the EV and distributed-energy sectors. These chargers not only support the transition to electric vehicles but also contribute to the broader energy ecosystem by enabling bidirectional energy flow and enhancing grid stability.

By End-User Sector: Industrial Gains Momentum
Public and institutional sites accounted for a dominant 57.94% of 2025 revenues, showcasing their continued significance in the market. However, industrial customers are set to grow at an impressive 8.31% CAGR, indicating a shift in focus and opportunities for growth within this segment. In a bid to meet supply-chain carbon reporting demands and align with global sustainability goals, manufacturers are increasingly adopting ISO 50001 energy-management systems to enhance energy efficiency and reduce carbon footprints.
In the European Union, carbon-border-adjustment mechanisms are compelling exporters to demonstrate reduced energy intensity, thereby promoting the electrification of process heat as a viable solution. This regulatory push is driving innovation and adoption of advanced technologies. ENGIE highlighted that a notable 41% of its industrial contracts for 2025 featured high-temperature heat pumps, reflecting the growing demand for energy-efficient solutions in industrial applications. While commercial real estate continues to expand steadily, its growth faces challenges due to split-incentive lease structures, which create misaligned incentives between property owners and tenants, potentially slowing the adoption of energy-efficient upgrades.
Geography Analysis
In 2025, North America accounted for 36.41% of the revenue in the Electric Service Companies (ESCOs) market. This significant share was bolstered by federal tax credits and well-established performance-contracting statutes, which have been instrumental in driving market growth. Additionally, state energy-efficiency resource standards mandate utilities to support demand-side programs, ensuring a consistent and reliable pipeline of projects for ESCOs. Furthermore, federal agencies continue to rely on proven ESCO frameworks, which not only streamline operations but also help in reducing execution risks, making them a preferred choice for energy efficiency initiatives.
Europe, capturing a share in the mid-20s range in 2025, was propelled by several key initiatives, including the Renovation Wave and the Energy Performance of Buildings Directive. The latter mandates a ban on fossil-fuel heating in newly constructed buildings post-2025, which has significantly influenced the market landscape. Moreover, dynamic grid tariffs, which were finalized in 2024, now incentivize load shifting, thereby encouraging the adoption of advanced control systems. These tariffs reward consumers for optimizing energy usage, further driving the deployment of innovative technologies and solutions across the region.
Asia-Pacific is forecast to grow at a 9.88% CAGR through 2031, the fastest worldwide. China’s dual-carbon policy, India’s smart-meter mandates, and Japan’s corporate PPA incentives expand the regional addressable market. Supply-chain localization, such as Schneider Electric’s planned battery plants in India, Vietnam, and Indonesia, aims to curb project lead times. South America and the Middle East and Africa are smaller today yet gaining traction. Brazil’s distributed generation rules and Saudi Arabia’s Vision 2030 renewable goals spur turnkey solar-plus-storage contracts. District-cooling know-how gives specialized ESCOs an edge in Gulf markets facing extreme cooling loads.

Competitive Landscape
The Electric service companies (ESCOs) market shows moderate concentration, with the top 10 firms holding roughly 40% to 45% combined revenue. Incumbents like Ameresco, ENGIE, and Siemens are vertically integrating by acquiring installers and battery developers, securing margin control across design-build-operate phases. Challengers pursue asset-light platform models, aggregating third-party capital while outsourcing construction, thereby scaling quickly without balance-sheet strain.
Technology leadership is emerging as the decisive differentiator. Siemens filed a 2025 U.S. patent for a reinforcement-learning HVAC controller that cut energy use by 18% compared with rule-based systems. Proprietary analytics shorten paybacks and justify premium pricing, raising entry barriers for mechanical-only contractors. Fourteen ESCO mergers closed in 2025, up from nine the year prior, as private-equity investors seek the scale needed to access low-cost green-bond financing.
White-space opportunities concentrate in industrial heat electrification and vehicle-to-grid aggregation. Smaller regional specialists win sub-USD 5 million deals by offering streamlined measurement rules that large ESCOs deem uneconomic, particularly across secondary U.S. cities and rural hospitals. Market dynamics may bifurcate, with full-service giants focusing on Fortune 500 portfolios while subscription platforms chase SME volume.
Electric Service Companies (ESCOs) Industry Leaders
Ameresco Inc.
ENGIE SA (ENGIE Solutions)
Siemens Smart Infrastructure
Johnson Controls International plc
Schneider Electric SE
- *Disclaimer: Major Players sorted in no particular order

Recent Industry Developments
- January 2026: Schneider Electric committed USD 1.2 billion to extend its EaaS platform across Asia-Pacific, including three new battery-assembly sites in India, Vietnam, and Indonesia.
- December 2025: Johnson Controls acquired Qmerit for USD 340 million, adding 2,800 certified electricians to accelerate turnkey depot-charging solutions.
- November 2025: Ameresco signed a 20-year USD 287 million EaaS contract with the U.S. Department of Veterans Affairs to retrofit 47 medical centers with 185 MW of solar-plus-storage.
- October 2025: ENGIE Solutions and Mitsubishi Heavy Industries created a joint venture to deploy high-temperature industrial heat pumps across European factories.


Research Methodology Framework and Report Scope
Market Definitions and Key Coverage
Our study defines the electric service companies (ESCOs) market as the revenue that accredited firms earn from performance-based energy efficiency contracts, shared-savings agreements, and subscription Energy-as-a-Service packages that cut a client's utility spend while guaranteeing measurable savings. Activities captured range from audit and design through installation, financing, monitoring, and measurement and verification across commercial, industrial, public-institutional, and large multifamily facilities.
Scope Exclusion: purely commodity power retailing and the standalone sale of efficiency hardware without a savings guarantee lie outside Mordor's coverage.
Segmentation Overview
- By Customer Type
- Large Enterprises
- Small and Medium Enterprises (SMEs)
- By Service Model
- Energy Performance Contracting (EPC)
- Guaranteed Savings Contracts
- Energy-as-a-Service (EaaS) Subscriptions
- Operation and Maintenance (O&M) Services
- By Technology Offering
- HVAC and Boiler Upgrades
- LED and Lighting Controls
- Building Management and Smart Controls
- On-Site Renewable and Storage (PV, BESS)
- EV Charging Infrastructure
- By End-User Sector
- Commercial Buildings
- Industrial Facilities
- Public and Institutional
- Residential Multi-Family
- By Geography
- North America
- United States
- Canada
- Mexico
- South America
- Brazil
- Argentina
- Rest of South America
- Europe
- Germany
- United Kingdom
- France
- Italy
- Spain
- Rest of Europe
- Asia Pacific
- China
- Japan
- South Korea
- India
- Australia
- New Zealand
- Rest of Asia-Pacific
- Middle East and Africa
- Middle East
- United Arab Emirates
- Saudi Arabia
- Turkey
- Rest of Middle East
- Africa
- South Africa
- Nigeria
- Kenya
- Rest of Africa
- Middle East
- North America
Detailed Research Methodology and Data Validation
Primary Research
To validate desk findings, we interview ESCO executives, facility managers, financiers, and state energy-office officials across North America, Europe, Asia-Pacific, and the Gulf. Conversations probe real-world payback thresholds, emerging contract models, and regional policy triggers, and short web surveys of building owners help us cross-check assumed retrofit uptake and average service pricing.
Desk Research
Mordor analysts start with authoritative public datasets such as the US Department of Energy's Better Buildings program, Eurostat's energy balance tables, the IEA ESCO survey, and UNEP Copenhagen Climate Centre country scorecards, which map project investment flows and retrofit rates. Trade associations, for instance, the National Association of Energy Service Companies, Japan ESCO Association, and China ESCO Committee, supply project counts and typical contract values that anchor regional penetration ratios. Company filings downloaded from D&B Hoovers, tender notices scraped via Tenders Info, and news archived on Dow Jones Factiva enrich understanding of deal pipelines, while peer-reviewed journals clarify technology performance multipliers. This list is illustrative; many additional open and paid sources inform our evidence base.
Market-Sizing and Forecasting
The model begins with a top-down reconstruction that scales reported ESCO investment pools, retrofit floor area, and average project cost to 2024 dollars, then feeds those results into a bottom-up cross-check built from sampled supplier revenues and contract backlogs. Variables that move the forecast include: 1) commercial building floor-space additions, 2) average retrofit intensity ($/m²), 3) utility rebate budgets, 4) carbon-pricing trajectories, and 5) weighted contract lengths that govern annual revenue recognition. A multivariate regression links each driver to historical market growth; scenario analysis adjusts for policy acceleration or interest-rate shocks. Data gaps in supplier roll-ups are bridged by region-specific uptake factors vetted during primary calls.
Data Validation and Update Cycle
Outputs pass a three-layer review: automated variance scans, peer analyst challenge sessions, and leadership sign-off. We refresh models each year and trigger interim updates when stimulus packages, energy-price spikes, or landmark regulations materially alter retrofit economics; just before publication, an analyst reruns the checks so clients receive the freshest view.
Why Mordor's Electric Service Companies Baseline Commands Reliability
Published estimates often differ because firms pick dissimilar service baskets, convert currencies on varied dates, and refresh at uneven intervals.
Key gap drivers include whether subscription EaaS revenue is folded in, if country-level subsidies are grossed-up or netted, and the choice of price escalators that convert project investment to annual revenue. Mordor's scope captures all contracted savings models and applies project-stage weightings derived from recent tenders, while some providers rely on a single ASP or outdated 2022 baselines.
Benchmark comparison
| Market Size | Anonymized source | Primary gap driver |
|---|---|---|
| USD 35.0 B (2025) | ���ϲ����� | - |
| USD 33.65 B (2024) | Global Consultancy A | Omits small guaranteed-savings projects; uses uniform pricing across regions |
| USD 30.2 B (2022) | Industry Association B | Older base year and no inflation uplift; excludes Energy-as-a-Service subscriptions |
In sum, Mordor's disciplined blend of validated variables, balanced contract coverage, and annual refresh cadence yields a dependable baseline that decision-makers can trace, replicate, and update with confidence.


Key Questions Answered in the Report
How large is the Electric service companies (ESCOs) market today and where will it be by 2031?
It stands at USD 37.27 billion in 2026 and is projected to reach USD 50.74 billion by 2031, advancing at a 6.36% CAGR.
Which customer segment is expanding the fastest?
Small and medium enterprises are growing at a 9.45% CAGR because subscription EaaS contracts remove upfront capital hurdles.
What service model is gaining the most traction?
Energy-as-a-Service subscriptions are the quickest-growing structure, rising at 7.60% per year as clients favor predictable monthly fees.
Why is EV charging important for ESCOs?
Depot electrification needs turnkey design, finance, and operation, propelling EV infrastructure to an 8.14% CAGR through 2031.
Page last updated on:


