Dental Prosthetics Market Size and Share
Market Overview
| Study Period | 2020 - 2031 |
|---|---|
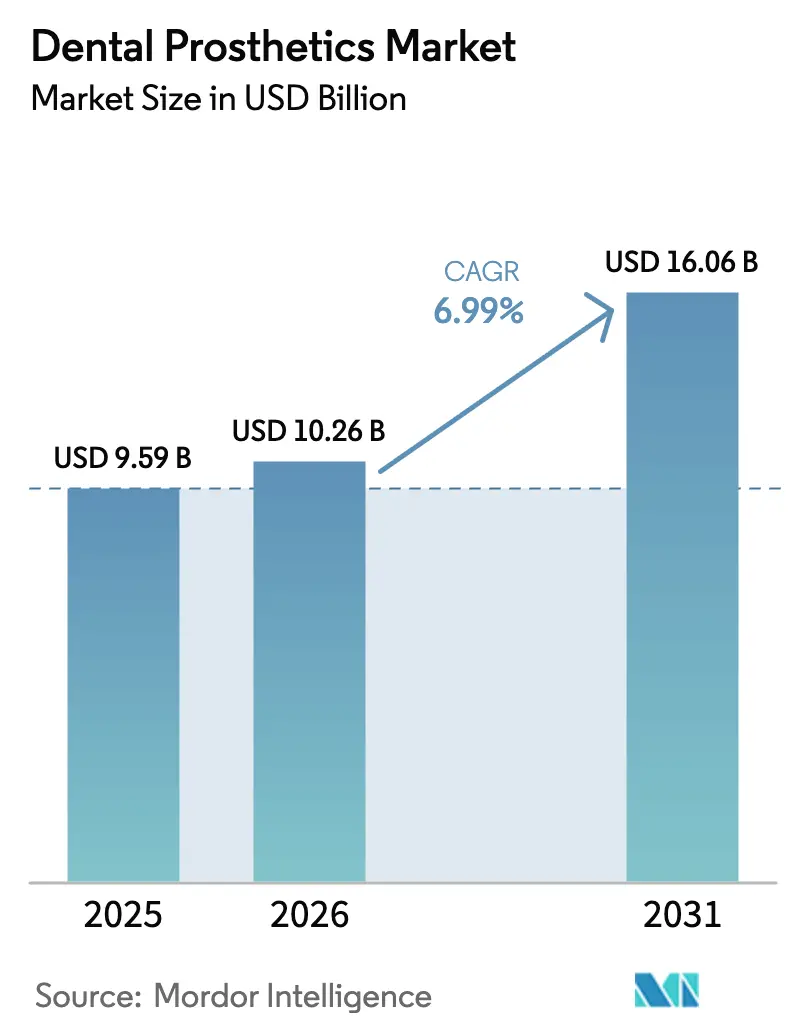
| Market Size (2026) | USD 10.26 Billion |
| Market Size (2031) | USD 16.06 Billion |
| Growth Rate (2026 - 2031) | 6.99% CAGR |
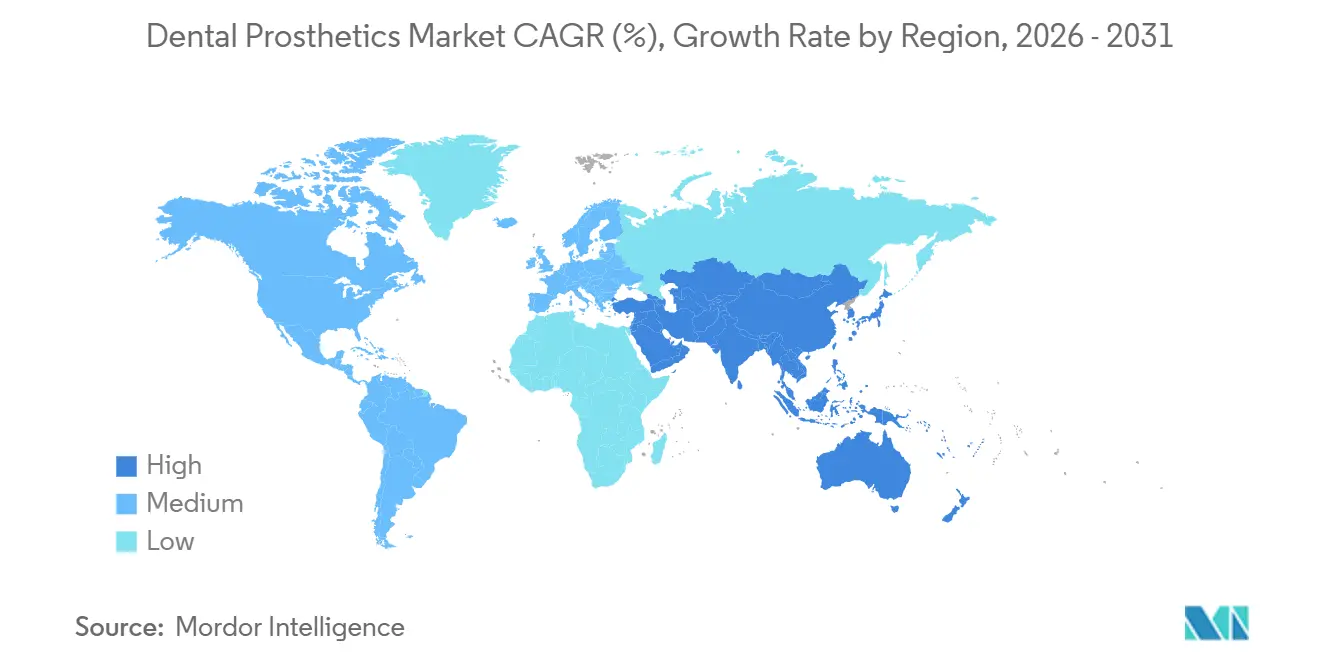
| Fastest Growing Market | Asia Pacific |
| Largest Market | North America |
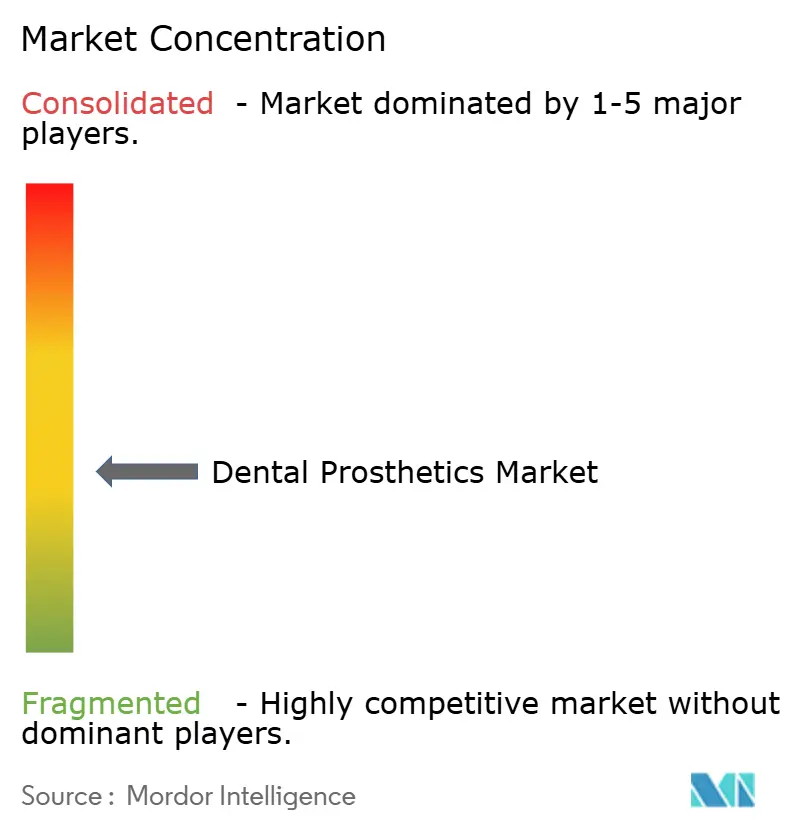
| Market Concentration | Medium |
Major Players *Disclaimer: Major Players sorted in no particular order Image © ���ϲ�����. Reuse requires attribution under CC BY 4.0. | |
Dental Prosthetics Market Analysis by ���ϲ�����
The Dental Prosthetics Market size is expected to grow from USD 9.59 billion in 2025 to USD 10.26 billion in 2026 and is forecast to reach USD 16.06 billion by 2031 at 6.99% CAGR over 2026-2031.
Structural reforms in Asia-Pacific and the Middle East are lifting coverage for crowns, bridges, and dentures, while the United States’ 2025 tariff on Chinese imports is driving near-shoring to Mexico and Canada. Tariff-driven supply-chain shifts, rising dental-insurance penetration, and digital CAD/CAM workflows together compress turnaround times and widen patient access to premium restorations. Aesthetic preferences are also reshaping demand as millennials and Generation X perceive anterior restorations as career investments rather than mere clinical fixes. Finally, raw-material price spikes in zirconia and cobalt-chromium metals are prompting laboratories to hedge procurement and re-engineer designs around hybrid composites.
Key Report Takeaways
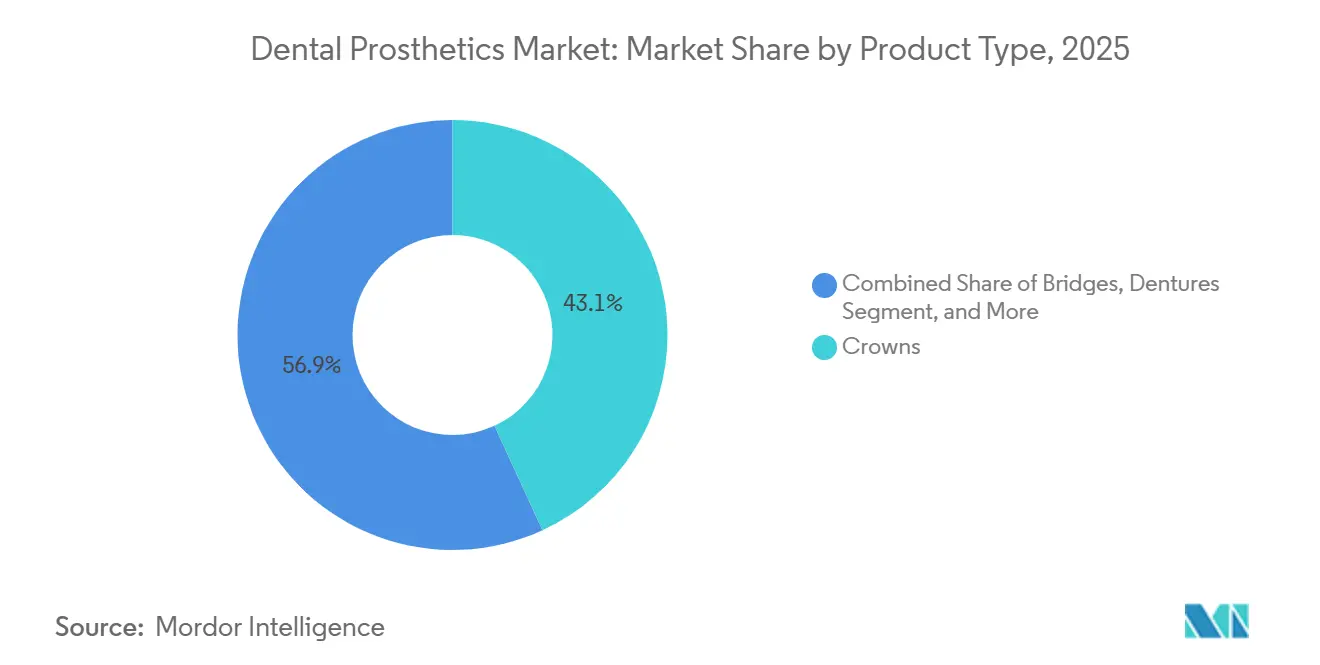
- By product category, crowns led with 43.12% of the dental prosthetics market share in 2025, and the dentures segment is growing at a 6.85% CAGR through 2031.
- By material, ceramic and zirconia accounted for 48.05% of the dental prosthetics market in 2025, and the hybrid/composite materials are growing with a 9.33% CAGR through 2031.
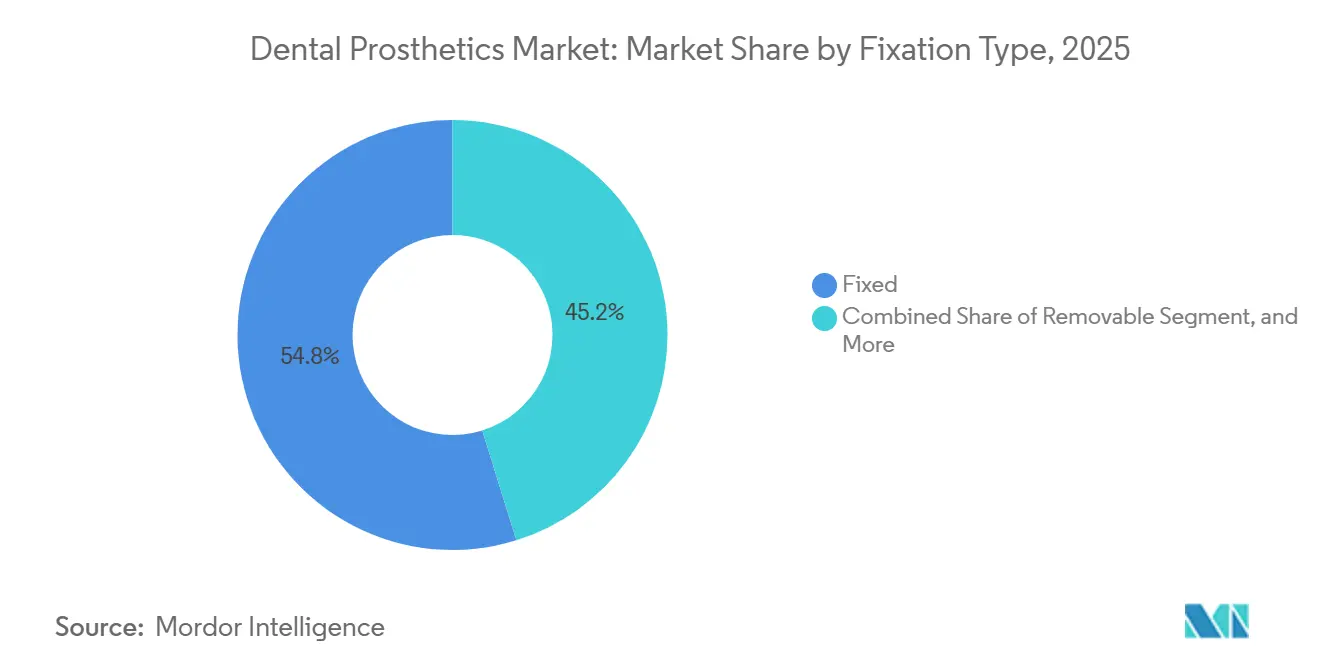
- By fixation type, fixed restorations captured 54.82 % of revenue in 2025, while fixed-removable hybrids are advancing at a 10.93 % CAGR through 2031.
- By end user, dental clinics accounted for 63.78% of revenue in 2025; dental laboratories are projected to grow at an 8.93% CAGR through 2031.
- By geography, North America accounted for 35.08% of global revenue in 2025; Asia-Pacific is forecast to expand at a 8.93% CAGR between 2026 and 2031.
Note: Market size and forecast figures in this report are generated using ���ϲ�����’s proprietary estimation framework, updated with the latest available data and insights as of 2026.
Global Dental Prosthetics Market Trends and Insights
Drivers Impact Analysis*
| Driver | (~) % Impact on CAGR Forecast | Geographic Relevance | Impact Timeline |
|---|---|---|---|
| Aging Population & Edentulism Surge | +1.8% | Japan, Germany, Italy, coastal China | Long term (≥ 4 years) |
| Rising Demand for Aesthetic Dentistry | +1.5% | North America, Western Europe, GCC, urban India & China | Medium term (2-4 years) |
| Rapid Adoption of CAD/CAM & 3D Printing | +1.4% | North America, Germany, Japan, South Korea, Australia | Short term (≤ 2 years) |
| Expanding Dental Insurance Coverage | +1.2% | United States, China pilot cities, Brazil | Medium term (2-4 years) |
| AI-Driven Automated Design Workflows | +0.9% | North America, Germany, Israel, Singapore | Short term (≤ 2 years) |
| Near-Shoring Spurred by Tariff Barriers | +0.6% | United States, Canada, Mexico | Short term (≤ 2 years) |
| Source: ���ϲ����� | |||
Aging Population & Edentulism Surge
Severe tooth loss affected 349 million people worldwide in 2021; prevalence already exceeds 30% among adults 65+ in Japan, Germany, and Italy. China’s seniors will reach 400 million by 2030, yet only 12% use any prosthetics. Japan’s insurer reimburses 70% of implant costs, raising implant-supported bridges to 41% of senior placements in 2025. National payers, rather than raw demographics, now dictate velocity as subsidies nudge patients toward crowns and implant bridges that preserve mastication and nutrition.
Rising Demand for Aesthetic Dentistry
Aesthetic-procedure revenue in the United States climbed 14 % in 2025, with veneers and all-ceramic crowns making up 68 % of electives.[1]American Academy of Cosmetic Dentistry, “2025 Member Survey,” aacd.com Video-conferencing culture increased scrutiny of tooth color, pushing professionals under 45 to treat restorations as career assets. The UAE and Saudi Arabia increased cosmetic spend by 22% in 2025 through bundled medical tourism packages. India’s urban crowdlending placements rose 19% in 2024 as fintech-driven zero-interest plans spread. Peer-reviewed links between dental aesthetics and employability are reinforcing willingness to pay premiums.
Rapid Adoption of CAD/CAM & 3D Printing
Sixty-one percent of U.S. laboratories operated in-house milling units in 2025, up from 48 % in 2023.[2]National Association of Dental Laboratories, “Position Statement on Tariffs,” nadl.org 3D printers now produce denture bases in 90 minutes, enabling same-day full arches. University of Texas at Dallas researchers removed sintering shrinkage from zirconia prints, a step toward post-process-free crowns. Capital hurdles remain high at USD 150,000 per industrial printer, bifurcating urban and rural lab capabilities.
Expanding Dental Insurance Coverage
Medicare Advantage pilots in Florida, Texas, and California funded implant-supported overdentures in 2024, and 18% of eligible seniors opted in by Q1 2025. China’s pilot cities capped zirconia-crown copays at CNY 800 (USD 110), triggering a 31 % placement surge. Brazil forced private insurers to cover one complete denture every five years from 2025. Yet reimbursement rates lag private fees by 30-40%, squeezing provider margins.
Restraints Impact Analysis*
| Restraint | (~) % Impact on CAGR Forecast | Geographic Relevance | Impact Timeline |
|---|---|---|---|
| High Procedure & Device Costs | -1.3% | United States, Western Europe, urban Latin America | Long term (≥ 4 years) |
| Shortage of Digitally Skilled Technicians | -0.9% | Rural North America, Eastern Europe, Southeast Asia, Sub-Saharan Africa | Medium term (2-4 years) |
| Volatile Zirconia & Noble-Metal Prices | -0.7% | Europe, Japan supply chains | Short term (≤ 2 years) |
| Fragmented Global Data-Protection Rules | -0.5% | EU, United Kingdom, United States, China | Medium term (2-4 years) |
| Source: ���ϲ����� | |||
High Procedure & Device Costs
The average U.S. implant-and-crown out-of-pocket cost reached USD 4,200 in 2025, up 7% year over year.[3]American Dental Association, “2025 Health Policy Institute Data,” ada.org Germany reimburses only 60% of metal-ceramic reference prices, leaving patients with USD 650-975 for an all-ceramic upgrade. In Brazil, a single zirconia crown costs BRL 2,800 (USD 560), 60 % of the monthly minimum wage. Capital spending on CAD/CAM forces labs to raise prices, further limiting access.
Shortage of Digitally Skilled Technicians
Sixty-eight percent of U.S. labs reported CAD skill vacancies in 2024; rural vacancy rates exceeded 15%. Only 22 % of accredited programs teach intraoral-scan processing. German apprenticeships shrank 19 % over five years, and India faces 25 % annual attrition as technicians migrate to GCC clinics. Skills shortages concentrate complex case work in urban consolidators.
*Our updated forecasts treat driver/restraint impacts as directional, not additive. The revised impact forecasts reflect baseline growth, mix effects, and variable interactions.
Segment Analysis
By Product Type: Crowns Anchor Revenue, Dentures Accelerate
Crowns dominated 2025 with a 43.12% share of the dental prosthetics market, lifted by single-visit CAD/CAM, which eliminates the need for temporaries. Dentures, however, are forecast to grow at 6.85% through 2031, as aging populations in Japan, Germany, and Italy favor removable options that accommodate bone resorption. Bridges accounted for roughly 18% in 2025, stable among patients who forgo implant surgery. Abutments rose in line with an 11% global increase in implant placement in 2025.
VITA introduced a lithium-disilicate veneer with a 0.3 mm thickness, preserving enamel while increasing fracture toughness by 30 %. The product landscape rewards versatility; labs fluent in both fixed and removable workflows capture a wider patient base, while single-line specialists face margin compression.


By Material: Zirconia Dominates, Hybrids Surge
Ceramic and zirconia accounted for 48.05% of the dental prosthetics market share in 2025, propelled by ultra-translucent grades that mimic enamel. Hybrid composites are poised to grow at 9.33% as glass-fiber polymers replicate dentin's elasticity, reducing stress at interfaces. Metal-ceramic still held 22 % for posterior durability, yet faces cosmetic headwinds. Pure metals accounted for 12%, mainly in removable frameworks and abutments.
Polymers and acrylics accounted for 10% but are being disrupted by printed resins. University of Tokyo researchers blended graded-strength zirconia into single crowns, reducing chipping risk by 40%. Ivoclar’s IPS e.max ZirCAD Prime delivers 850 MPa flexural strength at 49% translucency, covering full-arch cases with a single material.
By Fixation Type: Fixed Restorations Lead, Hybrids Gain Geriatric Traction
Fixed solutions accounted for 54.82% of 2025 revenue, reflecting patients' desire for permanence. Hybrid fixed-removable overdentures are forecast to grow at a 10.93% CAGR, addressing hygiene challenges for seniors with dexterity loss. Conventional removable dentures are growing thanks to lower upfront costs (USD 1,200-2,500 versus USD 15,000-30,000 for all-on-four). Straumann’s Pro Arch and Nobel Biocare’s Trefoil compress chair time and cost by combining screw-retained bars with simplified implant layouts.
Demand splits along age lines; sub-60 patients overwhelmingly choose fixed for social confidence, while 75+ cohorts prize removable ease of cleaning. Laboratories offering modular platforms that convert removable dentures to fixed, as finances improve, capture lifetime value.
By End User: Clinics Dominate Volume, Labs Consolidate Value
Dental clinics generated 63.78% of revenue in 2025 but face capital strain from USD 120,000 in chairside systems and annual fees. Dental laboratories are projected to grow at 8.93 % CAGR to 2031 as Glidewell, National Dentex, and Henry Schein consolidate independents, pooling CAD talent and logistics. Hospitals and surgical centers accounted for 9% of maxillofacial and oncology cases; academic institutes accounted for nearly 2% of clinical trials.
Outsourcing is on the rise: 58% of U.S. general dentists sent crowns to external labs in 2025, up from 51% in 2023. Fast-turnaround logistics mirror e-commerce playbooks, with labs guaranteeing 24-hour delivery within regional hubs.
Geography Analysis
North America accounted for 35.08% of 2025 revenue, buoyed by Medicare Advantage reimbursement and USMCA-driven near-shoring. Yet 68% of labs struggle to fill CAD vacancies, and FDA 510(k) and ISO 13485 compliance add USD 200,000-500,000 in overhead, reinforcing consolidation. Mexico attracted USD 180 million in lab investment, while Canada added 1,200 jobs.
Asia-Pacific is set to grow at an 8.93% CAGR as China’s copay cap sparked a 31% surge in crowdfunded placements in pilot cities. Japan reimburses 70% of senior implant costs, pushing fixed bridges to 41% of placements. India’s fintech-enabled installment plans raise elective demand, while Seoul and Sydney universities pioneer AI crown design. Infrastructure gaps persist: fewer than 30 % of rural Southeast Asian clinics own intraoral scanners.
German patients pay an extra USD 650-975 for all-ceramic upgrades. NHS England’s 2.1 million-appointment backlog funnels U.K. patients to private implants at USD 1,000-1,500. Southern European dental tourism undercuts northern prices by 40 %, drawing 340,000 inbound patients to Spain. The GCC posted 22% cosmetic dentistry growth, and Brazil’s mandatory denture coverage lifts South American momentum.

Competitive Landscape
The dental prosthetics market remains moderately fragmented. Envista bought two European implant distributors for USD 210 million, and Straumann acquired a 60 % stake in a Shanghai AI-software firm. The USPTO granted 127 prosthetic patents in 2025, one-third focused on zirconia microstructures and another quarter on AI margin detection.
Disruptors include Carbon’s FP3D resin, boosting denture flexural strength by 28 %, and Overjet’s AI diagnostic that flags sub-optimal margins pre-milling. Compliance costs for ISO 13485 and FDA 510(k) filings deter small entrants, while large chains exploit scale to maintain 24-hour turnaround networks. White-space opportunities lie in rural tele-dentistry platforms and subscription crown-replacement bundles.
Dental Prosthetics Industry Leaders
BioHorizons Inc
Straumann AG
Nobel Biocare Services
Osstem implant Co. Ltd
Zimmer Biomet Holdings
- *Disclaimer: Major Players sorted in no particular order

Recent Industry Developments
- February 2026: Envista acquired two European implant distributors for USD 210 million.
- September 2025: Carbon launched FP3D denture resin with 28 % higher flexural strength and 90-minute print times.
- September 2025: Dentsply Sirona unveiled DS Core AI, trimming bridge design time to 6 minutes.
- June 2025: Straumann bought 60 % of a Shanghai digital-design firm for USD 85 million.


Global Dental Prosthetics Market Report Scope
Prosthodontics is a professional practice of dentistry that deals with fixed and detachable dental restorations called dental prosthetics to restore normal dental functioning and aesthetic appearance. These treatments are used in oral rehabilitation, diagnosing, and managing cures with the help of dental prosthetics to handle various kinds of oral health ailments and functional purposes such as treating jaw ailments such as temporomandibular joint disorders (TMJD). The dental prosthetics market is segmented by product type (dental bridges, crowns, abutments, dentures, and others), material (titanium, zirconium, ceramic, others), end-user (hospitals and clinics, dental laboratories, others), geography (North America, Europe, Asia-Pacific, Middle-East and Africa, and South America). The market report also covers the estimated market sizes and trends for 17 countries across major regions globally. The report offers value in USD million for the above segments.
| Crowns |
| Bridges |
| Dentures |
| Abutments |
| Inlays / Onlays / Veneers |
| Other Prosthetics |
| Ceramic / Zirconia |
| Metal-Ceramic (PFM) |
| Metals |
| Polymers & Acrylics |
| Hybrid / Composite Materials |
| Fixed |
| Removable |
| Fixed-Removable Hybrid |
| Dental Clinics |
| Dental Laboratories |
| Hospitals & Surgical Centers |
| Academic & Research Institutes |
| North America | United States |
| Canada | |
| Mexico | |
| Europe | Germany |
| United Kingdom | |
| France | |
| Italy | |
| Spain | |
| Rest of Europe | |
| Asia-Pacific | China |
| Japan | |
| India | |
| Australia | |
| South Korea | |
| Rest of Asia-Pacific | |
| Middle East & Africa | GCC |
| South Africa | |
| Rest of Middle East & Africa | |
| South America | Brazil |
| Argentina | |
| Rest of South America |
| By Product Type | Crowns | |
| Bridges | ||
| Dentures | ||
| Abutments | ||
| Inlays / Onlays / Veneers | ||
| Other Prosthetics | ||
| By Material | Ceramic / Zirconia | |
| Metal-Ceramic (PFM) | ||
| Metals | ||
| Polymers & Acrylics | ||
| Hybrid / Composite Materials | ||
| By Fixation Type | Fixed | |
| Removable | ||
| Fixed-Removable Hybrid | ||
| By End User | Dental Clinics | |
| Dental Laboratories | ||
| Hospitals & Surgical Centers | ||
| Academic & Research Institutes | ||
| By Geography | North America | United States |
| Canada | ||
| Mexico | ||
| Europe | Germany | |
| United Kingdom | ||
| France | ||
| Italy | ||
| Spain | ||
| Rest of Europe | ||
| Asia-Pacific | China | |
| Japan | ||
| India | ||
| Australia | ||
| South Korea | ||
| Rest of Asia-Pacific | ||
| Middle East & Africa | GCC | |
| South Africa | ||
| Rest of Middle East & Africa | ||
| South America | Brazil | |
| Argentina | ||
| Rest of South America | ||


Key Questions Answered in the Report
What is the projected value of the dental prosthetics market in 2031?
The market is forecast to reach USD 16.06 billion by 2031.
How fast will demand grow after 2026?
Revenue is expected to rise at a 6.99 % CAGR from 2026 to 2031.
Which product category leads global sales today?
Crowns held 43.12 % of 2025 revenue and remain the top seller.
Why are hybrid fixed-removable overdentures gaining traction?
They solve hygiene challenges for seniors while costing less than fully fixed bridges.
Which region offers the fastest long-term growth?
Asia-Pacific is projected to expand at an 8.93 % CAGR through 2031, lifted by Chinese reimbursement reforms.
Page last updated on:


