Computer Vision Market Size and Share
Market Overview
| Study Period | 2020 - 2031 |
|---|---|
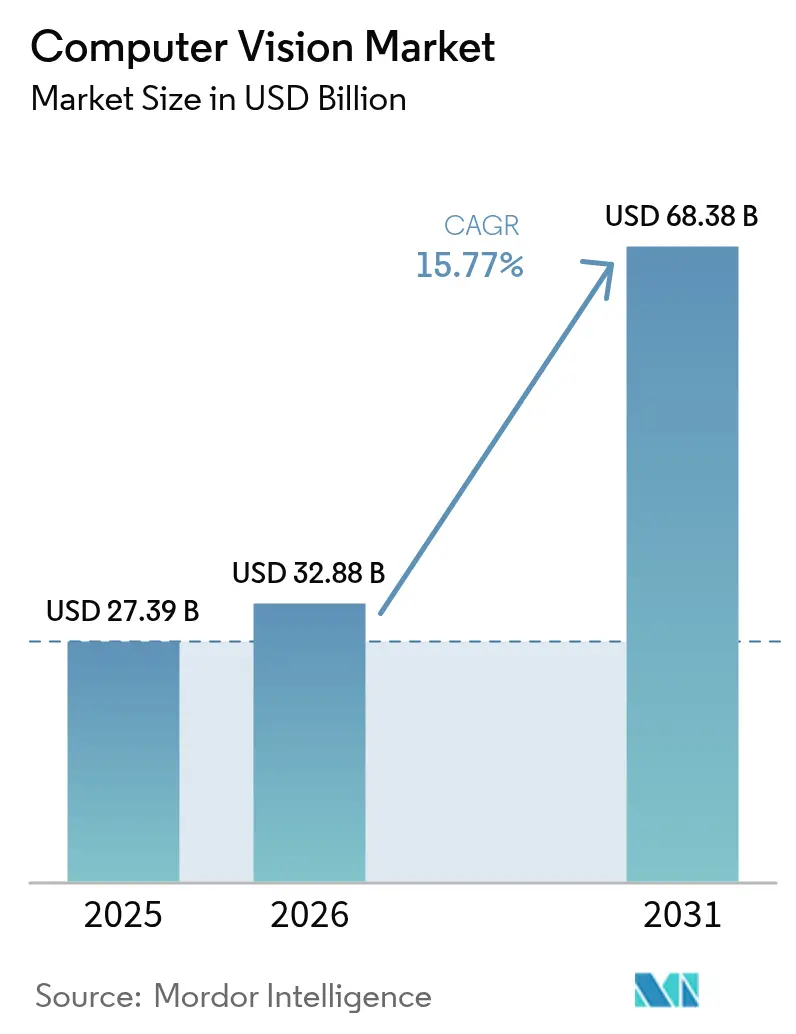
| Market Size (2026) | USD 32.88 Billion |
| Market Size (2031) | USD 68.38 Billion |
| Growth Rate (2026 - 2031) | 15.77% CAGR |
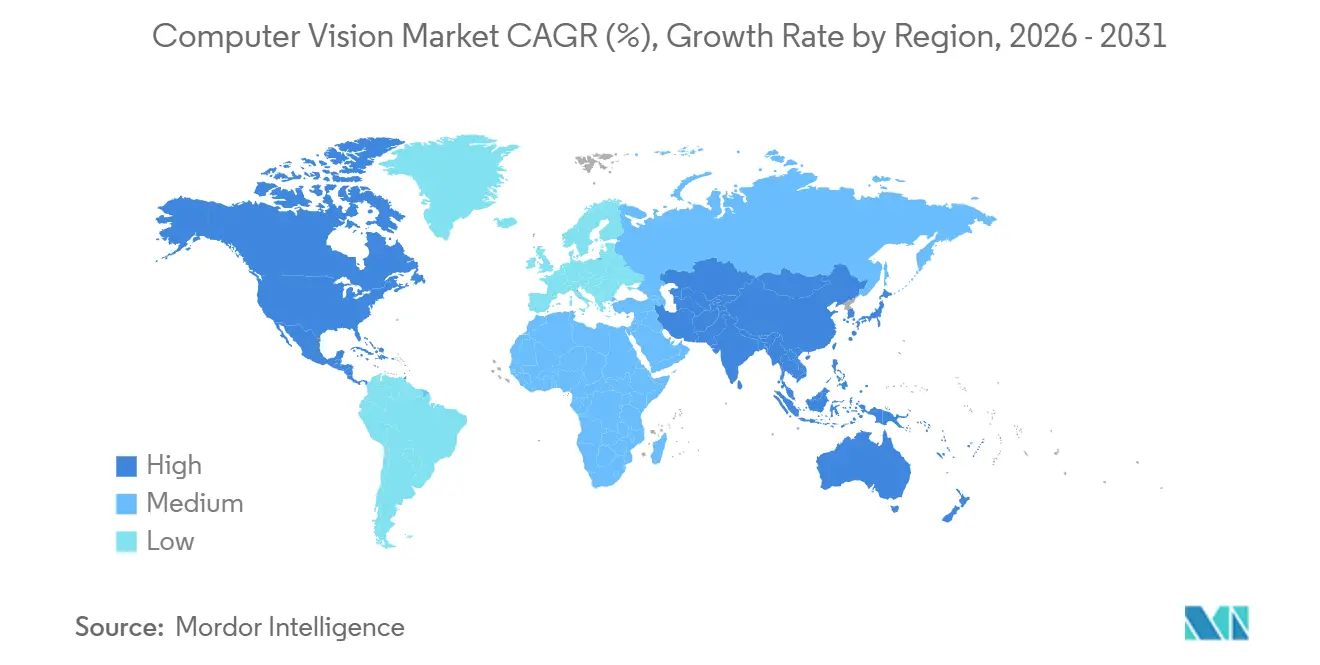
| Fastest Growing Market | Asia Pacific |
| Largest Market | North America |
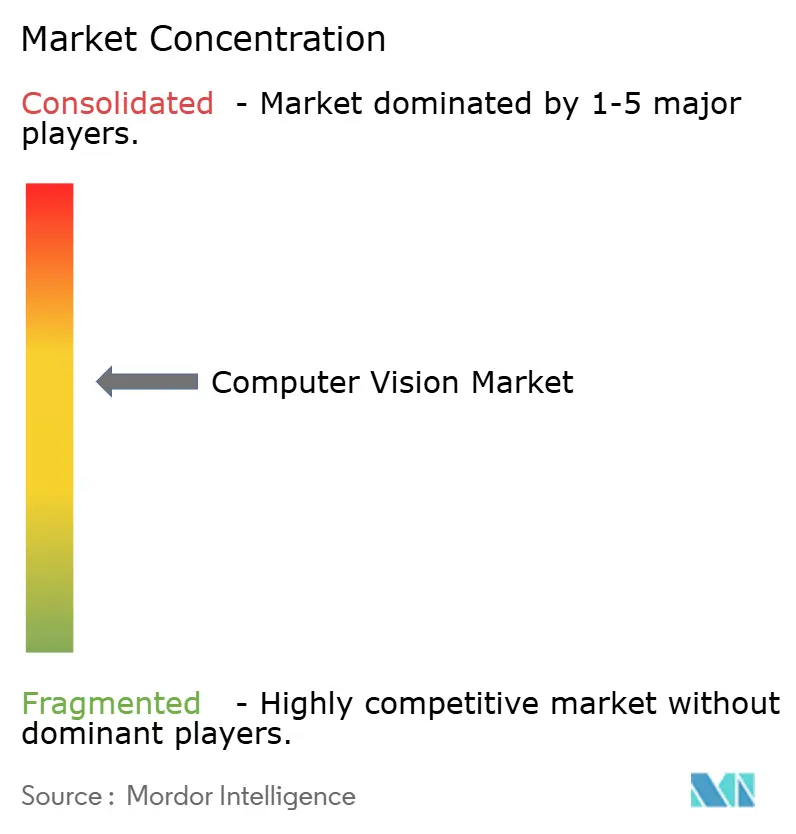
| Market Concentration | Medium |
Major Players *Disclaimer: Major Players sorted in no particular order Image © ���ϲ�����. Reuse requires attribution under CC BY 4.0. | |
Computer Vision Market Analysis by ���ϲ�����
The computer vision market size is projected to be USD 27.39 billion in 2025, USD 32.88 billion in 2026, and reach USD 68.38 billion by 2031, growing at a CAGR of 15.77% from 2026 to 2031. Edge-inference chipsets that collapse latency, regulatory mandates pushing Advanced Driver-Assistance Systems (ADAS) cameras into every new vehicle, and quality-control rules in pharmaceuticals and food have combined to anchor multi-year capital budgets around vision technologies. North American subsidies under the CHIPS and Science Act are strengthening sensor supply, while Asia-Pacific incentives are driving rapid adoption on the factory floor. Hardware still dominates revenue, yet subscription-based deep-learning software is capturing margin, and edge deployment is rising fastest as data-sovereignty laws in the EU and China limit cloud transfers. Competitive pressure intensifies as processors from AMD, Qualcomm, and Intel now embed vision accelerators, eliminating the need for discrete cards in many use cases.
Key Report Takeaways
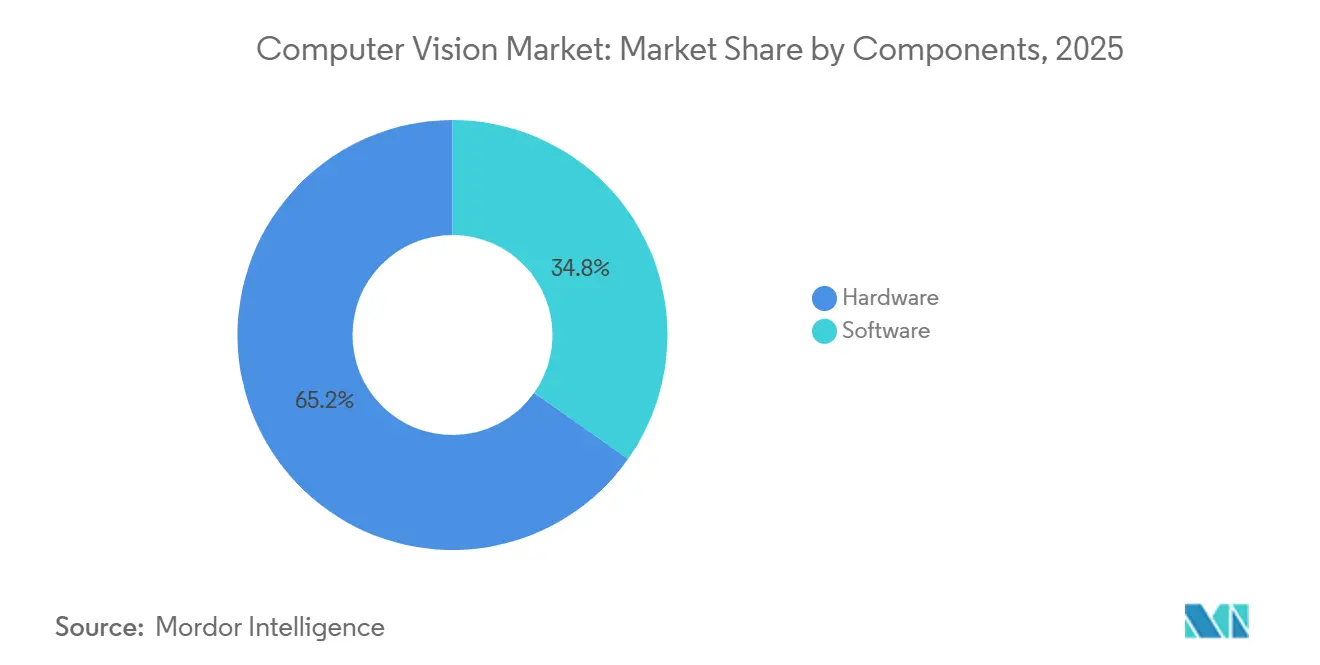
- By components, hardware accounted for 65.21% of the computer vision market share in 2025, whereas software is advancing at a 15.87% CAGR through 2031.
- By end-user industry, manufacturing led with 28.49% of the computer vision market size in 2025, but automotive is the fastest-growing segment at an 18.23% CAGR over 2026-2031.
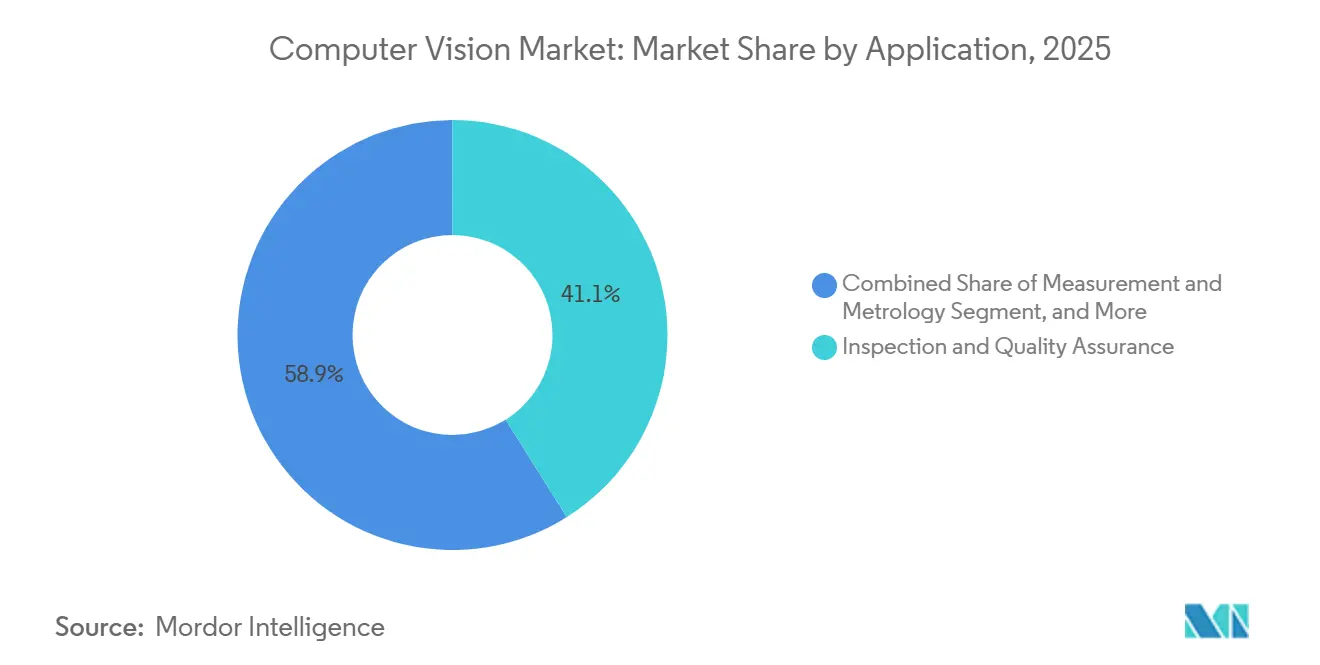
- By application, inspection and quality assurance commanded 41.08% revenue in 2025; 3D modeling and reconstruction is expanding at a 17.42% CAGR through 2031.
- By deployment, edge solutions held 47.33% share in 2025 and are growing at a 17.29% CAGR, outpacing both cloud and on-premise alternatives.
- By geography, North America contributed 49.01% of 2025 revenue, while Asia-Pacific is set to register the fastest regional CAGR of 16.39% between 2026 and 2031.
Note: Market size and forecast figures in this report are generated using ���ϲ�����’s proprietary estimation framework, updated with the latest available data and insights as of 2026.
Global Computer Vision Market Trends and Insights
Drivers Impact Analysis*
| Driver | (~) % Impact on CAGR Forecast | Geographic Relevance | Impact Timeline |
|---|---|---|---|
| Edge-AI chipsets lowering latency and power for on-device vision | +3.2% | Global, strongest in North America and Asia-Pacific | Medium term (2-4 years) |
| Surge in automotive ADAS camera integration | +4.1% | Global, led by China, the EU, and North America | Short term (≤2 years) |
| Rising adoption of vision-guided robotics in manufacturing | +2.8% | Asia-Pacific core, spill-over to North America and Europe | Medium term (2-4 years) |
| Stringent quality-control mandates across regulated industries | +2.3% | North America and the EU, expanding to Asia-Pacific pharmaceuticals | Long term (≥4 years) |
| Expansion of edge deployments driven by data-sovereignty laws | +2.4% | EU, China, Middle East | Medium term (2-4 years) |
| Integrated vision accelerators in general-purpose processors | +3.2% | Global | Short term (≤2 years) |
| Source: ���ϲ����� | |||
Edge-AI Chipsets Lowering Latency and Power for On-Device Vision
NVIDIA’s Rubin platform integrates HBM4 memory with a dedicated vision-processing unit, executing YOLOv8 at 240 frames per second while drawing under 15 watts, and therefore removes the network overhead that previously hindered cloud-dependent systems. Qualcomm’s Snapdragon X2 Plus embeds a Hexagon neural-processing unit that delivers 75 TOPS, allowing handset makers to run facial recognition without rapidly draining batteries.[1]Cristiano Amon, “Qualcomm Unveils Snapdragon X2 Plus,” qualcomm.com AMD’s Ryzen AI 400 Series accelerates convolutional models for industrial inspection, letting electronics assemblers replace programmable-logic-controller vision stacks with adaptive classifiers. Ambarella’s CV7 delivers 120 TOPS at 5 watts, giving Tier-1 automotive suppliers ISO 26262-ready compute budgets for cabin cameras. Across these families, round-trip latency has fallen from 80 milliseconds to below 10 milliseconds, the threshold needed for robotic grasping and emergency vehicle braking.[2]Robert High, “IBM Edge-AI Benchmarking,” ieee.org
Surge in Automotive ADAS Camera Integration
Tesla’s Full Self-Driving v13 uses eight surround-view cameras and a custom inference chip to execute lane changes without driver confirmation in 47 U.S. states. BYD’s Seal sedan pairs Sony sensors with Horizon Robotics silicon to deliver Level 2+ capability at price points 30% below comparable Western models, accelerating uptake in Southeast Asia. Mercedes-Benz expanded Drive Pilot to California highways, employing stereo cameras and LiDAR fusion to satisfy Level 3 certification that lets drivers avert their gaze in slow traffic. Volkswagen’s ID.7 electric vehicle uses infrared-based gaze tracking to comply with Euro NCAP’s 2025 driver-monitoring rule. Combined with Chinese and European safety mandates that make forward-collision warning compulsory by 2026, global ADAS camera shipments are expected to reach 240 million in 2026, up from 200 million in 2025.
Rising Adoption of Vision-Guided Robotics in Manufacturing
Cognex shipped more than 500,000 In-Sight 3D systems in 2025 to electronics lines that must inspect solder joints at throughputs exceeding 1,200 units per hour. Keyence’s CV-X updates cut false-positive defect rates from 8% to below 2% in automotive stamping, saving a Michigan Tier-1 supplier USD 1.2 million a year. ABB’s PickMaster Twin halves integration cycles by digitally simulating bin-picking before physical deployment. FANUC’s iRVision platform now guides more than 15,000 collaborative robots in food-packaging lines where irregular item shapes defeat fixed-motion arms. The International Federation of Robotics reported that vision-equipped robots comprised 38% of 2025 installations, up from 29% in 2023.
Stringent Quality-Control Mandates Across Regulated Industries
The FDA’s 2026 Clinical Decision Support guidance compels computer-vision suppliers to prove algorithm robustness across diverse demographics and document training-data provenance under 21 CFR Part 11. EU GMP Annex 1 obliges pharmaceutical plants to shift from statistical sampling to 100% vial inspection that detects particles under 50 microns. Food manufacturers are installing hyperspectral cameras to comply with FSMA Section 204 traceability rules taking effect in 2026, bringing contaminant detection limits down to 10 ppm for melamine in dairy. ISO 13485 certification for medical device makers drives the uptake of vision systems that log every inspection event to audit trails. Compliance investments averaging USD 800,000 per production line favor large incumbents that can amortize validation costs across multiple sites, raising barriers for smaller entrants.
Restraint Impact Analysis*
| Restraint | (~) % Impact on CAGR Forecast | Geographic Relevance | Impact Timeline |
|---|---|---|---|
| Complex system-integration requirements | –1.8% | Global, acute in fragmented SME sectors | Medium term (2-4 years) |
| Shortage of skilled computer-vision engineers | –1.4% | North America and Europe, and emerging in the Asia-Pacific | Long term (≥4 years) |
| U.S. GPU export controls are fragmenting the supply chain | –1.3% | Primarily China and U.S.-linked exporters | Short term (≤2 years) |
| Escalating data-labeling costs | –1.5% | Global, with the highest impact on early-stage adopters | Medium term (2-4 years) |
| Source: ���ϲ����� | |||
Complex System-Integration Requirements
Connecting new cameras using GigE Vision, CoaXPress, and Camera Link to programmable-logic controllers demands middleware that translates proprietary streams into OPC UA or MQTT, consuming up to 40% of project budgets and extending commissioning by three months. Enterprises juggling multi-vendor estates face firmware conflicts that inflate costs and delay ramps; a European auto supplier spent an extra USD 250,000 synchronizing Basler cameras with Cognex processors, postponing production by six weeks. Annual software-maintenance fees average 18% of license price, and recalibration labor resurfaces each time lines are re-tooled. Smaller plants lacking in-house automation talent must hire integrators who charge USD 150-300 per hour, making projects economical only for high-volume lines that exceed 500,000 units yearly. The absence of standardized benchmarks equivalent to MLPerf obliges buyers to run long proof-of-concept trials, slowing computer vision market penetration.
Shortage of Skilled Computer-Vision Engineers
LinkedIn’s 2025 Workforce Report shows demand outstripping supply by 3.2 to 1 in North America, elevating median U.S. salaries to USD 165,000.[3]LinkedIn Talent Solutions, “2025 Workforce Report,” linkedin.com Universities grant roughly 12,000 specialized degrees per year versus 38,000 openings, with edge-AI optimization skills in shortest supply. Companies respond by bidding wages 22% higher than a year earlier, lifting operating costs and elongating project schedules while new hires are onboarded. Outsourcing to India and Eastern Europe reduces salary outlay but adds time-zone friction and intellectual-property safeguards that slow iteration. Massive online courses draw record enrollments, yet 60% of graduates still need six-month residencies before delivering production code.
*Our updated forecasts treat driver/restraint impacts as directional, not additive. The revised impact forecasts reflect baseline growth, mix effects, and variable interactions.
Segment Analysis
By Components: Hardware Anchors Revenue, Software Captures Margin
Hardware delivered 65.21% of 2025 revenue as manufacturers bought high-resolution cameras, specialized processors, and controlled-illumination optics. Within this slice, Basler shipped more than 400,000 industrial cameras, Teledyne FLIR broadened its A700 thermal line, and Allied Vision released a 20.5-megapixel global-shutter unit ideal for fast conveyors. The computer vision market size for hardware is forecast to grow steadily, but the software layer is set to expand faster as enterprises transition from perpetual licenses to subscription models that bundle updates and cloud connectivity.
OpenCV 4.9, TensorFlow Lite 2.15, and commercial middleware from AWS Panorama and Azure IoT Edge simplify deployment, spurring a 15.87% CAGR for software through 2031. Enterprises value these platforms because they shorten time-to-production and lower device-side compute needs via quantization and pruning. As a result, the computer vision market increasingly rewards vendors that package turnkey inferencing stacks rather than stand-alone cameras or boards.


By End-User Industry: Manufacturing Leads, Automotive Accelerates
Manufacturing contributed 28.49% of the computer vision market share in 2025 thanks to large-scale inspection on electronics lines and food-packaging belts. Cognex, Keyence, and Omron dominate here by offering bundled optics, lighting, and software tuned for industrial conditions. Life sciences held 12% after drug makers upgraded vial inspection to meet revised Annex 1 rules, while defense and security reached 8% on the back of Teledyne FLIR sales.
Automotive, however, is charting the highest growth at an 18.23% CAGR because camera counts per vehicle continue to climb. Tesla, Mercedes-Benz, and BYD collectively added more than 200 million ADAS cameras in 2025, and Euro NCAP mandates for driver monitoring are pushing in-cabin units into mass-market models. Over the forecast horizon, plant retrofits supporting electric-vehicle production and OEM commitments to Level 3 autonomy will tilt incremental spending toward automotive, tightening competition for integration talent.
By Application: Inspection Dominates, 3D Reconstruction Surges
Inspection and quality assurance delivered 41.08% of 2025 revenue as visual defect detection outperformed manual checks in speed and repeatability. Measurement and metrology followed at 18% with laser-triangulation systems that hold ±5-micron tolerances for machined parts, vital to ISO 9001 compliance. Classification and sorting, as well as surveillance and monitoring, added scale in food, recycling, and traffic management.
3D modeling and reconstruction is the application to watch, charting a 17.42% CAGR because LiDAR-camera fusion now delivers site-scale point clouds for construction, mining, and augmented-reality retail. New neuromorphic event sensors such as Prophesee’s GenX320 capture temporal contrast events, enabling real-time 3D perception in low-light scenarios, further accelerating adoption in underground mines and drone-based inspection. The computer vision market size for 3D modeling is therefore expected to expand faster than any other application bucket through 2031.

By Deployment: Edge Dominates on Latency and Sovereignty
Edge configurations secured 47.33% revenue in 2025 as milliseconds matter for robotic grasping and autonomous driving. Jetson Orin Nano kits priced under USD 500 make inference affordable for small factories, while Siemens Industrial Edge blends local detection with cloud analytics for fleet-wide monitoring. On-premise installations, at 32%, remain preferred in defense and pharma because air-gapped networks ease compliance with ITAR and 21 CFR rules.
Cloud platforms held 21% share, down from prior years, yet they stay indispensable for training large vision transformers. Hybrid patterns are emerging where edge devices perform inference and forward anonymized metadata for centralized dashboards. ISO/IEC 27001 audit costs of about USD 150,000 per annum still skew total cost toward the edge for plants processing under 10 million images a year. Because sovereignty laws under the EU AI Act and China’s Personal Information Protection Law penalize cross-border transfers, edge growth is forecast at 17.29% CAGR, the highest among deployment types.
Geography Analysis
North America held 49.01% of 2025 revenue, buoyed by USD 52 billion in CHIPS Act incentives that expanded domestic fab capacity for vision processors. U.S. defense contracts worth USD 420 million for thermal imaging strengthened Teledyne FLIR’s pipeline, while Canadian AI hubs such as the Vector Institute partnered with auto suppliers on ADAS algorithms. Historical 2020-2025 CAGR of 13.2% is stepping up to 14.8% during 2026-2031 because FDA clarity on medical-image AI unlocks deferred hospital investment.
Asia-Pacific is the fastest-growing region, projected at a 16.39% CAGR. China alone generated 22% of global 2025 revenue, but U.S. export controls on high-end GPUs are motivating a shift toward Huawei Ascend processors. India’s Production-Linked Incentive scheme funnels USD 2 billion into electronics plants that consume vision systems for surface-mount inspection. Japan funds 340 smart-factory pilots, and South Korea invests USD 1.8 billion to commercialize mobile neuromorphic sensors. Australia and New Zealand rely on vision-guided haul trucks that raise ore-extraction rates by 30%.
Europe captured 18% share in 2025. Germany disbursed EUR 500 million for Industrie 4.0 upgrades, yet EU AI Act conformity assessments costing about EUR 300,000 per system slow smaller plants. The United Kingdom integrated 12 million ADAS cameras in 2025 production, while France applied vision inspection to turbine blades. Middle Eastern smart-city projects in Saudi Arabia and the UAE are installing multi-million-camera networks, and South American agriculture is turning to drone imaging that cuts pesticide use by 40%. Collectively, these deployments showcase a widening global foundation for the computer vision market.

Competitive Landscape
In 2025, the top five players in the computer vision market - Intel, NVIDIA, Cognex, Keyence, and Sony - collectively accounted for around 38% of the market's revenue. Processor manufacturers are now integrating neural units directly into mainstream CPUs. For instance, AMD's Ryzen AI 400 Series and Qualcomm's Snapdragon X2 Plus are achieving 50-75 TOPS per socket, posing a challenge to traditional discrete camera-processor setups. In response, vendors are tightening their vertical integration. For example, Cognex is bundling optics, computing, and application software; Basler is integrating cameras with cloud ML pipelines; and Sony is making strides with its investment in stacked event sensors tailored for wearables. Additionally, cloud giants are solidifying their grip by certifying certain camera lines exclusively for services like AWS Panorama and Google Vertex AI.
In niche markets, especially those under stringent regulations, there's a notable profitability gap. Systems cleared by the FDA for inspections and thermal imagers meeting ITAR standards boast gross margins close to 40%. In contrast, consumer products hover around 22%. This disparity is attracting private equity interest, especially towards specialized firms like Teledyne FLIR and Stemmer Imaging. Notable disruptors in the space include Prophesee, which has developed microsecond event cameras that reduce bandwidth needs by a staggering 90%. Another is Clarifai, offering a no-code platform that empowers non-engineers to craft models in mere hours. Furthermore, a 62% surge in patent filings related to event-based vision in 2025 underscores the escalating R&D investments from industry giants like Sony, Samsung, and Omnivision.
The computer vision market is also witnessing significant advancements in edge computing. Companies are increasingly deploying edge AI solutions to reduce latency and enhance real-time decision-making capabilities. This trend is particularly evident in applications such as autonomous vehicles, industrial automation, and smart surveillance systems. By processing data closer to the source, these solutions minimize reliance on cloud infrastructure, offering both cost and performance benefits. Key players like Intel and NVIDIA are actively developing edge-specific hardware and software to cater to this growing demand.
Computer Vision Industry Leaders
Intel Corporation
Cognex Corporation
Keyence Corporation
NVIDIA Corporation
Qualcomm Inc.
- *Disclaimer: Major Players sorted in no particular order

Recent Industry Developments
- March 2026: AMD introduced Ryzen AI 400 Series chips delivering 50 TOPS and landed design wins with Lenovo and HP for industrial PCs on factory floors.
- March 2026: The FDA released final Clinical Decision Support guidance clarifying validation rules for vision algorithms used on medical images.
- February 2026: Qualcomm announced Snapdragon X2 Plus with 75 TOPS for ADAS and smartphone AR, achieving sub-10 millisecond latency.
- January 2026: NVIDIA unveiled the Rubin AI platform with HBM4 and a dedicated vision unit executing YOLOv8 at 240 fps under 15 watts.


Global Computer Vision Market Report Scope
Computer vision systems are those that can see and interpret their surroundings in the same way that people do. This is achievable because of advancements in visual systems, artificial intelligence, and computational power technology. These systems' essential principles are data or image acquisition, data or image processing, and data or image classification. Emotion AI uses computer vision technology to read an individual's emotional responses by analyzing facial appearances and eye trends in images and videos.
The Computer Vision Market Report is Segmented by Components (Hardware and Software), End-User Industry (Life Sciences, Manufacturing, Automotive, Retail, Logistics, Agriculture, and More), Application (Inspection, Measurement, Classification, Surveillance, and 3D Modeling), Deployment (Edge, On-Premise, and Cloud), and Geography. The Market Forecasts are in Value (USD).
| Hardware |
| Cameras |
| Processors (GPUs / ASIC / FPGA) |
| Optics and Lighting |
| Software |
| Traditional Algorithms |
| Deep-Learning Frameworks |
| Edge Middleware |
| Life Sciences |
| Manufacturing |
| Electronics Assembly |
| Food and Beverage |
| Packaging |
| Defense and Security |
| Automotive |
| Retail and E-Commerce |
| Logistics and Warehousing |
| Agriculture and Forestry |
| Other End-User Industries |
| Inspection and Quality Assurance |
| Measurement and Metrology |
| Classification and Sorting |
| Surveillance and Monitoring |
| 3D Modeling and Reconstruction |
| Edge |
| On-Premise |
| Cloud |
| North America | United States |
| Canada | |
| Mexico | |
| South America | Brazil |
| Argentina | |
| Rest of South America | |
| Europe | Germany |
| United Kingdom | |
| France | |
| Italy | |
| Spain | |
| Rest of Europe | |
| Asia-Pacific | China |
| India | |
| Japan | |
| South Korea | |
| Australia and New Zealand | |
| Rest of Asia-Pacific | |
| Middle East | Saudi Arabia |
| United Arab Emirates | |
| Turkey | |
| Rest of Middle East | |
| Africa | South Africa |
| Nigeria | |
| Egypt | |
| Rest of Africa |
| By Components | Hardware | |
| Cameras | ||
| Processors (GPUs / ASIC / FPGA) | ||
| Optics and Lighting | ||
| Software | ||
| Traditional Algorithms | ||
| Deep-Learning Frameworks | ||
| Edge Middleware | ||
| By End-User Industry | Life Sciences | |
| Manufacturing | ||
| Electronics Assembly | ||
| Food and Beverage | ||
| Packaging | ||
| Defense and Security | ||
| Automotive | ||
| Retail and E-Commerce | ||
| Logistics and Warehousing | ||
| Agriculture and Forestry | ||
| Other End-User Industries | ||
| By Application | Inspection and Quality Assurance | |
| Measurement and Metrology | ||
| Classification and Sorting | ||
| Surveillance and Monitoring | ||
| 3D Modeling and Reconstruction | ||
| By Deployment | Edge | |
| On-Premise | ||
| Cloud | ||
| By Geography | North America | United States |
| Canada | ||
| Mexico | ||
| South America | Brazil | |
| Argentina | ||
| Rest of South America | ||
| Europe | Germany | |
| United Kingdom | ||
| France | ||
| Italy | ||
| Spain | ||
| Rest of Europe | ||
| Asia-Pacific | China | |
| India | ||
| Japan | ||
| South Korea | ||
| Australia and New Zealand | ||
| Rest of Asia-Pacific | ||
| Middle East | Saudi Arabia | |
| United Arab Emirates | ||
| Turkey | ||
| Rest of Middle East | ||
| Africa | South Africa | |
| Nigeria | ||
| Egypt | ||
| Rest of Africa | ||


Key Questions Answered in the Report
How large will the computer vision market be by 2031?
It is forecast to reach USD 68.38 billion by 2031, expanding at a 15.77% CAGR from 2026 to 2031.
Which segment is growing fastest inside the computer vision space?
Automotive applications are projected to rise at an 18.23% CAGR through 2031 because camera counts per vehicle continue to climb.
Why are edge deployments outpacing cloud usage?
Millisecond latency requirements and data-sovereignty regulations in the EU and China favor running inference on local devices rather than sending images to remote servers.
Which region will add the most new revenue?
Asia-Pacific is expected to log a 16.39% CAGR, driven by Chinese industrial policy and Indian electronics incentives.
What is the main restraint limiting adoption?
A global shortage of skilled computer-vision engineers keeps project timelines long and implementation costs high.
Page last updated on:


