Catalyst Fertilizers Market Size and Share
Market Overview
| Study Period | 2020 - 2030 |
|---|---|
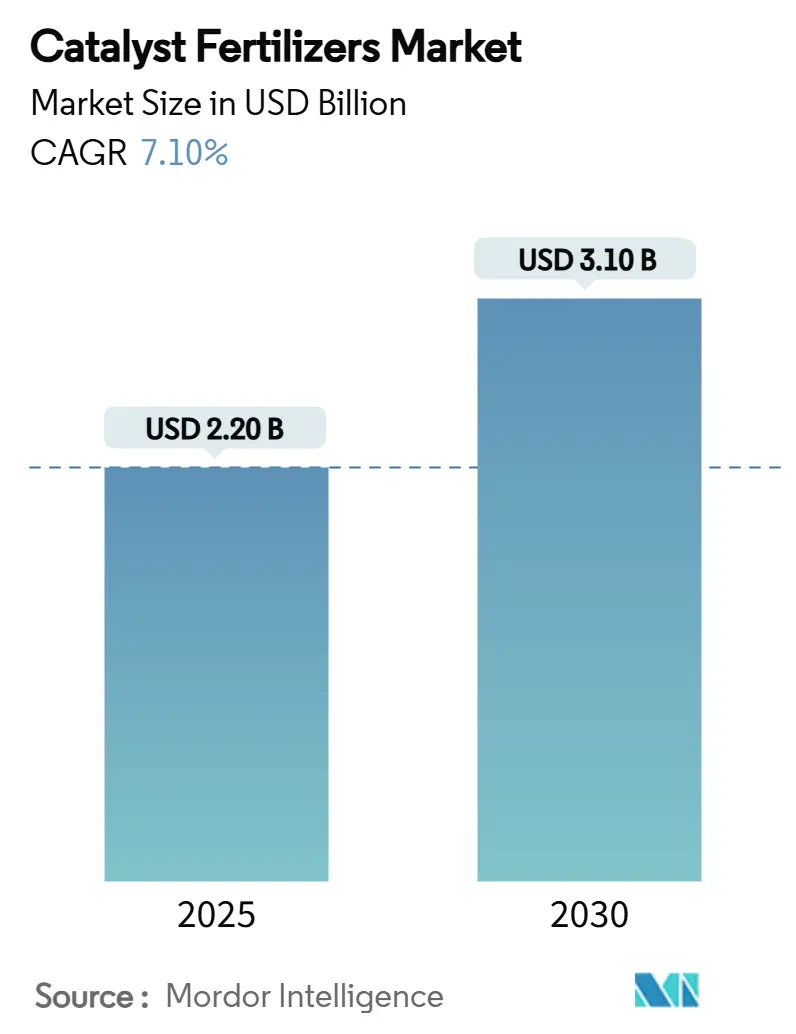
| Market Size (2025) | USD 2.20 Billion |
| Market Size (2030) | USD 3.10 Billion |
| Growth Rate (2025 - 2030) | 7.10% CAGR |
| Fastest Growing Market | Middle East |
| Largest Market | Asia Pacific |
| Market Concentration | Medium |
Major Players *Disclaimer: Major Players sorted in no particular order Image © ���ϲ�����. Reuse requires attribution under CC BY 4.0. | |
Catalyst Fertilizers Market Analysis by ���ϲ�����
The catalyst fertilizers market size is valued at USD 2.2 billion in 2025 and is projected to reach USD 3.1 billion by 2030, delivering a 7.10% CAGR over the forecast period. Momentum stems from the commercial deployment of iron oxide-promoted Haber-Bosch catalysts that trim energy consumption, the build-out of green ammonia plants across the Asia-Pacific, and tightening nitrous-oxide caps that accelerate retrofit activity. Competitive intensity remains moderate because the top five companies hold a significant market share of the catalyst fertilizer market, but still clear avenues for newcomers that can localize production. Western Asia is poised for outsized gains as natural gas-rich countries position themselves as hydrogen and ammonia export hubs, while Africa offers a long runway for adoption once technical assistance and financing barriers are addressed. Meanwhile, price swings, especially for vanadium pentoxide, inject procurement risk that favors manufacturers able to hedge or substitute with iron-based formulations.
Key Report Takeaways
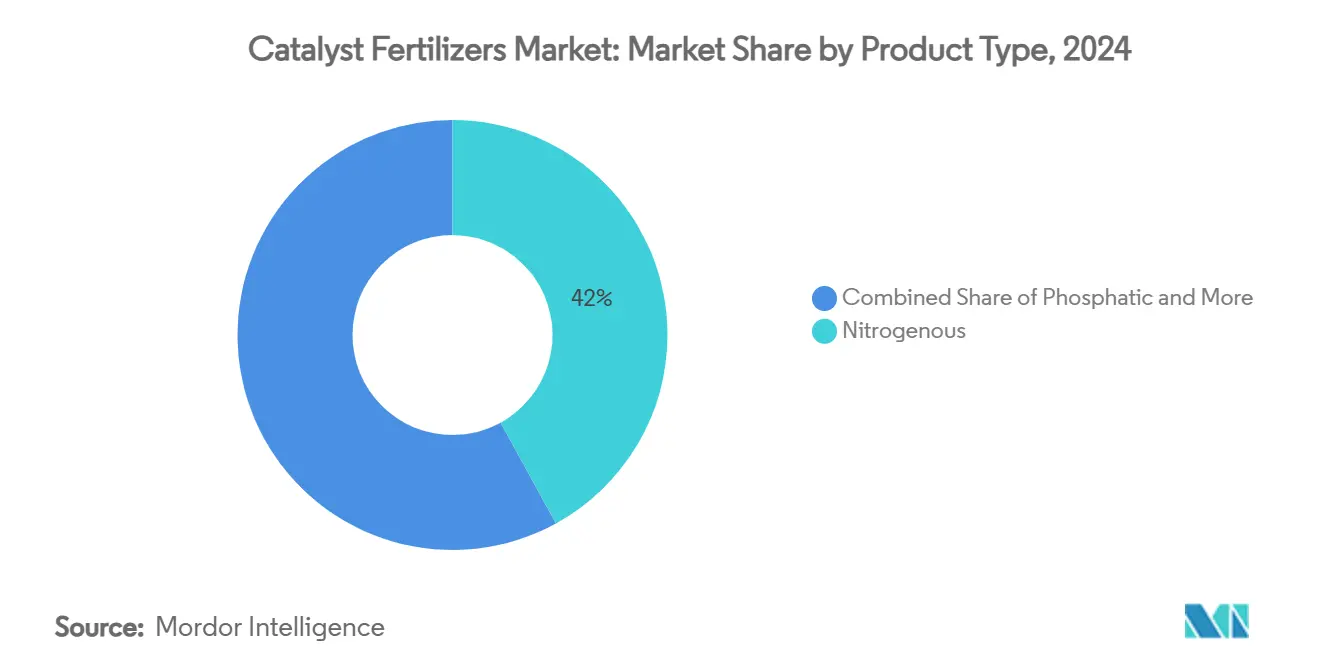
- By product type, nitrogenous catalyst fertilizers led with 42% of the catalyst fertilizers market share in 2024, and potassic catalyst fertilizers are forecast to expand at a 13.9% CAGR through 2030.
- By catalyst type, iron-based catalysts commanded 55% of the catalyst fertilizers market size in 2024, and copper-based catalysts are projected to post the fastest 12.4% CAGR to 2030.
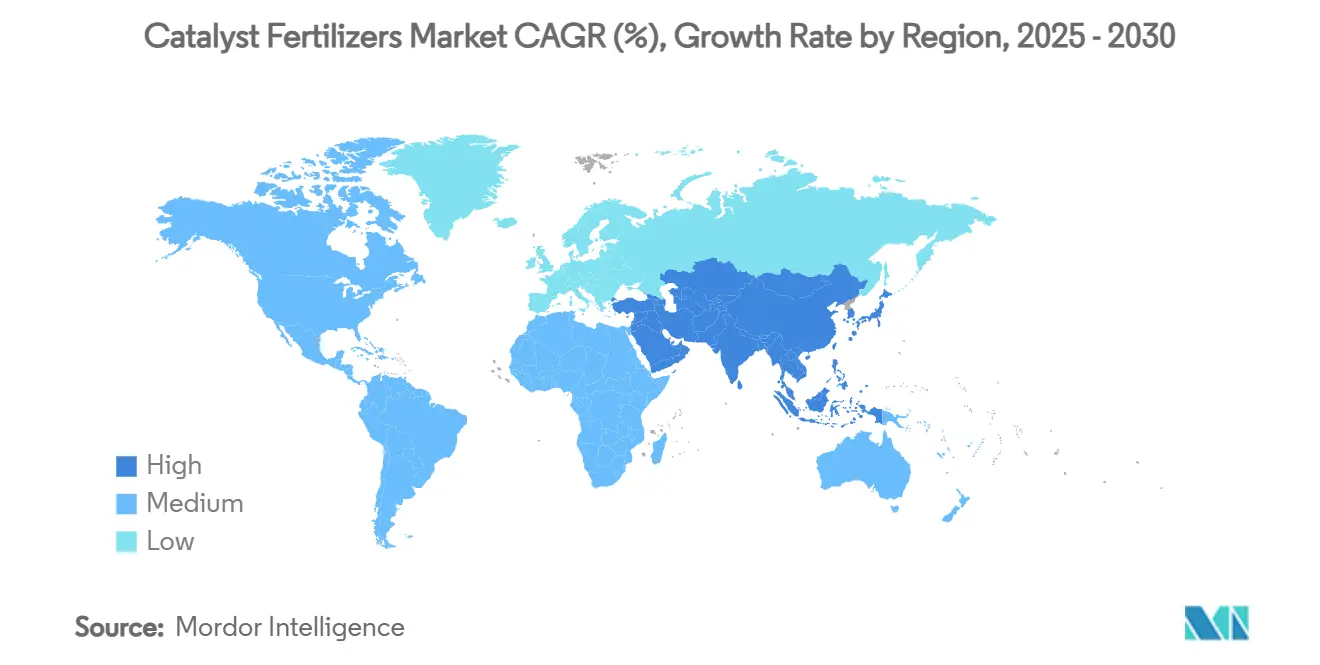
- By geography, Asia-Pacific held 46% of the catalyst fertilizers market size in 2024, and the Middle East is set to record a 14.2% CAGR over the same horizon.
- Johnson Matthey Plc, BASF SE, Haldor Topsoe A/S, Clariant AG, and Honeywell International Inc. jointly captured 39% of 2024 revenue.
Global Catalyst Fertilizers Market Trends and Insights
Drivers Impact Analysis
| Driver | (~) % Impact on CAGR Forecast | Geographic Relevance | Impact Timeline |
|---|---|---|---|
| Iron-oxide Haber-Bosch catalysts slash energy use | +2.1% | Global (early uptake in Asia-Pacific and Europe) | Medium term (2-4 years) |
| Stringent N₂O caps for nitric-acid plants | +1.8% | North America and Europe | Short term (≤2 years) |
| Green-ammonia build-outs in Asia-Pacific | +2.3% | China, India, Australia, and the Middle East | Long term (≥4 years) |
| Precious-metal catalyst leasing and recycling | +1.2% | Global (strongest in developed markets) | Medium term (2-4 years) |
| Nano-structured copper catalysts for low-pressure processes | +0.9% | Global (higher traction in sulfuric-acid clusters) | Medium term (2-4 years) |
| Carbon-credit-linked catalyst replacement cycles | +0.7% | Europe and North America (expanding to Asia) | Long term (≥4 years) |
| Source: ���ϲ����� | |||
Iron-oxide Haber-Bosch catalysts slash energy use
Commercial-grade wustite catalysts now deliver roughly 30% energy savings compared with legacy magnetite systems, enabling operators to cut both operating temperature and pressure without sacrificing throughput. Lower firing conditions reduce thermal stress on reactor internals and unlock longer campaign times, which in turn translate to fewer unplanned shutdowns. This technology dovetails with decarbonization mandates because ammonia synthesis currently consumes around 2-3% of the global energy supply. Early full-scale retrofits in China and Germany show payback periods below three years, even before factoring in carbon levies. Portfolio leaders have already secured multi-year supply contracts, creating a first-mover edge that could solidify market leadership through 2030.
Stringent N₂O caps for nitric-acid plants
The European Union’s Emissions Trading System and updated U.S. Environmental Protection Agency (EPA) guidelines classify nitrous oxide as a high-impact greenhouse gas[1]Source: European Commission, “Reference Document on Best Available Techniques for Ammonia, Acids and Fertilisers,” europa.eu, compelling producers to install secondary and tertiary abatement systems anchored by robust decomposition catalysts. Selective catalytic reduction and direct decomposition technologies deliver up to 99% destruction efficiency while maintaining plant uptime. Capital grants and free allowances soften the cost burden, but retrofit timelines remain tight, creating a spike in short-cycle demand through 2027. Suppliers with modular reactor designs that minimize downtime during installation are projected to gain share, especially in plants older than 25 years that cannot justify new-build economics.
Green-ammonia build-outs in Asia-Pacific
Gigawatt-scale renewable ammonia complexes in Inner Mongolia, Gujarat, and the Arabian Gulf rely on catalysts optimized for intermittent electrolytic hydrogen feed[2]Source: International Energy Agency, “Global Hydrogen Review 2024,” iea.org. Load-following capability, rapid heat-up, and tolerance to fluctuating H₂ purity become decisive specifications. Governments are backing these installations through tax holidays and subsidized power tariffs, ensuring bankable offtake agreements for green ammonia exports. As electrolyzer stacks ramp up, developers place advanced catalyst orders to lock in pricing and guarantee delivery slots.
Precious-metal catalyst leasing and recycling
Leasing models pioneered by Johnson Matthey Plc and BASF SE allow fertilizer producers to pay only for catalytic activity while the OEM retains title to platinum-group metals, recovers them at end-of-life, and reintroduces them into fresh charges. The circular loop lowers working-capital requirements by up to 80% and cuts embedded carbon by almost 98% compared with virgin mining. As the International Council on Mining and Metals forecasts a tightened primary metal supply, leasing becomes a hedge against price spikes and strengthens companies' client stickiness, effectively raising switching costs.
Restraints Impact Analysis
| Restraint | (~) % Impact on CAGR Forecast | Geographic Relevance | Impact Timeline |
|---|---|---|---|
| Vanadium pentoxide price volatility | -1.4% | Global (contact process operators hit hardest) | Short term (≤2 years) |
| Limited awareness among African mid-size urea plants | -0.8% | Sub-Saharan Africa | Medium term (2-4 years) |
| Phytotoxicity fears over trace-metal leaching | -0.6% | Global (regulatory focus in OECD markets) | Long term (≥4 years) |
| Ambiguity in nano-porous carrier classification | -0.4% | Europe and North America (gradually extending to Asia) | Medium term (2-4 years) |
| Source: ���ϲ����� | |||
Vanadium pentoxide price volatility
Spot prices oscillated between USD 5.30 and USD 5.60 per pound during 2024, driven by mining disruptions in South Africa and export quota shifts in China[3]Source: USGS National Minerals Information Center, “Vanadium in June 2024,” usgs.gov. ���ϲ����� process operators struggle to lock in long-term supply, leading some to trial iron-oxide substitutes. Yet iron-oxide alternatives still trail vanadium in conversion efficiency, so wholesale switches remain limited. Producers hedge with multi-year offtake contracts, but financial charges inflate operating costs, trimming margins and delaying discretionary capacity expansions.
Limited awareness among African mid-size urea plants
Fertilizer facilities in Nigeria, Kenya, and Tanzania operate largely on antiquated technology and limited technical staffing. Catalyst health monitoring is sporadic, leading to extended change-out intervals and diminished plant efficiency. Multilateral development banks fund upgrade programs, but uptake is slow because management teams prioritize immediate output over long-term savings. Technical workshops sponsored by the European manufacturers aim to bridge the capability gap, yet financing hurdles persist, dampening near-term catalyst penetration.
Segment Analysis
By Product Type: Nitrogenous Strength, Potassic Upswing
Nitrogenous formulations controlled 42% of the catalyst fertilizers market share in 2024 on the back of ubiquitous ammonia-based inputs across row crops and cereals. The segment benefits from ongoing retrofits that replace magnetite with high-activity wustite catalysts, unlocking 9% lower natural-gas burn per tonne of NH₃ produced. Precision farming in North America and Europe now tailors nitrogen applications to soil sensors, but absolute tonnage remains elevated in Asia-Pacific due to staple grain demand.
Potassic formulations show the highest expansion potential, advancing at a 13.9% CAGR as evidence mounts on potassium’s role in drought tolerance and water-use efficiency. Brazil’s soybean corridor and India’s horticulture clusters adopt balanced N-P-K regimes, sparking incremental demand for catalysts that enhance potassium chloride conversion and granulation yields. Phosphatic and complex blends maintain steady growth, aided by research demonstrating iron-oxide nanoparticles’ ability to unlock bound phosphorus in ferric soils, thereby informing new catalyst recipes that improve nutrient release kinetics.
Note: Segment shares of all individual segments available upon report purchase
By Catalyst Type: Iron-Based Hegemony, Copper Surge
Iron-based catalysts represented 55% of the catalyst fertilizers market size in 2024, buoyed by decades of field data, broad process licensing, and the recent upgrade cycle toward iron-oxide promoted variants. Companies package these catalysts with proprietary conditioners that curb sintering, extending life by up to 20 months. Vanadium-based products keep a foothold in contact processes despite cost headwinds, while zinc formulations carve a niche use in methanol-to-urea integration lines. Copper-based catalysts clock the fastest 12.4% CAGR because nano-structured designs now rival vanadium in conversion under lower pressure, enabling retrofits without expensive alloy upgrades to reactor shells.
Manufacturers leverage surfactant-assisted synthesis to create uniform copper-ceria lattices with superior oxygen storage, a critical parameter for SO₂ oxidation stability. Platinum-group metal (PGM) catalysts remain a premium choice for tailor-made loop packs, but their adoption hinges on leasing models that temper capital outlay.
Geography Analysis
Asia-Pacific generated 46% of the catalyst fertilizer market share in 2024 and is projected to grow at a CAGR of 4.5%, anchored by China’s and India’s capacity expansions and policy support for decarbonized fertilizer chains. Major state-backed complexes lock in multi-year offtake to domestic agriculture co-operatives, underpinning steady catalyst pull-through.
The Middle East accounted for about 24% of the catalyst fertilizer market share in 2025, and is projected to grow at a CAGR of 14.2% CAGR on the strength of abundant natural gas and sovereign ambitions to become an ammonia export hub to Europe and East Asia. Mega-projects in Saudi Arabia bundle carbon capture with blue ammonia output, setting the stage for bulk catalyst orders that match world-scale reactors.
Europe and North America, though mature, sustain high replacement rates because stringent emission rules compress catalyst life cycles and mandate cutting-edge N₂O abatement technologies. South America’s agricultural boom boosts demand for potassic catalysts, yet currency volatility occasionally delays procurement decisions. Africa remains under-penetrated: Egypt runs modern plants, but sub-Saharan nations still operate legacy units with limited automation, explaining the lower catalyst intensity per tonne of ammonia. Multilateral financing coupled with technical-assistance grants could unlock latent demand, particularly in Nigeria’s urea corridor and Ethiopia’s emerging phosphate assets.
Competitive Landscape
The catalyst fertilizers market hosts a balanced roster of multinational companies, regional specialists, and process licensors. Haldor Topsoe A/S, BASF SE, Johnson Matthey Plc, Clariant AG, and Honeywell International Inc. together control a 39% share of global sales in 2024, giving the space a moderate concentration profile. Portfolio breadth matters; leading players supply iron, copper, vanadium, and PGM lines plus related process technologies. This one-stop approach secures bundle contracts and allows cross-selling of analytic services, thereby raising switching costs. Meanwhile, Asian entrants such as Jiangsu Jingjiang Catalyst Co., Ltd. and SYAMCAT leverage cost-efficient manufacturing to win import-substitution tenders, especially in China and Southeast Asia. Their advance have prompted incumbents to localize finishing steps or form joint ventures to comply with procurement preferences.
Technology differentiation, not price alone, drives competitive edge. Patents on crystal-structure tuning, sintering inhibitors, and in-situ regeneration dominate recent filings in the European Patent Office. Topsoe’s SynCOR Ammonia technology integrates high-activity catalysts with single-reformer architecture, lowering steam-to-carbon ratios and shrinking footprint, a decisive factor for modular green-ammonia plants. Johnson Matthey Plc couples catalyst leasing with end-of-life recycling, capturing PGM (Platinum Group Metals) value, and enabling circular-economy narratives that resonate with ESG-focused financiers. BASF channels decades of process data into digital twins that predict deactivation via machine learning, offering predictive-maintenance subscriptions as a service extension.
Strategic moves in 2024-2025 underline the pivot toward sustainable fuels. Honeywell UOP and Johnson Matthey Plc signed a memorandum to integrate syngas generation, catalyst trains, and fuel upgrading, targeting aviation-grade e-methanol. BASF reorganized its catalysts division under Performance Chemicals to align with downstream customer interfaces and simplify portfolio steering. Topsoe secured DKK 88.8 million (USD 13.2 million) from Denmark’s Business Development Board to scale SOEC (Solid Oxide Electrolyzer Cell) electrolyzers that will feed green-ammonia loops, effectively guaranteeing an internal customer for its catalysts. Across the board, R and D intensity hovers near 6% of sales, but leaders allocate up to 9% to accelerate breakthroughs that can shorten reaction pathways or enable lower-temperature kinetics.
Catalyst Fertilizers Industry Leaders
Haldor Topsoe A/S
Johnson Matthey Plc
BASF SE
Clariant AG
Honeywell International Inc.
- *Disclaimer: Major Players sorted in no particular order
Recent Industry Developments
- January 2025: BASF SE moved its chemical and refining catalysts from Surface Technologies to its Performance Chemicals division within Industrial Solutions. This reorganization is projected to enhance strategic investment and customer service around catalysts used in fertilizer production, particularly sulfuric acid and ammonia processes.
- December 2024: Clariant AG's EnviCat N₂O‑S catalyst was deployed at Sichuan Lutianhua’s nitric acid plant, cutting N₂O emissions by 95% equal to 275,000 tons of CO₂ annually, boosting demand for low-emission nitric acid catalysts in fertilizer production.
- May 2024: Johnson Matthey Plc and thyssenkrupp Uhde GmbH signed an R&D collaboration to offer fully integrated low‑carbon (blue) ammonia technology, combining JM’s LCH hydrogen reforming catalysts with Uhde’s ammonia process, enabling up to 99% CO₂ capture.
- January 2024: RIKEN developed a nanoscale molybdenum catalyst enabling ammonia synthesis at lower temperatures and pressures, potentially transforming catalyst demand by reducing energy use in nitrogen fertilizer manufacturing.
Global Catalyst Fertilizers Market Report Scope
| Nitrogenous |
| Phosphatic |
| Potassic |
| Complex |
| Iron-based Catalysts |
| Vanadium-based Catalysts |
| Zinc-based Catalysts |
| Copper-based Catalysts |
| Others (Nickel, Platinum and More) |
| North America | United States |
| Canada | |
| Mexico | |
| Rest of North America | |
| South America | Brazil |
| Argentina | |
| Rest of South America | |
| Europe | Germany |
| France | |
| Spain | |
| Russia | |
| Rest of Europe | |
| Asia-Pacific | China |
| India | |
| Japan | |
| Rest of Asia-Pacific | |
| Middle East | Saudi Arabia |
| Turkey | |
| Rest of Middle East | |
| Africa | South Africa |
| Egypt | |
| Rest of Africa |
| By Product Type | Nitrogenous | |
| Phosphatic | ||
| Potassic | ||
| Complex | ||
| By Catalyst Type | Iron-based Catalysts | |
| Vanadium-based Catalysts | ||
| Zinc-based Catalysts | ||
| Copper-based Catalysts | ||
| Others (Nickel, Platinum and More) | ||
| By Geography | North America | United States |
| Canada | ||
| Mexico | ||
| Rest of North America | ||
| South America | Brazil | |
| Argentina | ||
| Rest of South America | ||
| Europe | Germany | |
| France | ||
| Spain | ||
| Russia | ||
| Rest of Europe | ||
| Asia-Pacific | China | |
| India | ||
| Japan | ||
| Rest of Asia-Pacific | ||
| Middle East | Saudi Arabia | |
| Turkey | ||
| Rest of Middle East | ||
| Africa | South Africa | |
| Egypt | ||
| Rest of Africa | ||
Key Questions Answered in the Report
What is the current value of the catalyst fertilizers market?
The catalyst fertilizers market size stands at USD 2.2 billion in 2025 and is forecast to hit USD 3.1 billion by 2030.
Which region leads global demand for catalyst fertilizers?
Asia-Pacific holds 46% of global revenue in 2024, driven by large-scale green-ammonia projects and robust agricultural demand.
Which product type segment is expanding the fastest?
Potassic catalyst fertilizers are projected to grow at a 13.9% CAGR from 2025 to 2030, the fastest among all product categories.
What role do leasing models play in the catalyst fertilizers industry?
Precious-metal catalyst leasing reduces upfront capital by up to 80% and underpins a +1.2 percentage-point boost in market CAGR by making high-performance formulations more affordable.


