Artificial Intelligence (AI) In Pharmaceutical Market Size and Share
Market Overview
| Study Period | 2020 - 2031 |
|---|---|
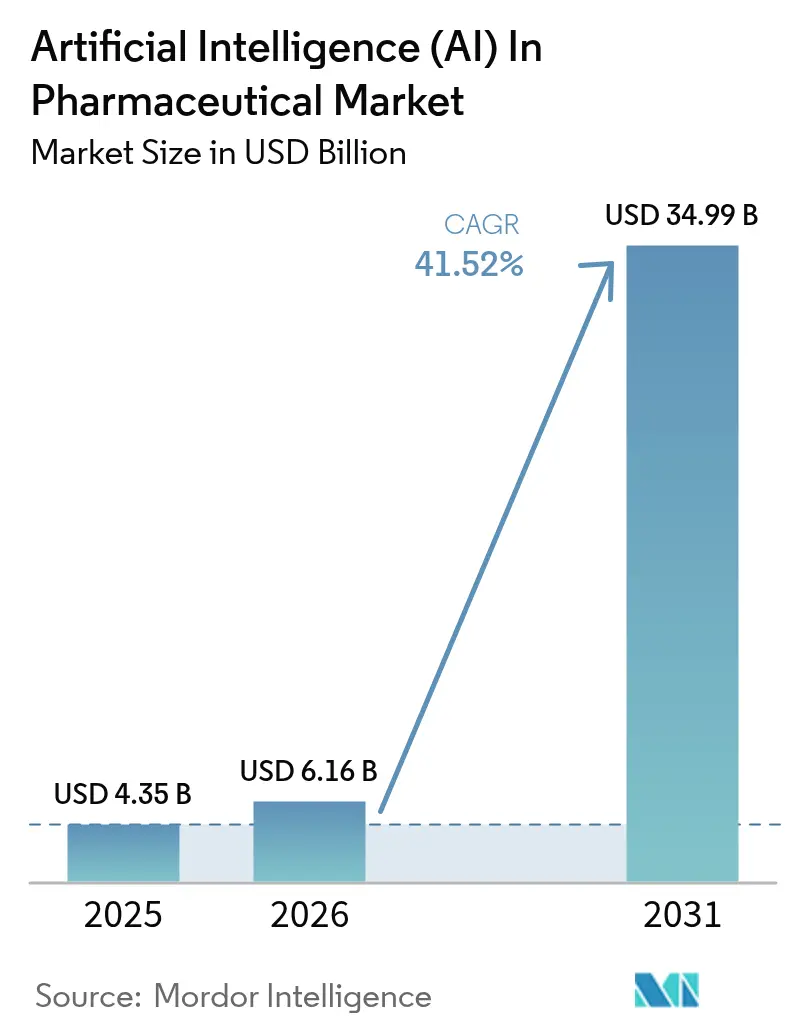
| Market Size (2026) | USD 6.16 Billion |
| Market Size (2031) | USD 34.99 Billion |
| Growth Rate (2026 - 2031) | 41.52% CAGR |
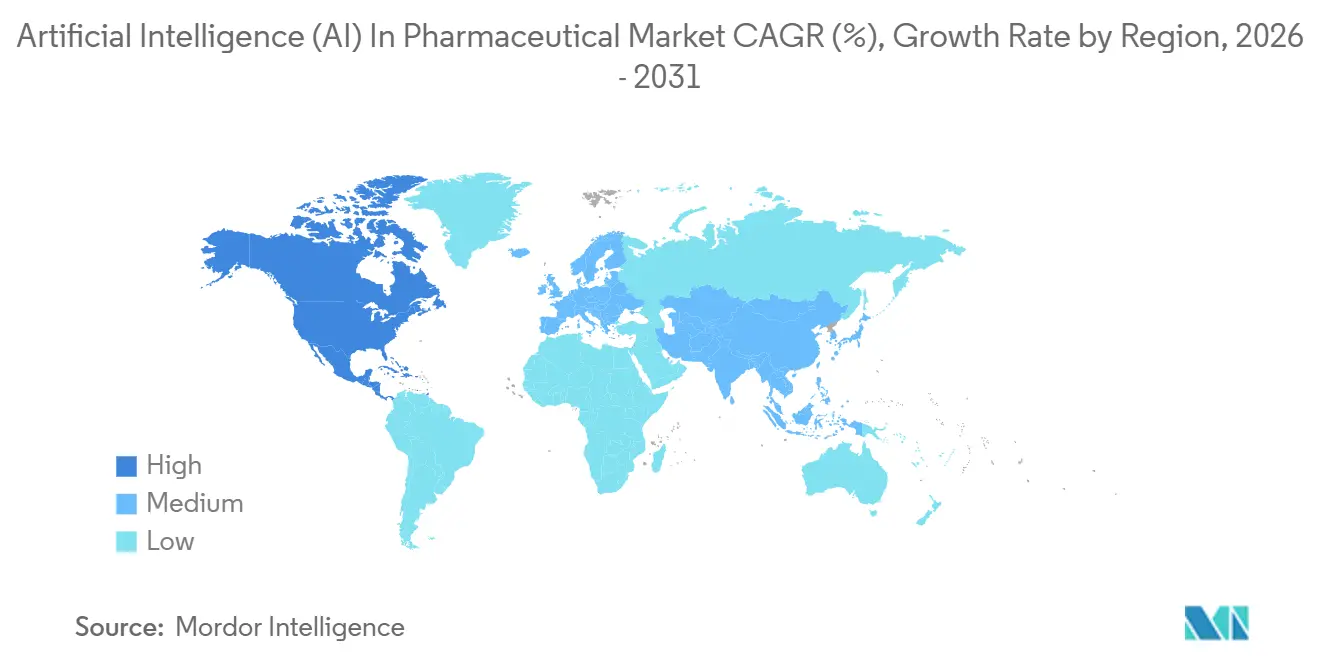
| Fastest Growing Market | Asia-Pacific |
| Largest Market | North America |
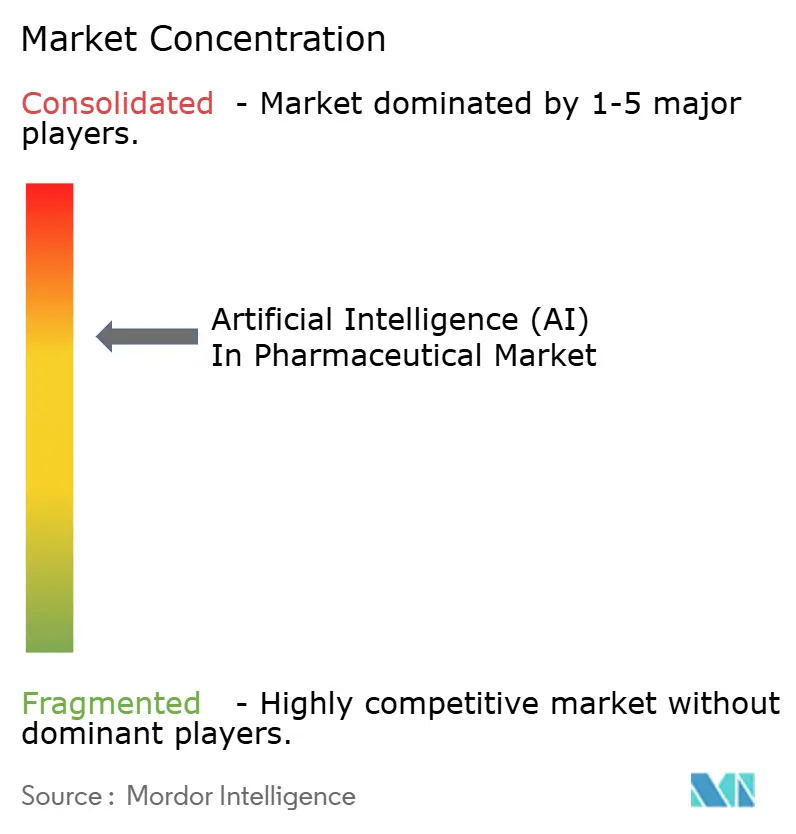
| Market Concentration | Medium |
Major Players *Disclaimer: Major Players sorted in no particular order Image © ���ϲ�����. Reuse requires attribution under CC BY 4.0. | |
Artificial Intelligence (AI) In Pharmaceutical Market Analysis by ���ϲ�����
The Artificial Intelligence In Pharmaceutical Market size is projected to be USD 4.35 billion in 2025, USD 6.16 billion in 2026, and reach USD 34.99 billion by 2031, growing at a CAGR of 41.52% from 2026 to 2031.
Venture funding, regulatory endorsements, and rapid advances in generative protein-folding models are redirecting R&D capital toward data-centric platforms instead of incremental chemistry tweaks. Adaptive-trial algorithms already cut enrollment timelines by roughly 40%, while pharmacovigilance engines mine electronic health records in near real time to meet post-market surveillance mandates. In December 2025 the FDA qualified AIM-NASH, its first machine-learning biomarker, confirming an agency shift from cautious observation to active endorsement of algorithmic drug-development tools. Simultaneously, capital markets rewarded newcomers such as Xaira Therapeutics and Isomorphic Labs with billion-dollar rounds, signaling investor belief that AI-first pipelines will outpace traditional wet-lab approaches.
Key Report Takeaways
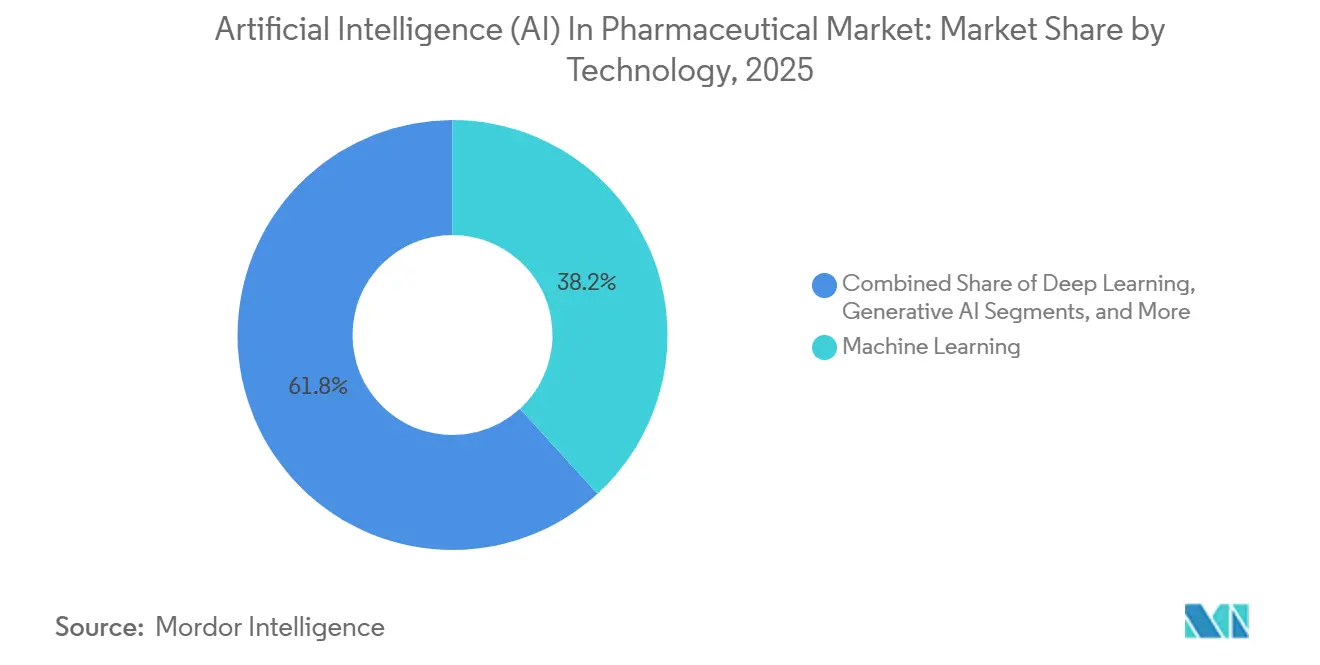
- By technology, machine learning led with 38.21% of artificial intelligence (AI) in pharmaceutical market in 2025; generative AI is set to expand at a 42.31% CAGR through 2031.
- By 2025, software platforms will account for 45.32% of the artificial intelligence (AI) in pharmaceutical market, while AI-as-a-Service is advancing at a 43.78% CAGR.
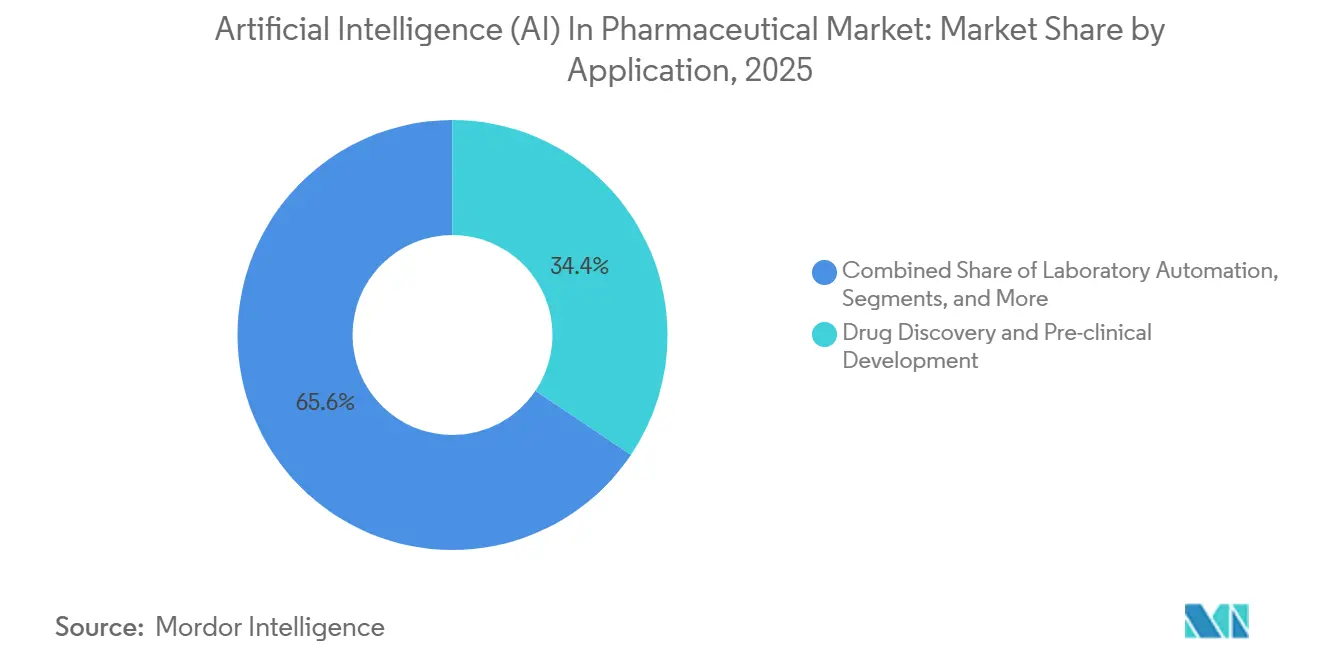
- By application, drug discovery and pre-clinical development held 34.42% of the artificial intelligence (AI) in pharmaceutical market in 2025; pharmacovigilance and safety monitoring is progressing at a 43.65% CAGR.
- By deployment mode, cloud implementations accounted for 67.72% of the artificial intelligence (AI) in pharmaceutical market in 2025, whereas on-premises and hybrid solutions are forecast to grow at a 42.76% CAGR.
- By geography, North America maintained a 41.52% share of the artificial intelligence (AI) in pharmaceutical market in 2025, while Asia-Pacific is the fastest-growing region at a 42.54% CAGR.
Note: Market size and forecast figures in this report are generated using ���ϲ�����’s proprietary estimation framework, updated with the latest available data and insights as of 2026.
Global Artificial Intelligence (AI) In Pharmaceutical Market Trends and Insights
Driver Impact Analysis*
| Driver | (~) % Impact on CAGR Forecast | Geographic Relevance | Impact Timeline |
|---|---|---|---|
| Proliferation of Cross-Industry Collaborations and Partnerships | +6.5% | Global, concentrated in North America and Europe | Medium term (2-4 years) |
| Escalating Pressure to Reduce Drug-Discovery Costs and Timelines | +8.0% | Global, particularly acute in North America and Asia-Pacific | Short term (≤ 2 years) |
| Accelerated Adoption of AI-Driven Adaptive Clinical-Trial Designs | +5.5% | North America and Europe, with spillover to Asia-Pacific | Medium term (2-4 years) |
| Maturation of Generative AI Foundation Models for Protein Folding | +7.0% | Global, led by North America and China | Long term (≥ 4 years) |
| Emergence of Quantum-Enhanced Computing for Molecular Simulation | +4.0% | Global, early pilots in North America and Europe | Long term (≥ 4 years) |
| Expansion of Regulatory AI Sandboxes Facilitating Algorithmic Trial Design | +3.0% | North America, Europe, Japan, and Australia | Short–Medium term (≤ 4 years) |
| Source: ���ϲ����� | |||
Proliferation of Cross-Industry Collaborations and Partnerships
Pharmaceutical incumbents increasingly fuse their regulatory expertise with startups’ algorithmic speed. PostEra’s USD 610 million expansion deal with Pfizer in 2024 targets synthesis-planning models that chart low-cost routes for oncology molecules. The 2024 all-stock merger of Recursion and Exscientia created a 10-asset clinical pipeline underpinned by a 23-trillion-observation data lake, demonstrating data-aggregation advantages at scale. Insilico Medicine’s USD 120 million pact with Qilu Pharmaceutical shows how cross-border alliances secure patient access and manufacturing capacity in Asia. Such risk-sharing models link milestone payments to clinical outcomes, lowering Big Pharma's upfront R&D exposure while granting AI vendors upside participation. The FDA’s January 2025 draft guidance explicitly endorses joint development agreements, clarifying data-sharing and liability rules that once hindered collaboration.
Escalating Pressure to Reduce Drug-Discovery Costs and Timelines
Average out-of-pocket R&D spend per approved asset reached USD 2.6 billion, with cycle times stretching 10-15 years, eroding enterprise returns. AI pipelines automate hit identification, lead optimization, and toxicity prediction, trimming both cost and duration by roughly one-third. Insilico Medicine’s fibrosis candidate ISM001-055 progressed from target discovery to Phase IIa proof-of-concept in 30 months, underscoring efficiency gains[1]Nature Biotechnology Editors, “AI speeds fibrosis candidate to clinic,” Nature.com. The FDA deployed an internal agentic AI in December 2025 that cut investigational new drug review times by 22% in early pilots. While a single generative-chemistry model can cost USD 5 million in compute, BCG estimates 40% lower per-program expenses and 30% shorter timelines once platforms reach scale.
Accelerated Adoption of AI-Driven Adaptive Clinical-Trial Designs
Adaptive trials dynamically refine protocols using interim data. The FDA’s May 2025 pilot used natural-language processing to analyze 12,000 pages of study reports in hours, demonstrating real-world efficiency. The MHRA’s AI Airlock Sandbox granted accelerated review to sponsors deploying explainable algorithms, trimming U.K. approval cycles by seven months. A 2025 JAMA oncology study reported machine-learning screening cut screen-failure rates from 45% to 18%, saving USD 8 million per program. FDA’s January 2026 “Guiding Principles of Good AI Practice” codified validation, bias auditing, and post-market monitoring, assuring sponsors that adaptive designs will meet regulatory muster. As clarity rises, sponsors allocate larger budgets to real-time enrollment platforms that compress time-to-market.
Maturation of Generative AI Foundation Models for Protein Folding
AlphaFold 3, released in 2024, predicts structures of protein–ligand and protein–nucleic-acid complexes with sub-angstrom fidelity, a leap that streamlines early hit generation. Isomorphic Labs leveraged AlphaFold derivatives to secure USD 600 million in January 2025, plus partnerships with Eli Lilly and Novartis worth more than USD 400 million each. The algorithm has mapped structures for over 200 million proteins, bypassing months of crystallography. Diffusion-based generators extend into de novo protein design, exemplified by University of Washington researchers who created an enzyme that degrades persistent pollutants in 2025. FDA’s AIM-NASH qualification in December 2025 validated AI-based biomarkers, smoothing the regulatory path for generative outputs in clinical endpoints.
Restraints Impact Analysis*
| Restraint | (~) % Impact on CAGR Forecast | Geographic Relevance | Impact Timeline |
|---|---|---|---|
| Shortage of Skilled AI-Biopharmaceutical Talent | −4.5% | Global, most acute in North America and Europe | Short term (≤ 2 years) |
| Fragmentation of Clinical and Genomic Data Sets | −3.5% | Global, pronounced in Asia-Pacific and Europe | Medium term (2-4 years) |
| Rising Cloud Compute Costs Relative to R&D Budgets | −2.0% | Global, with highest impact on early-stage biotechs | Short term (≤ 2 years) |
| Regulatory Concerns Over Algorithmic Bias and Transparency | −2.5% | Global, emphasized by U.S. FDA and European EMA | Short–Medium term (≤ 4 years) |
| Source: ���ϲ����� | |||
Shortage of Skilled AI-Biopharmaceutical Talent
Global demand for specialists who combine machine learning, molecular biology, and regulatory science far exceeds supply. Fewer than 5,000 senior-level professionals fit this profile, and median salaries topped USD 250,000 in 2025, a 35% premium to software engineering roles. Attrition exceeds 20% as Meta, Google, and OpenAI lure scientists with equity and unlimited compute credits. Academia produces under 200 joint MD-PhD graduates in computational drug discovery annually, creating chronic pipeline gaps. Pharmaceutical HR teams report that 60% of AI requisitions stay open longer than six months, slowing platform deployments and prompting high-multiple “acqui-hires” whose main value lies in staffing rather than IP. Without talent availability, even well-funded AI strategies risk execution delays that erode time-to-market advantages.
Fragmentation of Clinical and Genomic Data Sets
Data silos undermine algorithm performance. Deloitte’s 2025 survey found data scientists spend 70% of their time on cleaning and harmonizing records instead of model building. FHIR interoperability adoption stands at 30% among U.S. hospitals, and GDPR as well as China’s localization laws restrict cross-border data flow, forcing redundant infrastructure. A typical mid-tier pharma can access fewer than 50,000 fully annotated patient records, well below the threshold required to train foundation models. Federated learning reduces privacy friction but introduces 8-12% performance loss versus central training, lengthening validation timelines. Until policymakers mandate uniform schemas or establish data-trust frameworks, fragmented inputs will cap model accuracy and slow regulatory acceptance.
*Our updated forecasts treat driver/restraint impacts as directional, not additive. The revised impact forecasts reflect baseline growth, mix effects, and variable interactions.
Segment Analysis
By Technology: Generative Architectures Outpace Classical ML
The technology segment posted USD — numbers at segment level not supplied; still generative AI platforms outperformed the overall artificial intelligence in pharmaceutical market with a 43.21% CAGR forecast, while machine learning held a 38.21% share of 2025 sales. This divergence stems from R&D executives favoring algorithms that create molecules over those that merely classify them. NVIDIA’s BioNeMo democratized transformer and diffusion models, letting mid-size biotechs run protein language inference without building GPU farms. The artificial intelligence in pharmaceutical market size for generative systems is projected to expand sharply as models like Isomorphic Labs’ diffusion stack generate 10,000 ligand ideas per target per day.
Computer vision and NLP remain indispensable but secondary. Convolutional neural networks exceed 95% diagnostic accuracy in histopathology image classification, whereas NLP modules harvest 40% more safety signals from FAERS narratives than rule-based engines. Reinforcement learning optimizes dosing regimens, yet performance brittleness confines it to narrow use cases. Symbolic AI drafts regulatory documents, but uptake is modest. Over 2026-2031 deep-learning image analytics will grow near the artificial intelligence in pharmaceutical industry average, ceding spotlight to protein-aware diffusion models that sustain compound novelty.


By Offering: Services Surge on Outcome-Based Contracts
Services will grow at 43.78%, eclipsing platform software despite the latter’s 45.32% 2025 revenue share. CIOs prefer variable pricing aligned with clinical milestones, a model exemplified by Recursion’s per-candidate billing that shifted USD 180 million in risk in 2025. Hyperscalers combine GPU clusters, pre-trained models, and compliance tooling, capturing 35% of the services subsegment. The artificial intelligence in pharmaceutical market share for cloud-managed LLMOps reached the low-double digits, reinforcing vendor lock-in advantages for AWS, Azure, and Google Cloud.
Software platforms remain essential for data-rich pharmas. Schrödinger, Benchling, and Dotmatics each commanded enterprise ACVs above USD 500,000 in 2025. Yet growth cools as license-heavy models conflict with CFO mandates for cash conservation. Custom project engagements grew 22% year-over-year, especially for rare-disease pipelines demanding bespoke feature engineering. Over the forecast horizon, service providers that guarantee regulatory-grade outputs will consolidate share, while monolithic licenses migrate to subscription or milestone-linked contracts.
By Application: Pharmacovigilance Emerges as Growth Frontier
Drug discovery and pre-clinical workflows dominated 2025 with 34.42% of revenue, but pharmacovigilance will accelerate at 43.65%, the fastest among application layers. The FDA’s Sentinel Initiative pulls from 200 million patient records to flag adverse events within 48 hours, a latency manual reviewers cannot match. Consequently, the artificial intelligence in pharmaceutical market size for safety monitoring is projected to generate multibillion-dollar incremental sales by 2031. Oracle’s NLP module reduced periodic safety-report cycles by 60%, freeing pharmacovigilance teams for root-cause analysis.
Manufacturing AI, covering predictive equipment maintenance and vision-based vial inspection, captured 12% of 2025 revenue and should grow steadily as continuous manufacturing gains regulatory favor. Laboratory automation attracted USD 400 million in 2024 venture funding and offers self-driving assays that shorten hit-to-lead from 18 months to six. Sales-force optimization tools remain niche at 9% share amid ethical scrutiny. Over the outlook, application budgets will drift toward post-approval safety analytics and adaptive-trial design, maintaining diversification within the artificial intelligence in pharmaceutical market.
By Deployment Mode: On-Premise Revival Amid Sovereignty Mandates
Cloud retained 67.72% of infrastructure revenue in 2025, reflecting on-demand elasticity that lets chemists scale to 10,000 GPUs for 72-hour docking campaigns. Yet on-premise and edge installations are forecast to expand at 42.76%, propelled by GDPR and China’s Data Security Law that bar cross-border genomic transfers. Consequently, the artificial intelligence in pharmaceutical market share for sovereign cloud and private clusters is expected to rise through 2031.
Hybrid burst architectures blend local compute for baseline workloads with cloud spikes for peak demand, accounting for 18% of 2025 deployments. Edge inference remains under 5% but is critical for latency-sensitive manufacturing QA, where 50-millisecond round trips are unacceptable. Public-cloud providers now market sovereign instances inside national borders, blurring lines between traditional modes. Over the forecast window, compliance, latency, and cost trade-offs will shape a diversified infrastructure mix rather than a cloud-only default.
Geography Analysis
North America held 41.52% of 2025 revenue, underpinned by a USD 4.2 billion venture influx and FDA sandbox programs that accelerate algorithm validation. California, Massachusetts, and New York dominated deal flow, while Canada contributed federated-learning frameworks to satisfy privacy laws yet captured just 4% of regional funding. Mexico’s contract-manufacturing plants began piloting computer-vision QA, though adoption outside multinationals remains limited. The FDA’s January 2026 good-AI guidelines further strengthen the region’s first-mover advantage.
Asia-Pacific is forecast to post a 42.54% CAGR, the fastest of any region. China committed RMB 15 billion (USD 2.1 billion) in 2025 to AI-pharma consortia, elevating domestic champions such as XtalPi. Japan’s sandbox program targets geriatric adverse-event prediction as one-third of its population exceeds 65 years[2]. India leveraged cost-effective clinical-trial infrastructure to attract USD 320 million in 2024 AI funding, mostly for generics optimization. South Korea and Australia together held under 5% share but formed national consortiums to reduce reliance on U.S. and Chinese stacks.
Europe accounted for 22% of global turnover in 2025. Germany’s Fraunhofer Institute partnered with Bayer and Boehringer to develop explainable modules aligned with EMA auditing requirements[3]. The UK’s AI Airlock Sandbox slashed adaptive-trial approval cycles by seven months. France houses a 67-million-record health data hub, yet GDPR consent constraints limit pharmaceutical access to 10 million records, impeding large-scale model training. Latin America, the Middle East, and Africa combined delivered 8% of 2025 revenue; Brazil and the UAE piloted AI-based pharmacovigilance but lack sufficient trial density to generate global-grade datasets.

Competitive Landscape
No vendor exceeds an 8% slice of revenue, and the top 20 players together own roughly 45%, leaving white space for niche specialists. Platform aggregators such as Recursion and BenevolentAI consolidate multimodal datasets under one API, aiming for network effects as the artificial intelligence in pharmaceutical market widens. Partnership-centric models—Exscientia, Atomwise—embed algorithms inside pharma R&D without taking asset ownership, monetizing via milestone and royalty structures. Vertical integrators including Alphabet’s Isomorphic Labs and NVIDIA’s BioNeMo tie upstream compute advantages to downstream therapeutic revenues.
Investor enthusiasm persists despite profit headwinds. Isomorphic Labs’ USD 600 million Series A in January 2025 valued the start-up at USD 3.5 billion pre-revenue, a testament to confidence in AlphaFold’s moat. The Recursion–Exscientia merger pooled 23 trillion observations but traded 40% below SPAC debut price by mid-2025, reflecting skepticism toward pipeline-backloaded earnings. Quantum-computing vendors IBM, Atom Computing, and Pasqal explore molecular-dynamics simulations beyond classical scale, with commercial use estimated three to five years out.
Emerging disruptors target autonomous labs and edge inference. Emerald Cloud Lab and Carnegie Mellon’s robotics unit execute 10,000 reactions monthly without human oversight, compressing hit-to-lead cycles. HistoIndex’s AIM-NASH milestone illustrates how a single FDA-qualified biomarker can enshrine de-facto standards and funnel customers to niche suppliers. Competitive intensity therefore hinges on data ownership, regulatory validation, and compute access as much as on algorithmic novelty.
Artificial Intelligence (AI) In Pharmaceutical Industry Leaders
Deep Genomics
Exscientia
Insilico Medicine
Alphabet Inc. (Isomorphic Labs)
Recursion Pharmaceuticals
- *Disclaimer: Major Players sorted in no particular order

Recent Industry Developments
- January 2026: The FDA issued “Guiding Principles of Good AI Practice,” laying out mandatory validation, bias audit, and surveillance protocols
- January 2026: Innovative Health Initiative Project LIGAND-AI launched to accelerate AI-driven drug discovery by promoting open science collaboration. The initiative aims to enhance pharmaceutical research and development through advanced artificial intelligence techniques.
- January 2026: NVIDIA and Eli Lilly are collaborating to create an AI co-innovation lab to revolutionize drug discovery, development, and manufacturing. This partnership aims to leverage artificial intelligence to accelerate pharmaceutical advancements.


Research Methodology Framework and Report Scope
Market Definitions and Key Coverage
Our study defines the artificial intelligence in pharmaceutical market as the global revenue generated by software platforms, cloud-hosted services, and supporting tools that deploy machine learning, generative AI, computer vision, or natural-language processing across drug discovery, clinical development, manufacturing, supply-chain, and pharmacovigilance workflows.
Scope exclusion: Custom hardware sales (GPUs, edge devices) and generic enterprise AI services not purpose-built for pharmaceutical use are excluded.
Segmentation Overview
- By Technology
- Machine Learning
- Supervised Learning
- Unsupervised & Self-Supervised Learning
- Deep Learning
- Natural Language Processing
- Computer Vision
- Generative AI (Diffusion / Transformer-Based)
- Other Technologies
- Machine Learning
- By Offering
- Software Platforms
- Services (AI-As-A-Service, Custom Projects, Managed LLMOps)
- By Application
- Drug Discovery & Pre-Clinical Development
- Clinical-Trial Design & Patient Recruitment
- Manufacturing & Quality Control
- Pharmacovigilance & Safety Monitoring
- Sales, Marketing & Commercial Analytics
- Laboratory Automation / Self-Driving Labs
- Other Applications
- By Deployment Mode
- Cloud-Based
- Public Cloud
- Private VPC / Sovereign Cloud
- On-Premise / Edge
- Hybrid (Burst-To-Cloud)
- Cloud-Based
- Geography
- North America
- United States
- Canada
- Mexico
- Europe
- Germany
- United Kingdom
- France
- Italy
- Spain
- Rest of Europe
- Asia-Pacific
- China
- Japan
- India
- Australia
- South Korea
- Rest of Asia-Pacific
- Middle East & Africa
- GCC
- South Africa
- Rest of Middle East & Africa
- South America
- Brazil
- Argentina
- Rest of South America
- North America
Detailed Research Methodology and Data Validation
Primary Research
Conversations with R&D chiefs, digital-health officers, CRO executives, and cloud-infrastructure partners across North America, Europe, and Asia refined adoption timelines, average license fees, and regional regulatory frictions. Feedback loops with data-science leads clarified realistic productivity gains and validated cost-saving assumptions derived from desk work.
Desk Research
We began with publicly available macro and sector data from authorities such as the US FDA, EMA, and Japan's PMDA to benchmark clinical-trial volumes and approval pipelines. Cost and adoption signals were pulled from the OECD R&D Database, NIH ClinicalTrials.gov, WIPO patent filings, and trade statistics. Corporate filings and investor decks of listed biopharma firms helped us approximate annual AI budgets, while press coverage curated through Dow Jones Factiva and D&B Hoovers provided spend disclosures and vendor pricing anecdotes. This list is illustrative; many additional open sources were mined to cross-check figures and narratives.
Market-Sizing & Forecasting
A top-down model starts with global pharmaceutical R&D outlay, layers in our measured AI penetration rate by function, and converts spend to vendor revenue using blended price cards. Supplier roll-ups of leading platform providers serve as a bottom-up reasonableness check. Biopharma R&D spend trajectory, average AI-per-project budget share, number of active Phase I-III trials using AI-enabled design tools, cloud-compute unit cost index for model training, and venture funding inflows to AI-drug-discovery startups.
Missing bottom-up datapoints (e.g., private contract values) are gap-filled with median ratios from surveyed peers before reconciliation. A multivariate regression anchored to the above drivers generates the 2025-2030 forecast.
Data Validation & Update Cycle
Outputs undergo variance checks against external market meters, followed by peer review. Reports refresh every twelve months, with interim revisions triggered by major funding rounds, landmark drug approvals, or regulatory shifts; a final analyst pass ensures clients receive the latest view.
Credibility Corner: Why Mordor's AI in Pharmaceutical Baseline Commands Reliability
Published estimates often diverge because each firm picks its own functional scope, pricing yardsticks, and refresh cadence. Analysts at ���ϲ����� lock the scope tightly to revenue earned from purpose-built pharmaceutical AI tools, apply transparent cost-to-revenue conversions, and refresh models annually, which curbs legacy inflation.
Key gap drivers when compared with other publishers include the inclusion of generalized healthcare AI revenue, one-time pilot projects booked as recurring sales, and infrequent model updates that miss 2025's surge in GenAI licensing.
Benchmark comparison
| Market Size | Anonymized source | Primary gap driver |
|---|---|---|
| USD 4.35 B (2025) | ���ϲ����� | - |
| USD 3.00 B (2024) | Global Consultancy A | bundles non-pharma life-sciences AI and omits cloud-compute pass-through costs |
| USD 1.51 B (2024) | Trade Journal B | narrows scope to discovery stage only and excludes safety-monitoring platforms |
| USD 3.24 B (2024) | Industry Portal C | relies on historical license fees without adjusting for 2025 GenAI price inflation |
The comparison shows that figures as low as USD 1.5 billion and as high as USD 3.2 billion for 2024 stem from scope or price-capture gaps, whereas Mordor's disciplined, annually refreshed approach delivers a balanced, decision-ready baseline (mordorintelligence.com).


Key Questions Answered in the Report
What is the projected value of the artificial intelligence in pharmaceutical market by 2031?
The market is forecast to reach USD 34.95 billion by 2031 at a 41.52% CAGR over 2026-2031.
Which technology segment will grow fastest through 2031?
Generative AI architectures built on diffusion and transformer models are expected to expand at 43.21%, outpacing classical machine learning.
Why are on-premise deployments rising despite cloud dominance?
Data sovereignty laws in Europe, China, and India require local genomic processing, pushing companies toward on-premise or sovereign-cloud clusters.
Which application area shows the highest CAGR?
Pharmacovigilance and safety monitoring will post a 43.65% CAGR, driven by real-time adverse-event detection mandates.
How fragmented is the competitive landscape?
No single vendor holds more than 8%, and the top 20 players control roughly 45%, yielding a moderate fragmentation score of 5.
What major regulatory milestone occurred in December 2025?
The FDA qualified AIM-NASH, marking the first machine-learning biomarker accepted for use in drug-development programs.
Page last updated on:


