Market Overview
| Study Period | 2021 - 2031 |
|---|---|
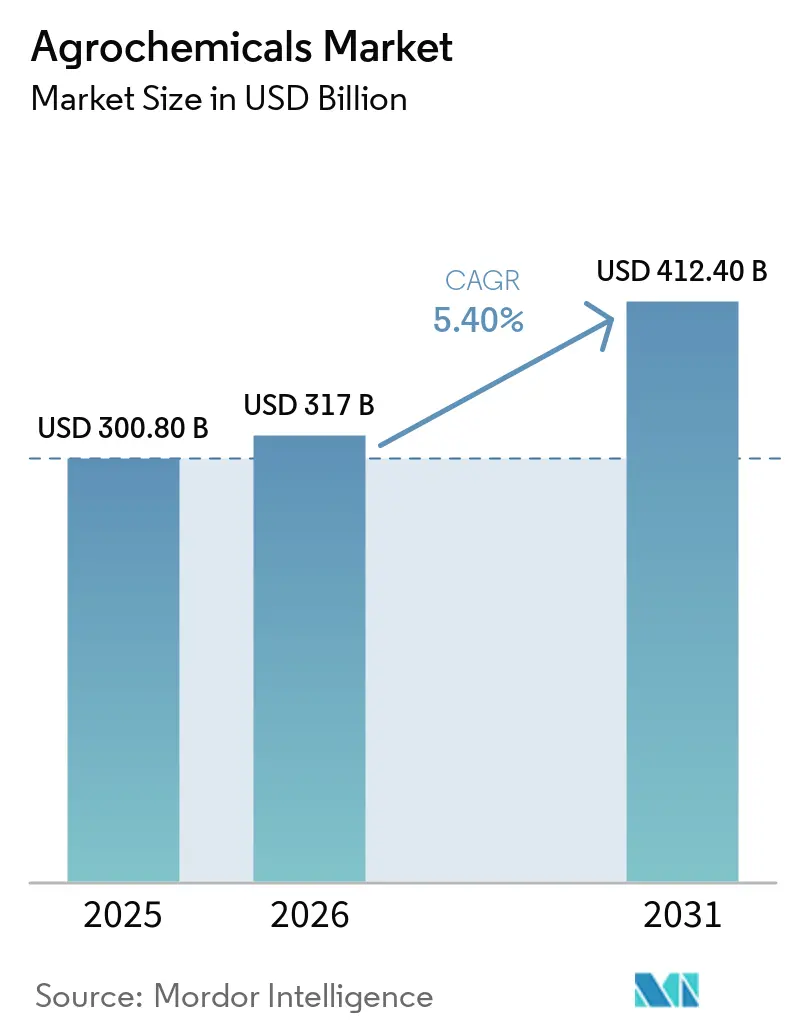
| Market Size (2026) | USD 317 Billion |
| Market Size (2031) | USD 412.40 Billion |
| Growth Rate (2026 - 2031) | 5.40% CAGR |
| Fastest Growing Market | Asia Pacific |
| Largest Market | Asia Pacific |
| Market Concentration | Medium |
Major Players *Disclaimer: Major Players sorted in no particular order Image © ���ϲ�����. Reuse requires attribution under CC BY 4.0. | |
Agrochemicals Market Analysis by ���ϲ�����
The agrochemicals market size is estimated to grow from USD 300.8 billion in 2025 to USD 317.0 billion in 2026, and is forecast to reach USD 412.4 billion by 2031, at a 5.4% CAGR over the forecast period. The agrochemicals market continues to expand because global crop systems still depend on reliable nutrient supply, weed control, disease management, and yield protection across large acreages of cereal, oilseed, and horticulture crops. Growth is also shifting toward higher-value products, as resistance pressure, regulatory screening, and precision application tools push buyers toward differentiated chemistry, specialty fertilizers, and service-linked offerings. Asia-Pacific remains the core demand center, while South America continues to absorb premium agrochemical inputs for crops such as soybeans, corn, and sugarcane, which are highly input-intensive. Competitive activity is shaped by a split structure, with innovation and premium pricing driving crop protection, while fertilizer volumes depend more on scale, sourcing, and product mix. Regulatory tightening in Europe, litigation around legacy herbicides, and feedstock cost swings remain the main limits on how quickly the agrochemicals market can convert demand into profit growth.
Key Report Takeaways
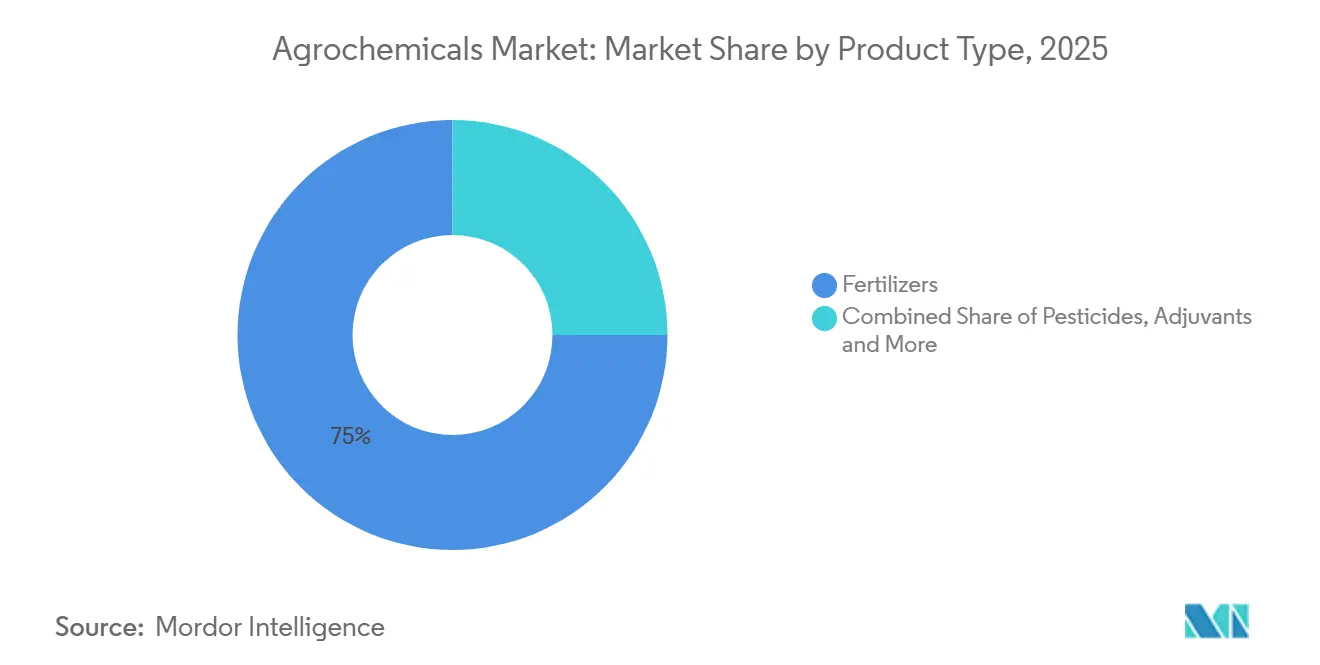
- By product type, fertilizers accounted for 75% of the agrochemicals market share in 2025, while plant growth regulators are projected to grow at a CAGR of 13.0% during 2026-2031.
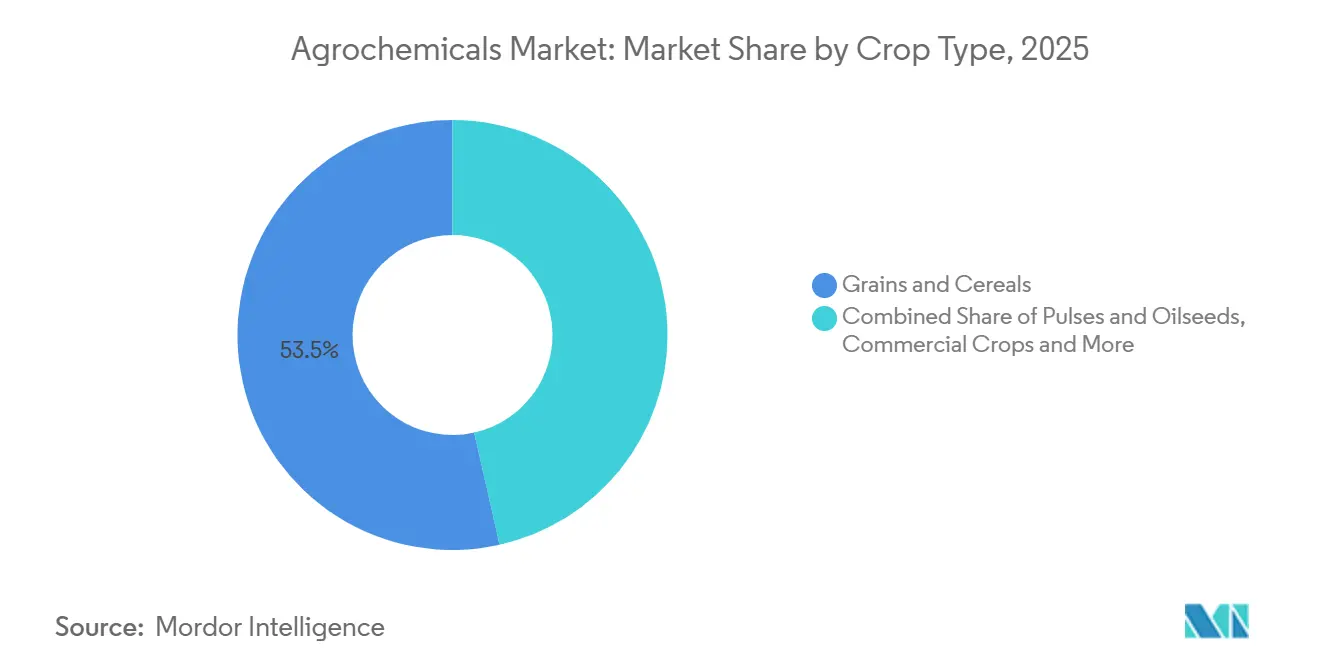
- By crop type, grains and cereals held 53.5% share of the agrochemicals market size in 2025, whereas fruits and vegetables are advancing at a 7.4% CAGR through 2031.
- By geography, Asia-Pacific accounted for 53% share of the agrochemicals market in 2025 and is the fastest-growing region, with a 6.6% CAGR to 2031.
Note: Market size and forecast figures in this report are generated using ���ϲ�����’s proprietary estimation framework, updated with the latest available data and insights as of January 2026.
Global Agrochemicals Market Trends and Insights
Drivers Impact Analysis*
| Driver | (~) % Impact on CAGR Forecast | Geographic Relevance | Impact Timeline |
|---|---|---|---|
| Rising herbicide-resistant weeds and resistant pathogen pressure | +0.8% | Global, most acute in North America, Australia, and Brazil | Short term (≤ 2 years) |
| Precision agriculture and variable-rate application scaling | +0.7% | North America, Europe core, and spill over to APAC | Medium term (2-4 years) |
| Controlled-release and inhibitor-coated fertilizers adoption | +0.6% | Asia-Pacific, Europe, and North America | Medium term (2-4 years) |
| Carbon-linked monetization for nitrogen-efficiency inputs | +0.5% | North America, Europe, and Australia | Long term (≥ 4 years) |
| Expanding access to off-patent active ingredients | +0.4% | Global with early gains in India and Brazil | Short term (≤ 2 years) |
| High-value horticulture intensity lifts specialty input demand | +0.5% | Mediterranean Europe, Southeast Asia, and Middle East | Medium term (2-4 years) |
| Source: ���ϲ����� | |||
Rising Herbicide-Resistant Weeds and Resistant Pathogen Pressure
The agrochemicals market is seeing durable demand because weed resistance is no longer limited to isolated crop systems. The International Herbicide-Resistant Weed Database recorded 546 unique resistance cases involving 274 species across 76 countries as of May 2026, with the United States at 138 cases, Australia at 91, and Canada at 56[1]Source: I. Heap, “The International Herbicide-Resistant Weed Database,” Weed Science, weedscience.org. The problem is more severe in regions where glyphosate and ALS-inhibitor chemistries were used heavily across repeated crop rotations. Peer-reviewed work published in 2024 showed that cross-resistance within herbicide groups is becoming more complex, which means growers cannot rely on simple sequence changes to restore efficacy. This trend supports premium pricing for new modes-of-action herbicides, including Syngenta’s VIRESTINA technology, FMC’s Dodhylex active, and Bayer’s Stryax dicamba for the 2026 season. The HRAC’s 2025 guideline also moved AI-based site-specific weed management closer to routine practice, linking herbicide performance directly to digital scouting and variable-rate application tools.
Precision Agriculture and Variable-Rate Application Scaling
The agrochemicals market is also being supported by better application accuracy rather than by simple volume expansion. China’s agricultural drone coverage reached 173 million hectares in 2024, rising to 178 million hectares in 2025, underscoring how quickly precision delivery is spreading across large farming systems. Variable-rate technology lets growers apply different doses based on field conditions, helping preserve efficacy where resistance pressure is uneven and supporting compliance as residue oversight becomes stricter. Yara’s February 2026 launch of the YaraPlus digital platform in the United Kingdom, integrated with John Deere hardware, showed that major suppliers now treat digital agronomy as a commercial product rather than a support feature. Corteva’s Q1 2026 net sales rose 11% year on year to USD 4.9 billion, which supports the view that premium chemistry paired with targeted application is outperforming the broader agrochemicals market. The practical outcome is that precision farming can reduce waste at the field level while still supporting higher revenue per litre or tonne for differentiated products.
Controlled-Release and Inhibitor-Coated Fertilizers Adoption
The agrochemicals market is benefiting from a stronger agronomic case for controlled-release and enhanced-efficiency fertilizers. A 2025 research study covering more than 8,000 field trials found that controlled-release fertilizers improved crop yield by 5.1%, farmer profitability by 8.2%, and nitrogen uptake by 7.1%, while cutting greenhouse gas emissions by 3.6% to 18.6% and reducing nitrogen losses by 32.6% to 49.1% compared with traditional fertilizers[2]Source: Herbicide Resistance Action Committee, “Guideline to the Management of Herbicide Resistance,” Herbicide Resistance Action Committee, hracglobal.com. Polymer-coated urea and dual-inhibitor blends are transitioning from niche products to broader adoption as factors such as labor constraints, runoff regulations, and yield requirements converge. Nutrien Ltd. reported significant growth in ESN (Environmentally Smart Nitrogen) sales in 2025 compared to 2024, driven by demand from the United States corn and Canadian canola markets. Consequently, companies with advanced coating technologies can maintain price stability during volatile commodity cycles.
Carbon-Linked Monetization for Nitrogen-Efficiency Inputs
Enhanced-efficiency fertilizers qualify for verified emission reductions valued at USD 15–40 per metric ton of CO₂ equivalent. Nutrien piloted the practice over 500,000 United States corn acres in 2025, pairing Environmentally Smart Nitrogen (ESN) controlled-release urea with on-farm verification and selling credits to Microsoft and Cargill, Incorporated at USD 32 per metric ton, delivering USD 8–12 per acre back to growers. Yara’s YaraVera stabilizer cut N₂O emissions by 38% in Iowa trials and secured ISO 14064 verification, converting compliance into brand premium. The economics prove that environmental attributes, once externalities, now represent cash flows shared among supplier, farmer, and buyer, reshaping marketing language around nutrient product. In practical terms, this creates a premium channel alongside standard nitrogen volumes and can reward companies with traceability and certification capabilities. Over time, this could shift part of the nitrogen competition away from pure commodity pricing and toward verified product attributes. That is a meaningful long-term support for the agrochemicals market because it raises the value captured per metric ton, even without faster acreage growth.
Restraints Impact Analysis*
| Restraint | (~) % Impact on CAGR Forecast | Geographic Relevance | Impact Timeline |
|---|---|---|---|
| Tightening active-ingredient bans and residue limits | -0.8% | European Union core and spill-over to global export markets | Short term (≤ 2 years) |
| Re-registration and data-package costs rising | -0.5% | Global, most acute in European Union and North America | Medium term (2-4 years) |
| Price volatility in glyphosate and key feedstocks | -0.6% | Global, most acute in North America and Asia | Short term (≤ 2 years) |
| Litigation exposure around legacy chemistries | -0.4% | North America and with spill-over to European Union | Medium term (2-4 years) |
| Source: ���ϲ����� | |||
Tightening Active-Ingredient Bans and Residue Limits
The agrochemicals market is facing increasing regulatory pressure in Europe, where policy actions are restricting the use of several commercially important active ingredients. Recent regulations, including Commission Implementing Regulation (EU) 2025/910, have withdrawn approval for flufenacet and mandated the phased withdrawal of related authorizations, while Delegated Regulation 2024/3199 added more than 30 substances to export notification or ban status. These measures are not limited to Europe alone, as exporters supplying the EU must also comply with stricter residue standards, reducing the range of usable agrochemical products even in markets where the same active ingredients remain approved. As a result, agrochemical companies are facing increasing challenges in portfolio planning and product continuity, particularly those relying on mature chemistries with limited replacement pipelines. The tightening regulatory environment is increasing compliance costs, extending product transition timelines, and creating uncertainty around long-term commercialization strategies, ultimately slowing innovation and raising operational complexity across the global agrochemicals market.
Re-Registration and Data-Package Costs Rising
The agrochemicals market is increasingly constrained by the rising costs associated with maintaining product registrations. Re-registration processes now require more comprehensive toxicology, residue, environmental fate, and exposure data across major regulatory jurisdictions, significantly increasing lifecycle management costs even for well-established active ingredients. In Europe, stricter requirements under Regulation 1107/2009 and related updates have expanded scrutiny around endocrine disruption and groundwater contamination risks, placing additional pressure on both originator and generic manufacturers. In North America, companies are also facing growing expectations to support legacy products with stronger scientific validation and enhanced stewardship programs. These rising compliance costs disproportionately affect suppliers with smaller regional sales volumes and limited data-generation budgets, reducing the commercial viability of certain products. Over time, this trend is narrowing product availability for distributors and growers while slowing portfolio renewal and innovation across the agrochemicals market.
*Our updated forecasts treat driver/restraint impacts as directional, not additive. The revised impact forecasts reflect baseline growth, mix effects, and variable interactions.
Segment Analysis
By Product Type: Fertilizers Anchor Revenue, Plant Growth Regulators Lead Innovation
Fertilizers accounted for nearly 75% of the agrochemicals market share in 2025, with nitrogen-based products such as urea, ammonium nitrate, and UAN solutions remaining essential for cereal production across Asia-Pacific and North America. Meanwhile, plant growth regulators are projected to register the fastest growth at a CAGR of 13.0%, driven by rising demand for solutions that enhance flowering synchronization and extend the shelf life of fruits and vegetables. Herbicides continue to hold a significant share of the pesticide segment, particularly in regions with stringent zero-residue regulations, while adjuvants are gaining strategic importance due to their ability to reduce spray rates while maintaining efficacy. Reflecting this trend, Corteva Agriscience’s ProGibb, a gibberellin-based regulator, recorded high revenue growth in 2025.
The increasing phase-out of toxic active ingredients and growing preference for coated formulations are encouraging companies to integrate fertilizer and crop protection solutions. Manufacturers that offer both nutrient efficiency and pest control capabilities are strengthening relationships with channel partners and expanding market share through cross-selling. These trends are supporting profitability despite volatility in commodity fertilizer cycles, while companies demonstrating environmental performance through third-party validation are increasingly securing premium pricing, signaling a shift toward sustainability- and value-driven competition in the agrochemicals market.


By Crop Type: Grains and Cereals Dominate, Fruits and Vegetables Accelerate
Grains and cereals accounted for 53.5% of the agrochemicals market size in 2025, driven by large-scale cultivation of crops such as wheat, rice, corn, and sorghum, which require significant volumes of nitrogen fertilizers and herbicides. In the United States, herbicide-tolerant crop programs and bundled solutions such as Corteva Agriscience’s Enlist E3 continued to support agrochemical demand, while Asia-Pacific markets increasingly adopted controlled-release fertilizers and inhibitor-coated products to improve nutrient efficiency and crop yields.
Fruits and vegetables represent a smaller share of the market, but they are projected to grow at a CAGR of 7.4% through 2031, supported by rising demand for residue-compliant produce in export markets. Growers in countries including Kenya, Peru, and Vietnam are increasingly utilizing plant growth regulators and specialty fungicides to meet international quality standards, boosting demand for products such as Corteva’s ProGibb. At the same time, precision-application technologies and cost-efficient herbicide solutions are gaining traction in cereals and oilseeds, encouraging agrochemical companies to focus on high-margin, environmentally certified formulations integrated with advanced application systems.
Geography Analysis
Asia-Pacific accounted for 53% of the agrochemicals market in 2025 and is anticipated to expand at a CAGR of 6.6% through 2031. China continues to undergo structural consolidation, with the top 10 technical producers achieving a CR10 of 53% in 2025, while drone-based crop protection applications covered 34% of the country’s total spray area in 2024. India also remains a key growth engine for the agrochemicals market, supported by a 7.3% year-on-year increase in fertilizer sales in FY2025 and record food production of 332 million metric tons. In 2025, Sumitomo Chemical India Limited commenced commercial production of CTPR (Chlorantraniliprole) at its Tarapur facility and secured approvals for the Excalia Max and Lentigo fungicides in India. In addition, ICL inaugurated its specialty fertilizer plant in Maharashtra in April 2026, while Coromandel International reported record quarterly NPK (Nitrogen, Phosphorus, and Potassium) production of 1.0 million metric tons in FY2026.
Africa agrochemicals market is driven by low fertilizer penetration and significant yield-improvement potential. Reflecting the region’s rising strategic importance, PhosAgro increased fertilizer exports to Africa by one-third during H1 2025 and plans to further scale operations over the next five years. In South America, Brazil’s fertilizer distribution increased significantly, while special fertilizer revenues also saw strong growth. EuroChem launched its phosphate fertilizer complex in Serra do Salitre in March 2025, and OCP Nutricrops expanded its international footprint through new subsidiaries in France and India. Meanwhile, North America is anticipated to witness steady growth, supported by chemistry upgrades, precision-application technologies, and low-carbon nitrogen programs rather than agricultural acreage expansion.
In North America, the agrochemicals market growth continues to be influenced by mature farming acreage and litigation-related pressures, although advances in digital agriculture platforms and carbon-credit programs are creating new service-oriented revenue streams for agrochemical companies. Europe is projected to experience comparatively slower growth due to stringent Farm to Fork pesticide-reduction targets; however, the region is emerging as a leader in low-carbon fertilizer adoption, supported by regulatory initiatives such as the Carbon Border Adjustment Mechanism (CBAM). At the same time, the Middle East is leveraging its cost-competitive natural gas reserves to strengthen ammonia production for exports while investing in blue and green ammonia projects to support long-term sustainability objectives. Collectively, these regional trends indicate that while Asia-Pacific remains the dominant agrochemicals market by overall sales, high-growth opportunities in Africa and South America are increasingly influencing global expansion and investment strategies.


Competitive Landscape
The agrochemicals market remained moderately concentrated in 2025, with the top 5 players collectively holding significant share, while the balance was spread across fertilizer producers, crop protection originators, generic formulators, and regional specialists. Nutrien Ltd., Syngenta Group, Yara International ASA, and Bayer AG are the major players operating in this market. They create two competitive market structure patterns, one in crop protection, where new chemistry can support premium pricing, and another in fertilizers, where scale, logistics, and feedstock economics matter more. As a result, the agrochemicals market does not behave like a tightly held global oligopoly even though a small group still leads several high-value categories. Companies, therefore, need both product innovation and local route-to-market strength to defend their share.
Strategic moves in 2025 and 2026 show how leaders are positioning for that split structure. FMC signed a definitive agreement in May 2026 to divest its India commercial business to Crystal Crop Protection for USD 252 million, while maintaining its focus on proprietary actives such as Isoflex, fluindapyr, and Dodhylex[3]Source: FMC Corporation, “India Commercial Business Divestiture,” FMC Corporation, fmc.com. Corteva Agriscience also announced the Vylor brand for its planned seed and genetics spin-off, with separation targeted in Q4 2026.
White-space opportunities remain strongest in conventional stack products, low-carbon certified nitrogen, and digitally supported agronomy services. Mid-tier players such as ADAMA, Nufarm, and UPL are using off-patent access, formulation upgrades, and agrochemical products to target openings left by portfolio exits or stricter regulation. For the agrochemicals market, this means customer retention will increasingly depend on bundled value rather than on molecules or nutrients sold in isolation.
Agrochemicals Industry Leaders
Syngenta Group
Bayer AG
Nutrien Ltd.
Yara International ASA
BASF SE
- *Disclaimer: Major Players sorted in no particular order

Recent Industry Developments
- May 2026: FMC Corporation signed a definitive agreement to divest its India commercial business to Crystal Crop Protection for USD 252 million, advancing the company's strategy of focusing on high-margin proprietary active ingredients, including Isoflex, fluindapyr, and Dodhylex. The India exit removes a lower-margin distribution business while preserving IP-driven growth assets.
- April 2026: Syngenta Group globally launched VIRESTINA technology, metproxybicyclone, the first selective herbicide in 40 years specifically targeting resistant grass weeds in soybean and cotton systems, with first approval in Argentina. The launch directly addresses the multi-resistance crisis in A. palmeri and opens a new premium-priced solution for the United States and South American growers.
- April 2026: CF Industries Holdings reached its first commercial agreement for certified low-carbon UAN with PepsiCo's Frito-Lay potato supply chain, establishing a precedent for Scope 3 corporate commitments translating into a direct premium-priced demand channel for enhanced-efficiency nitrogen fertilizers.


Research Methodology Framework and Report Scope
Market Definitions and Key Coverage
According to ���ϲ�����, the agrochemicals market comprises all factory-made fertilizers, synthetic and biological crop-protection chemicals, adjuvants, and plant-growth regulators that are traded through commercial channels for field and protected agriculture. Usage in forestry and home gardening is included only when the products and pack sizes mirror farm-grade specifications.
Scope exclusion: The study omits on-farm nutrient blends mixed by growers, biotech seed traits, and application machinery.
Segmentation Overview
- By Product Type
- Fertilizers
- Nitrogenous
- Phosphatic
- Potassic
- Other Fertilizers
- Pesticides
- Herbicides
- Insecticides
- Fungicides
- Other Pesticides
- Adjuvants
- Plant Growth Regulators
- Fertilizers
- By Crop Type
- Grains and Cereals
- Pulses and Oilseeds
- Fruits and Vegetables
- Commercial Crops
- Turf and Ornamental
- By Geography
- North America
- United States
- Canada
- Mexico
- Rest of North America
- Europe
- Germany
- France
- United Kingdom
- Italy
- Spain
- Russia
- Rest of Europe
- Asia-Pacific
- China
- India
- Japan
- Australia
- Rest of Asia-Pacific
- South America
- Brazil
- Argentina
- Rest of South America
- Middle East
- Saudi Arabia
- United Arab Emirates
- Rest of Middle East
- Africa
- South Africa
- Egypt
- Rest of Africa
- North America
Detailed Research Methodology and Data Validation
Primary Research
Structured interviews with agronomists, farm input distributors, regional regulators, and procurement heads across Asia-Pacific, the Americas, Europe, and Africa clarified adoption rates of enhanced efficiency fertilizers, average selling prices, and the likely phase-out timeline of high toxicity actives, thereby anchoring desk findings.
Desk Research
Our analysts started with publicly available macro and trade indicators from tier-1 bodies such as FAO, OECD-FAOSTAT, UN Comtrade, USDA ERS, and Eurostat, complemented by annual reports and 10-Ks of major input suppliers. Price curves and company financials were cross-verified with D&B Hoovers and Dow Jones Factiva. Specialist datasets, WSTS for active ingredient capacity signals and Volza for shipment level pesticide flows, helped fine-tune regional splits. This list is illustrative; many additional sources were reviewed to validate trends and fill gaps.
Market-Sizing & Forecasting
The model begins with a top-down reconstruction of demand using country-level fertilizer application rates (kg/ha), FAO pesticide use statistics, and cropped area forecasts; volumes are then multiplied by blended ASPs collected from trade data. Select bottom-up checks, supplier revenue roll-ups and dealer channel audits, catch anomalies. Key variables include urea spot prices, corn-soy acreage switches, pesticide maximum residue limit revisions, and biologicals' penetration. A multivariate regression with lagged rainfall normals and farm income indices projects consumption to 2030; scenario analysis adjusts for regulatory shocks. Gaps in bottom-up inputs are bridged by regional proxy ratios tested during expert calls.
Data Validation & Update Cycle
Outputs move through variance checks, senior analyst peer review, and a final reconciliation against independent trade and price indices. The dashboard refreshes annually, with interim updates when material events, such as an EU active ban, alter demand.
Why Mordor's Agrochemicals Baseline Commands Reliability
Published figures often vary because providers select different product baskets, pricing points, and update cadences.
We acknowledge these disparities upfront.
Benchmark comparison
| Market Size | Anonymized source | Primary gap driver |
|---|---|---|
| USD 251 B (2025) | ���ϲ����� | - |
| USD 235.2 B (2023) | Global Consultancy A | Excludes plant growth regulators; uses 2022 average prices; update cycle biennial |
| USD 285.1 B (2024) | Global Consultancy B | Includes pesticide formulation services revenue; constant 2020 dollars without FX adjustment |
| USD 287.9 B (2024) | Industry Analyst C | Counts antibiotic feed additives; mixes wholesale and retail price points |
In sum, Mordor's disciplined scope, annual refresh, and dual validation steps deliver a balanced, transparent market baseline that decision makers can trace back to clear variables and reproducible calculations.


Key Questions Answered in the Report
What is driving agrochemicals demand through 2031?
Demand is being supported by stable fertilizer use, resistance-led crop protection needs, specialty nutrition, and precision application tools. The agrochemicals market is forecast to reach USD 412.4 billion by 2031 at a 5.4% CAGR.
Which product category contributes the most revenue?
Fertilizers remained the largest product category with 75% share in 2025, reflecting the basic nutrient needs of global cereal, oilseed, and horticulture systems.
Which segment is expanding the fastest?
Plant growth regulators are projected to grow at a 13% CAGR through 2031, the fastest among product types, supported by protected cultivation and higher-value crop management.
Why is Asia-Pacific so important for suppliers?
Asia-Pacific is the largest regional cluster and forecast to grow at 6.6% CAGR through 2031, supported by China’s consolidation and precision adoption and India’s strong fertilizer demand.
How concentrated is competition among leading companies?
The top 5 players held significant share in 2025, so leadership exists, but much of the business is still spread across many fertilizer, crop protection, and regional suppliers.
Page last updated on:


