Agricultural Testing Market Size and Share
Market Overview
| Study Period | 2021 - 2031 |
|---|---|
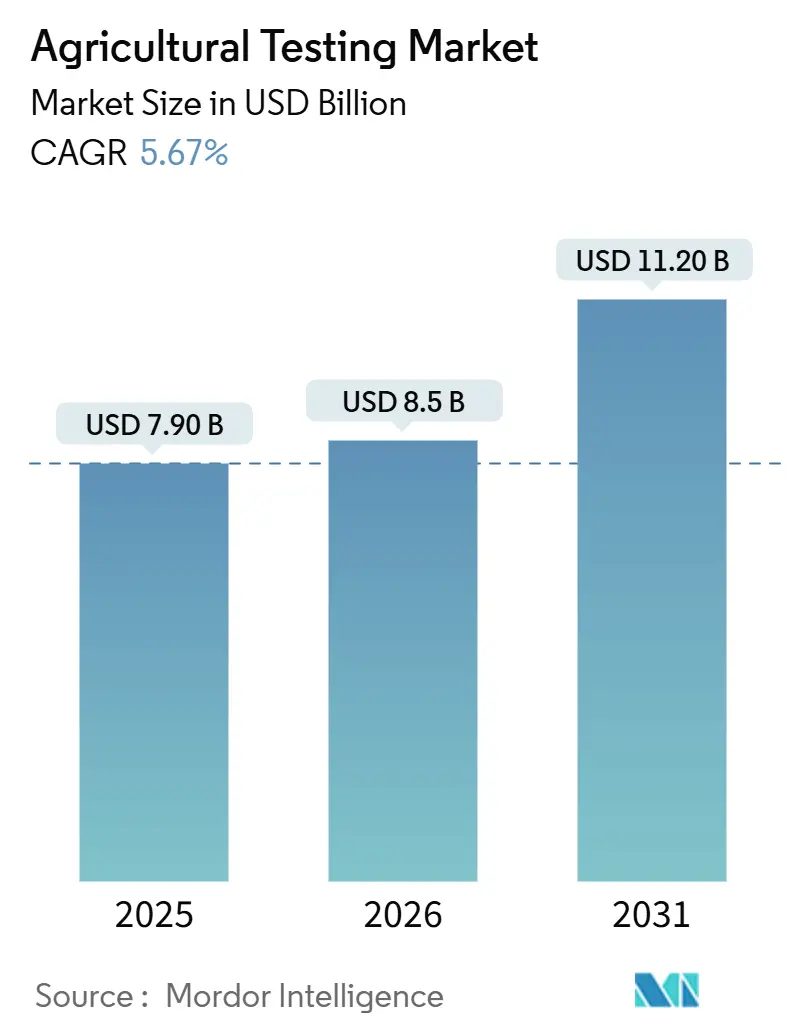
| Market Size (2026) | USD 8.5 Billion |
| Market Size (2031) | USD 11.20 Billion |
| Growth Rate (2026 - 2031) | 5.67% CAGR |
| Fastest Growing Market | Asia-Pacific |
| Largest Market | North America |
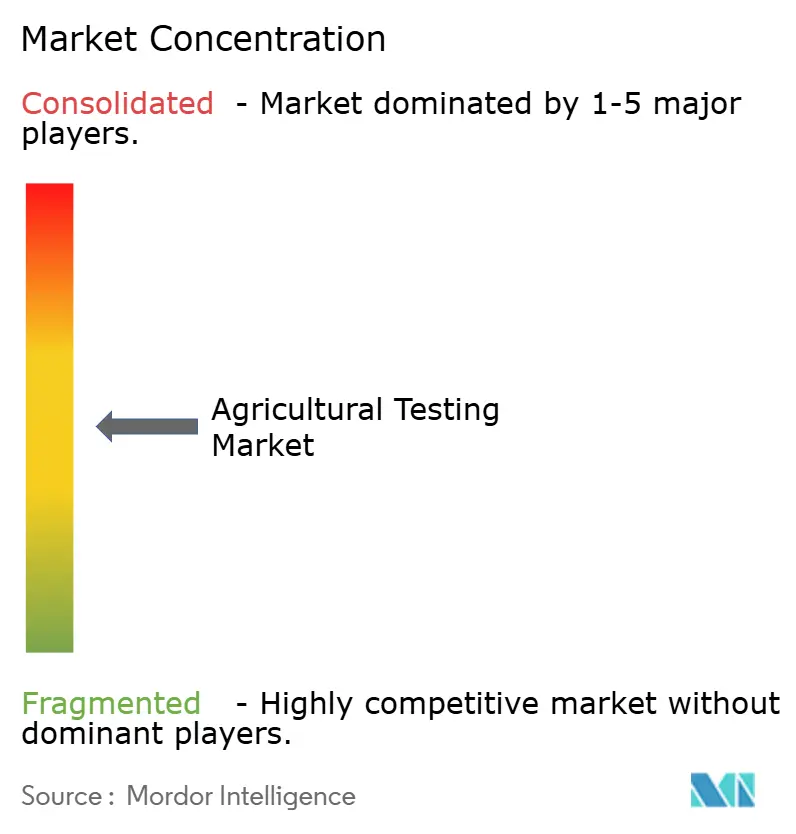
| Market Concentration | Medium |
Major Players *Disclaimer: Major Players sorted in no particular order Image © ���ϲ�����. Reuse requires attribution under CC BY 4.0. | |
Agricultural Testing Market Analysis by ���ϲ�����
The agricultural testing market size is anticipated to grow from USD 7.9 billion in 2025 to USD 8.5 billion in 2026 and is forecast to reach USD 11.2 billion by 2031 at a 5.67% CAGR over 2026-2031. Heightened regulatory scrutiny, the surge in organic trade certification, and rapid-test innovations are the key forces lifting demand. Laboratories with International Organization for Standardization (ISO)/International Electrotechnical Commission (IEC)17025 credentials now treat blockchain connectivity as a baseline requirement, as retailers seek immutable certificates to shorten border clearance times. Seed companies are accelerating health checks to stop pathogen carryover, while carbon-credit programs are turning soil assays into multi-year annuity contracts. High capital requirements for mass spectrometry upgrades, shortages of skilled professionals, and tariff-influenced reagent costs are influencing the competitive landscape, leading to consolidation as smaller laboratories delegate complex tasks to the five major networks.
Key Report Takeaways
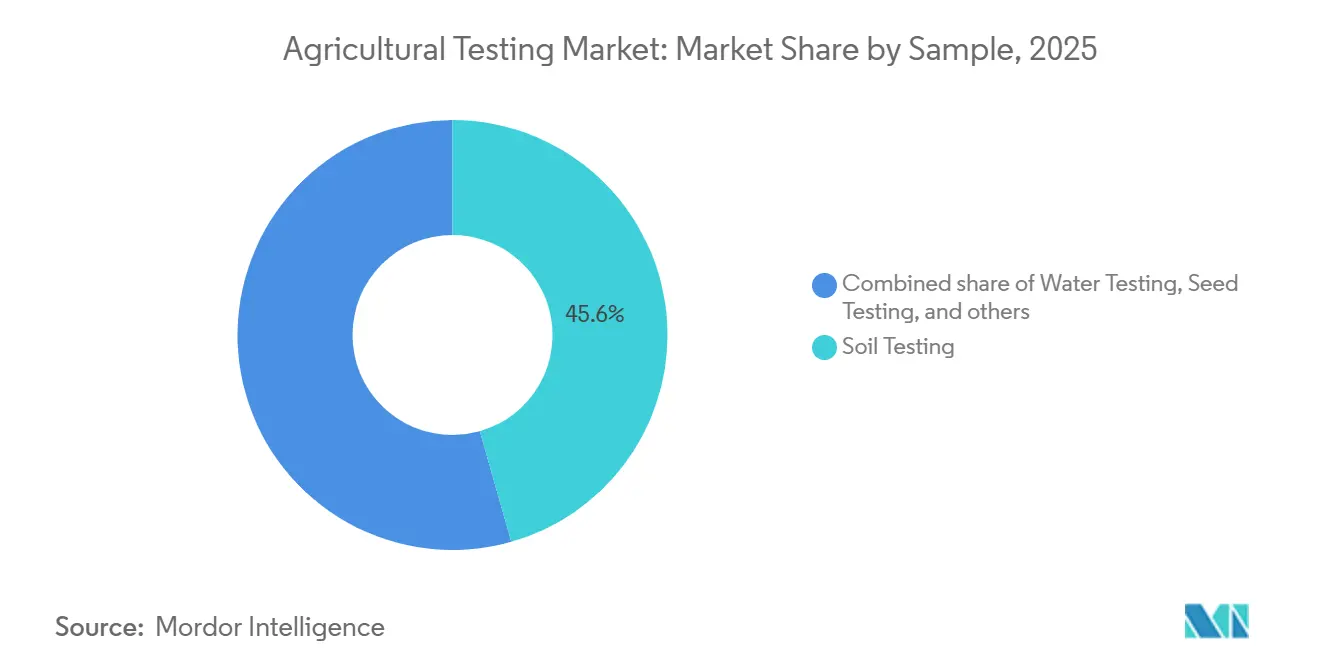
- By sample type, soil testing led with 45.6% of the agricultural testing market share in 2025, while seed testing is projected to expand at an 8.8% CAGR through 2031.
- By application, quality assurance accounted for 54.2% of the agricultural testing market size in 2025, while safety testing is advancing at a 7.6% CAGR through 2031.
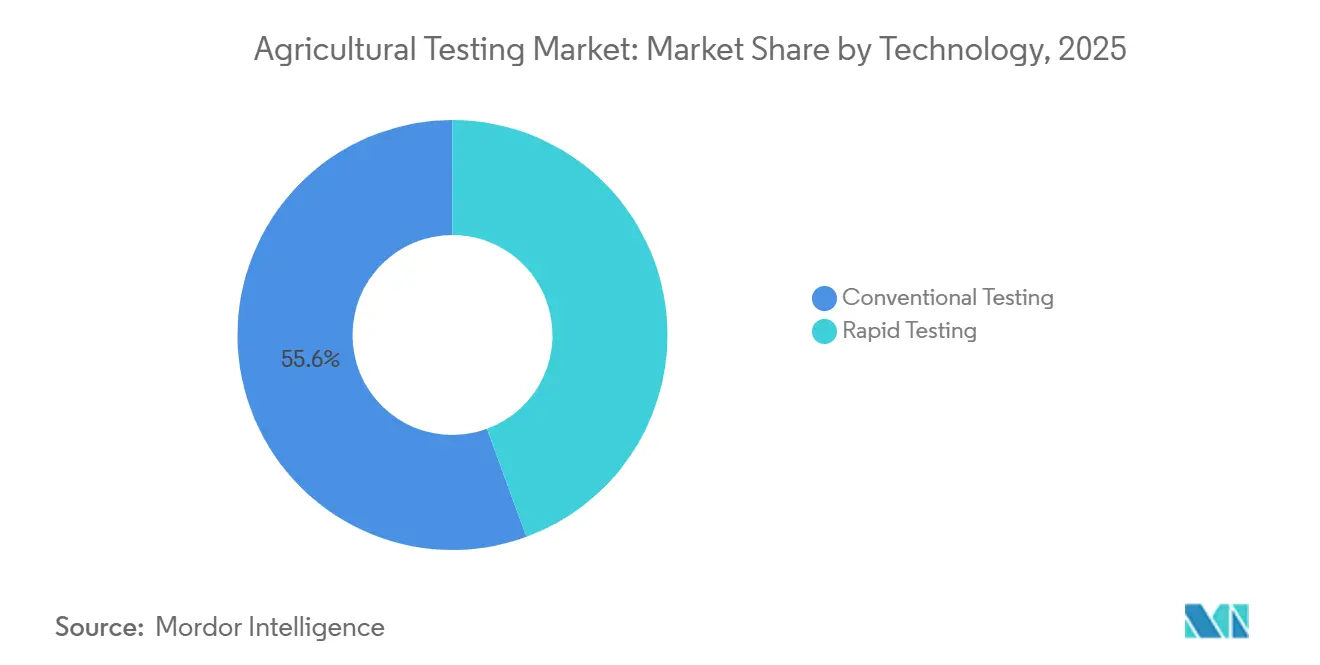
- By technology, rapid methods accounted for 55.6% of revenue in 2025 and are anticipated to post the highest CAGR of 9.2% over 2026-2031.
- Regionally, North America captured 39% of 2025 revenue, whereas Asia-Pacific is forecast to rise at an 8.8% CAGR through 2031.
- The agricultural testing market is moderately concentrated, with key players holding a significant share. SGS Société Générale de Surveillance SA (SGS SA), Eurofins Scientific SE, Intertek Group plc, PerkinElmer, Inc., and Institut Mérieux (Mérieux NutriSciences Corporation) collectively dominate the market, accounting for a significant share of 2025 revenue.
Note: Market size and forecast figures in this report are generated using ���ϲ�����’s proprietary estimation framework, updated with the latest available data and insights as of January 2026.
Global Agricultural Testing Market Trends and Insights
Drivers Impact Analysis
| Driver | (~) % Impact on CAGR Forecast | Geographic Relevance | Impact Timeline |
|---|---|---|---|
| Stringent food-safety regulations tightening worldwide | +1.2% | North America and the European Union | Medium term (2–4 years) |
| Escalating food-borne illness outbreaks driving rapid test adoption | +0.9% | North America and the European Union | Short term (≤2 years) |
| Surge in organic food trade requiring certification testing | +0.8% | European Union import hubs and United States retailers | Medium term (2–4 years) |
| On-site DNA/Nanopore sequencing unlocking field pathogen diagnostics | +0.7% | Asia-Pacific innovation clusters and United States specialty crops | Long term (≥4 years) |
| Carbon-credit soil programs spurring high-frequency soil health testing | +0.6% | North America and European Union carbon markets, and South American pilots | Long term (≥4 years) |
| Blockchain traceability clauses in export contracts boosting verified test data | +0.5% | Asia-Pacific to the European Union and North America export routes | Medium term (2–4 years) |
| Source: ���ϲ����� | |||
Stringent Food-Safety Regulations Tightening Worldwide
United States Food and Drug Administration revisions that took effect in 2024 require two agricultural-water tests per growing cycle, adding significant recurring volume to the agricultural testing market [1]Source: U.S. Food and Drug Administration, “FSMA Final Rule on Produce Safety,” FDA.gov. The European Commission has announced reductions in the maximum residue levels for 47 pesticides, effective in 2025. This change requires exporters from countries such as Brazil, India, and Kenya to provide multi-matrix certificates to avoid rejection at entry checkpoints. Additionally, China now mandates dual testing, at the origin and the port of entry, for all fresh produce shipments, effectively doubling the number of analyses required per consignment. Laboratories with validations from the Association of Official Analytical Chemists are prioritized on retailer vendor lists, as compliance audits increasingly focus on verifying method equivalency. Consequently, the agricultural testing market benefits from regulation-driven demand stability, even during periods of commodity downturns.
Escalating Food-Borne Illness Outbreaks Driving Rapid Test Adoption
Between 2024 and 2025, the Centers for Disease Control and Prevention linked 12 multistate Salmonella outbreaks to cantaloupes, cucumbers, and leafy greens, leading retailers to stipulate same-day pathogen clearances before accepting shipments[2]Source: Centers for Disease Control and Prevention, “Foodborne Outbreaks,” cdc.gov. Portable polymerase chain reaction (PCR) kits can now detect Salmonella, Escherichia coli O157:H7, and Listeria within 90 minutes on-site, positioning them as a valuable tool in the agricultural testing market. A USD 15 field strip helps prevent recalls that can cost over USD 500,000, making growers more inclined to accept the higher per-test cost. In the United Kingdom, regulators have mandated weekly environmental swabbing in packhouses starting in January 2026, increasing demand for rapid testing solutions. However, adoption remains inconsistent in regions where interruptions in cold-chain logistics or power supply affect reagent stability.
Surge in Organic Food Trade Requiring Certification Testing
Retail organic sales hit USD 150 billion in 2025, and both European Union Regulation 2018/848 and the United States National Organic Program call for residue testing at parts-per-billion sensitivity, elevating laboratories with Liquid chromatography-tandem mass spectrometry (LC-MS/MS) fleets into strategic partners[3]Source: Agricultural and Processed Food Products Export Development Authority, “Organic Export Statistics FY 2024-25,” apeda.gov.in. India, for example, shipped USD 1.2 billion in organic spices, teas, and basmati rice but experienced a 22% rejection rate at European ports due to trace levels of pesticides, underscoring the quality gatekeeping role of the agricultural testing market. Certification bodies such as Ecocert now require quarterly soil and tissue panels for farms exceeding 50 hectares, doubling historical submission frequency. For multi-ingredient organic products, each component must carry its own certificate, multiplying demand for discrete analyses per stock-keeping unit. Laboratories that bundle sampling, logistics, and analytics capture repeat business while embedding higher switching costs into client contracts.
On-Site Deoxyribonucleic Acid (DNA) and Nanopore Sequencing Unlocking Field Pathogen Diagnostics
Oxford Nanopore Technologies has introduced a pocket-sized sequencer weighing 120 grams and priced under USD 1,000, reducing the turnaround time for diagnosing diseases such as Xylella fastidiosa from one week to four hours. Early vineyard trials in California reported a 30% reduction in fungicide usage due to real-time viral detection enabling targeted spraying. In November 2025, the United States Department of Agriculture (Animal and Plant Health Inspection Service) validated nanopore protocols for citrus greening, paving the way for subsidies for growers adopting these kits. However, data analytics remains a challenge, with fewer than 15% of agronomists able to run open-source pipelines. This has led cloud vendors to offer subscription services priced between USD 5,000 and USD 15,000 annually. These advancements are transitioning field-deployable genomics from pilot projects to mainstream applications, creating new opportunities within the agricultural testing market.
Restraint Impact Analysis
| Restraint | (~) % Impact on CAGR Forecast | Geographic Relevance | Impact Timeline |
|---|---|---|---|
| High Capital Cost of Advanced Laboratory Instrumentation | -0.8% | Middle East, Africa, South America, and emerging Asian labs | Medium term (2–4 years) |
| Acute Shortage of Skilled Laboratory Technicians | -0.6% | United States, United Kingdom, and Asia-Pacific | Short term (≤2 years) |
| Non-Standard Data Formats Limiting Artificial Intelligence (AI) Interoperability Across Labs | -0.4% | Global, with fragmented Laboratory Information Management System (LIMS) ecosystems in the Asia-Pacific and South America | Long term (≥4 years) |
| Rising Reagent Import Tariffs Straining Small Laboratory Margins | -0.5% | North America and the European Union, and supply-chain dependent Africa and the Middle East | Medium term (2–4 years) |
| Source: ���ϲ����� | |||
High Capital Cost of Advanced Laboratory Instrumentation
In 2025, the cost of a single liquid chromatography-tandem mass spectrometer, required to achieve 0.01 ppm pesticide thresholds, ranged from USD 400,000 to USD 600,000. Similarly, an inductively coupled plasma mass spectrometer for heavy metal analysis was priced between USD 300,000 and USD 500,000. While leasing options allowed these costs to be spread over three to five years, they often required bank guarantees that many regional operators found difficult to secure. The expansion of the Bureau of Industry and Security (BIS) Entity List in March 2025, along with the rescission of the Artificial Intelligence (AI) Diffusion Rule in May, created a significant regulatory backlog for technology buyers in the Middle East. Shipments of sensitive components frequently faced delays of up to 9 months in license processing. In countries such as Nigeria and Indonesia, limited infrastructure and skill shortages have led to the outsourcing of analytical testing to hubs in South Africa and Singapore, where companies like Eurofins and SGS hold dominant positions. This dependency increases costs, reduces local profit margins, and slows the growth of the agricultural testing market.
Acute Shortage of Skilled Laboratory Technicians
The American Society for Clinical Laboratory Science reported a 35% vacancy rate in United States agricultural laboratories as of January 2025, a significant increase from 18% five years earlier. Similarly, Brexit has exacerbated workforce shortages in the United Kingdom, where 2,400 qualified analysts are absent from payrolls. While automation can reduce manual pipetting steps by 60%, the cost of robots, ranging from USD 150,000 to 300,000, presents financial challenges for smaller laboratories, requiring a balance between staffing and capital investment. In India, less than 40% of accredited laboratories employ staff with postgraduate degrees in analytical chemistry, posing quality-control risks when conducting high-sensitivity methods. Persistent talent shortages may limit throughput, even as the agricultural testing market faces increasing sample volumes.
Segment Analysis
By Sample: Soil Dominance Meets Seed Surge
Soil assays accounted for 45.6% of the agricultural testing market size in 2025, underscoring their central role in nutrient budgeting, heavy-metal surveillance, and carbon trading enrollment. The category anchors the agricultural testing market size at the farm level. Seed tests are expanding at an 8.8% CAGR to 2031, the swiftest pace among samples, because phytosanitary rules require pathogen-free lots before cross-border shipment. Soil biology panels now include microbial biomass metrics, a feature currently offered by fewer than 20% of laboratories and typically priced at a premium. Specialized but smaller segments of demand include testing for water, biosolids, manure, and plant tissue.
Carbon-credit protocols mandate baseline and annual soil sampling, providing consistent revenues that help mitigate seasonal fluctuations. In February 2025, the United States Natural Resources Conservation Service updated its guidelines to require 60-centimeter cores, effectively doubling the sample volume per farm and driving increased throughput in the agricultural testing market. Additionally, the International Plant Protection Convention's mandates on seed pests have transformed germination, purity, and disease checks into essential trade requirements. Water testing demand may rise if the Environmental Protection Agency implements mandatory pre-season screenings for operations with ten or more workers, potentially creating a USD 200-300 million market segment for laboratories in the United States.
Note: Segment shares of all individual segments available upon report purchase
By Application: Quality Assurance Leads, Safety Accelerates
Quality assurance accounted for 54.2% of the agricultural testing market in 2025, as growers rely on nutrient and moisture profiles to maximize yields and meet grade specifications. Safety testing, while smaller today, is climbing at a 7.6% CAGR through 2031 on the back of retailer clauses that demand 250-plus pesticide panels per produce lot. The expansion of private-label products by global grocers is prompting suppliers to implement verification processes beyond regulatory requirements, thereby expanding the scope of mandatory testing. Organic handlers are now subject to unannounced residue screenings on 5% of inbound cargoes, adding to the existing safety measures within the agricultural testing market.
Retailers view testing costs as a safeguard against brand-damaging recalls, leading laboratories that provide integrated services such as bundled logistics, analytics, and digital certificate uploads to secure multi-year contracts. Precision agriculture software that incorporates nutrient maps derived from quality reports helps quantify yield improvements, supporting the case for repeat testing. Laboratories categorize organic residue panels under quality assurance to align with program documentation, despite their overlap with safety objectives. This dual-purpose testing approach ensures high utilization rates, even during non-peak harvest periods.
By Technology: Rapid Methods Capture Speed Premium
Rapid assays accounted for 55.6% of the agricultural testing market in 2025 and are anticipated to achieve a 9.2% CAGR through 2031, driven by lateral-flow immunoassays, portable Polymerase Chain Reaction (PCR), and near-infrared readers that compress decision cycles to minutes or hours. Time savings often outweigh the 30-50% price premium, especially when each day's delay can reduce lettuce shelf life by two days. Conventional culture and wet-chemistry methods remain the standard for mycotoxin quantification, with high-performance liquid chromatography offering superior performance to rapid kits at sub-2 ppb detection limits. Regulators now support tiered protocols that enable rapid screening followed by conventional confirmation, fostering a balanced coexistence of methods.
The Association of Official Agricultural Chemists (AOAC) validated 14 new rapid methods for fresh produce during 2024-2025, broadening the range of compliant tools available. Companies like Bruker and Foss have introduced hand-held near-infrared meters capable of sorting grains in real time, effectively transforming grain elevators into micro-laboratories. However, in low-income regions, challenges such as unreliable electricity and limited refrigeration continue to hinder conventional testing. Consequently, investment in agricultural testing technologies aligns with both market demand and infrastructure readiness, driving regional differences in technology adoption.
Note: Segment shares of all individual segments available upon report purchase
Geography Analysis
North America is projected to lead the agricultural testing market, accounting for 39% of global revenue in 2025. This dominance is attributed to the mandates of the Food Safety Modernization Act and a well-established laboratory network that employs robotics to expedite pesticide testing. Laboratories in key states such as California, Florida, and Texas concentrate testing capacity, enabling exporters to secure certificates within 36 hours. In contrast, Asia-Pacific is the fastest-growing region, with a compound annual growth rate of 8.8% through 2031. This growth is driven by China's tightening of residue limits and India's expansion of organic farming acreage. Both regions benefit from robust government programs that subsidize testing, though their growth is influenced by distinct factors, such as North America's focus on compliance enforcement and Asia-Pacific's emphasis on export-led certification.
Europe, South America, the Middle East, and Africa collectively represent a mix of surplus capacity and emerging demand. European laboratories experience underutilization during off-peak months, though increased mycotoxin surveillance helps alleviate this challenge. In South America, commodity exports remain a primary driver, with robotic testing lines in Brazil and Argentina significantly reducing turnaround times for soybean and beef certification. The Middle East's food security programs and Africa's aflatoxin initiatives are spurring investments in regional laboratories. However, logistical constraints and shortages of skilled labor continue to hinder progress in these regions.
North America is focusing on integrating rapid screening with blockchain technology to further reduce clearance times and attract premium contracts. In Asia-Pacific, laboratories are expanding their capabilities by installing additional Liquid Chromatography with Tandem Mass Spectrometry instruments to meet export requirements, while mobile units are extending services to rural farming areas. European providers are diversifying into carbon-credit soil projects to reduce reliance on residue testing. Meanwhile, laboratories in South America and Africa are bundling sampling and analytics services to appeal to multinational clients. These initiatives collectively contribute to incremental volume growth across all regions, with regulatory stringency and digital readiness playing a critical role in determining regional growth rates.
Competitive Landscape
The agricultural testing market is moderately concentrated, with key players holding a significant share. SGS Société Générale de Surveillance SA (SGS SA), Eurofins Scientific SE, Intertek Group plc, PerkinElmer, Inc., and Institut Mérieux (Mérieux NutriSciences Corporation) collectively dominate the market, accounting for a significant share of 2025 revenue. These five companies play a central role globally, offering extensive multi-matrix portfolios and worldwide sampling capabilities that help reduce clients' procurement challenges. They maintain accreditations such as ISO/IEC 17025 and United States Department of Agriculture foreign laboratory certifications, ensuring compliance with the standards multinational clients require. Additionally, these firms integrate laboratory information systems with retailer blockchains, enabling same-day certificate uploads.
The financial strength of these top players allows them to maintain advanced technologies, such as Liquid Chromatography with tandem Mass Spectrometry (LC-MS/MS) and Inductively Coupled Plasma Mass Spectrometry (ICP-MS), with refresh cycles every three years an operational pace that few competitors can match. In January 2026, Intertek Group plc strengthened its market position by adopting digital traceability solutions through platforms like IBM Food Trust. PerkinElmer, Inc. has diversified its operations by offering carbon-credit soil services in Australia, reducing its reliance on mining analytics. These diversified networks distribute fixed costs across environmental, pharmaceutical, and consumer-packaged goods segments, mitigating the impact of agricultural market fluctuations.
Smaller, niche laboratories compete by focusing on faster turnaround times and specialized local expertise, often targeting areas such as biosolids or seed pathology to avoid direct competition with global leaders. However, the high cost of instruments, ranging from USD 300,000 to 800,000, and reagent tariff surcharges create significant barriers to scaling operations. Blockchain clauses in export contracts are driving a two-tier market structure, where digitally advanced laboratories secure premium accounts, while analog operators face stagnation. Patent data highlights increasing investments in sequencing technologies, immunoassay reagents, and Artificial Intelligence (AI) for anomaly detection, indicating a trend toward greater technology-driven differentiation in the market.
Agricultural Testing Industry Leaders
Eurofins Scientific SE
SGS Société Générale de Surveillance SA (SGS SA)
Intertek Group plc
PerkinElmer, Inc.
Institut Mérieux (Mérieux NutriSciences Corporation)
- *Disclaimer: Major Players sorted in no particular order
Recent Industry Developments
- January 2026: The United States Environmental Protection Agency launched a dedicated biopesticides registration portal that posts real-time status updates and public comments, a step projected to accelerate approvals for biological crop-protection products.
- September 2025: Eurofins Scientific completed its planned acquisition of all related-party-owned sites, consolidating them into a single purchased entity with asset scope and valuation aligned to its July 2025 disclosure. The transaction eliminates nearly all related‑party rent obligations, projected to fall to negligible levels and ultimately to zero as remaining leases expire, while adding less than 0.2x to the company’s leverage through bond‑financed funding, strengthening operational efficiency and governance transparency.
- July 2025: Eurofins Scientific SE acquired Nutrilab Agro, a company providing analytical and advisory services to agricultural producers and certified consultants across the Netherlands. The acquisition enables Eurofins Agro Testing to strengthen its position in the Dutch market while supporting Nutrilab Agro's growth and innovation initiatives.
Global Agricultural Testing Market Report Scope
Agricultural testing involves analyzing soil, water, seeds, crops, fertilizers, and other agricultural inputs to ensure optimal conditions for plant growth, yield, and safety. It helps in determining soil composition, nutrient levels, pH balance, and potential contamination. The purpose of agriculture testing is to improve crop productivity, quality, and sustainability while minimizing environmental impacts.
The Agricultural Testing Market Report is Segmented by Sample (Water Testing, Soil Testing, Seed Testing, Bio-Solids Testing, Manure Testing, and Other Samples), Application (Safety Testing and Quality Assurance), Technology (Conventional Testing and Rapid Testing), and Geography (North America, Europe, Asia-Pacific, South America, Middle East, and Africa). The Market Forecasts are Provided in Terms of Value (USD).
| Water Testing |
| Soil Testing |
| Seed Testing |
| Bio-solids Testing |
| Manure Testing |
| Other Samples |
| Safety Testing |
| Quality Assurance |
| Conventional Testing |
| Rapid Testing |
| North America | United States |
| Canada | |
| Mexico | |
| Rest of North America | |
| Europe | Germany |
| United Kingdom | |
| France | |
| Russia | |
| Spain | |
| Rest of Europe | |
| Asia-Pacific | India |
| China | |
| Australia | |
| Japan | |
| Rest of Asia-Pacific | |
| South America | Brazil |
| Argentina | |
| Rest of South America | |
| Middle East | Saudi Arabia |
| United Arab Emirates | |
| Rest of Middle East | |
| Africa | South Africa |
| Nigeria | |
| Rest of Africa |
| By Sample | Water Testing | |
| Soil Testing | ||
| Seed Testing | ||
| Bio-solids Testing | ||
| Manure Testing | ||
| Other Samples | ||
| By Application | Safety Testing | |
| Quality Assurance | ||
| By Technology | Conventional Testing | |
| Rapid Testing | ||
| By Geography | North America | United States |
| Canada | ||
| Mexico | ||
| Rest of North America | ||
| Europe | Germany | |
| United Kingdom | ||
| France | ||
| Russia | ||
| Spain | ||
| Rest of Europe | ||
| Asia-Pacific | India | |
| China | ||
| Australia | ||
| Japan | ||
| Rest of Asia-Pacific | ||
| South America | Brazil | |
| Argentina | ||
| Rest of South America | ||
| Middle East | Saudi Arabia | |
| United Arab Emirates | ||
| Rest of Middle East | ||
| Africa | South Africa | |
| Nigeria | ||
| Rest of Africa | ||
Key Questions Answered in the Report
What is the current value of the agricultural testing market and its projected growth by 2031?
The agricultural testing market size is USD 8.5 billion in 2026, forecast to reach USD 11.2 billion by 2031 at a 5.67% CAGR.
Which sample type generates the most revenue for laboratories?
Soil assays lead with 45.6% of 2025 revenue due to their role in nutrient management, heavy metal monitoring, and carbon credit programs.
Why are rapid tests gaining share in agricultural analytics?
Retailers and regulators require same-day clearance, and rapid PCR or lateral flow tests reduce turnaround time from days to hours, supporting premium pricing.
Which region is expanding fastest in agricultural testing demand?
Asia Pacific, with an 8.8% CAGR through 2031, driven by stricter Chinese import standards and push towards organic certification by India..


